India NDT Market Size and Share
Market Overview
| Study Period | 2019 - 2030 |
|---|---|
| Forecast Data Period | 2025 - 2030 |
| Historical Data Period | 2019 - 2023 |
| Market Size (2025) | USD 0.75 Billion |
| Market Size (2030) | USD 1.16 Billion |
| Growth Rate (2025 - 2030) | 9.13% CAGR |
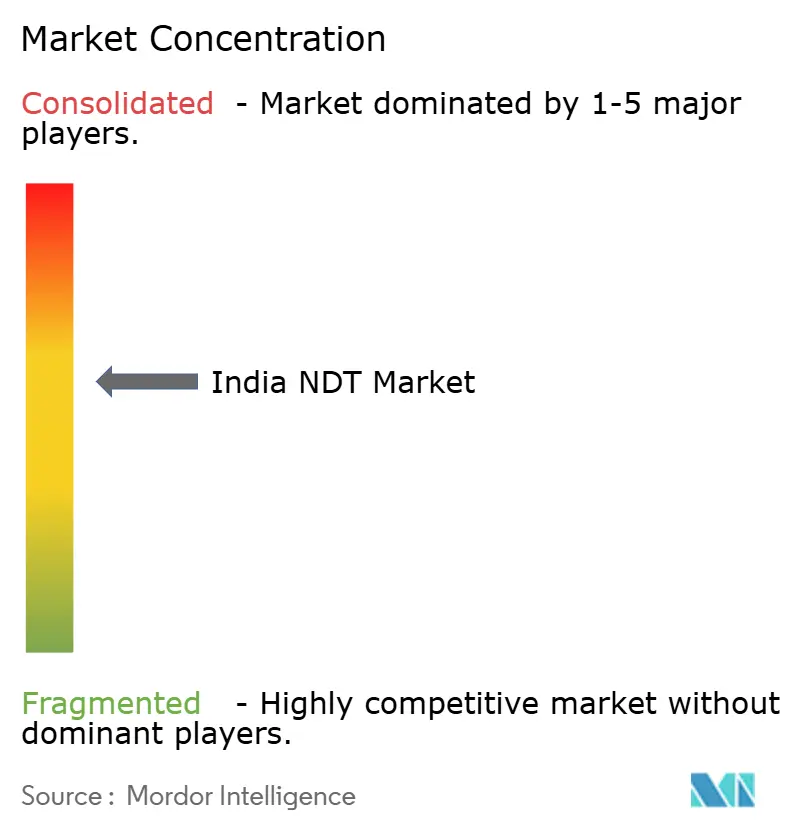
| Market Concentration | Medium |
Major Players *Disclaimer: Major Players sorted in no particular order Image © Mordor Intelligence. Reuse requires attribution under CC BY 4.0. | |

India NDT Market Analysis by Mordor Intelligence
The India NDT market size is estimated at USD 0.75 billion in 2025 and is projected to reach USD 1.16 billion by 2030, representing a 9.13% CAGR over the forecast period. This growth captures sustained inspection requirements for aging refineries, power plants, and pipeline assets operating under updated BIS and PESO compliance mandates.[1]Petroleum and Explosives Safety Organization, “PESO Regulations and Safety Standards,” peso.gov.in Service-centric business models dominate because asset owners prefer outsourced expertise, while the shift toward AI-enabled predictive analytics is steadily enlarging software demand. Expansion of city gas distribution networks, Make in India aerospace programs, and renewable energy life-extension projects are broadening the application base. Competitive advantage is increasingly based on the depth of certification, digital workflow integration, and geographic proximity to dense industrial clusters across Maharashtra, Gujarat, and Tamil Nadu.
Key Report Takeaways
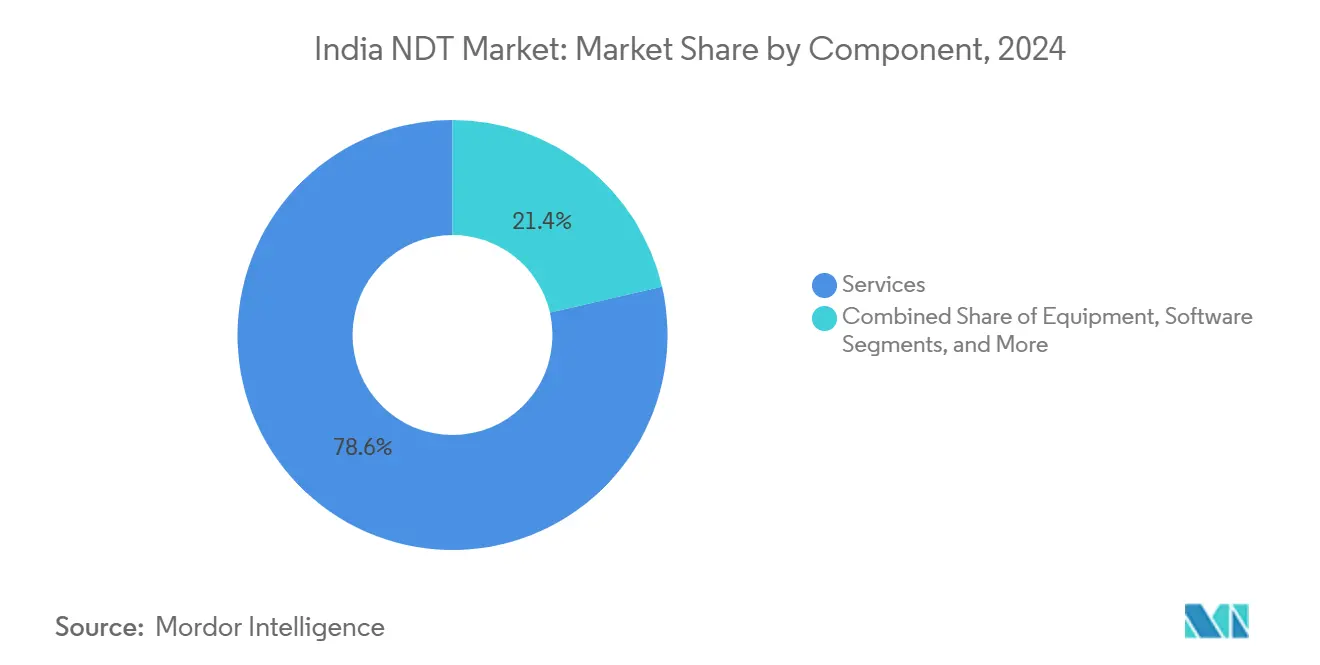
- By component, services held 78.6% of the Indian NDT market share in 2024, while software is expected to advance at a 14.5% CAGR through 2030.
- By testing method, ultrasonic testing accounted for 27.3% of the India NDT market size in 2024, whereas eddy-current testing is projected to expand at a 11.5% CAGR through 2030.
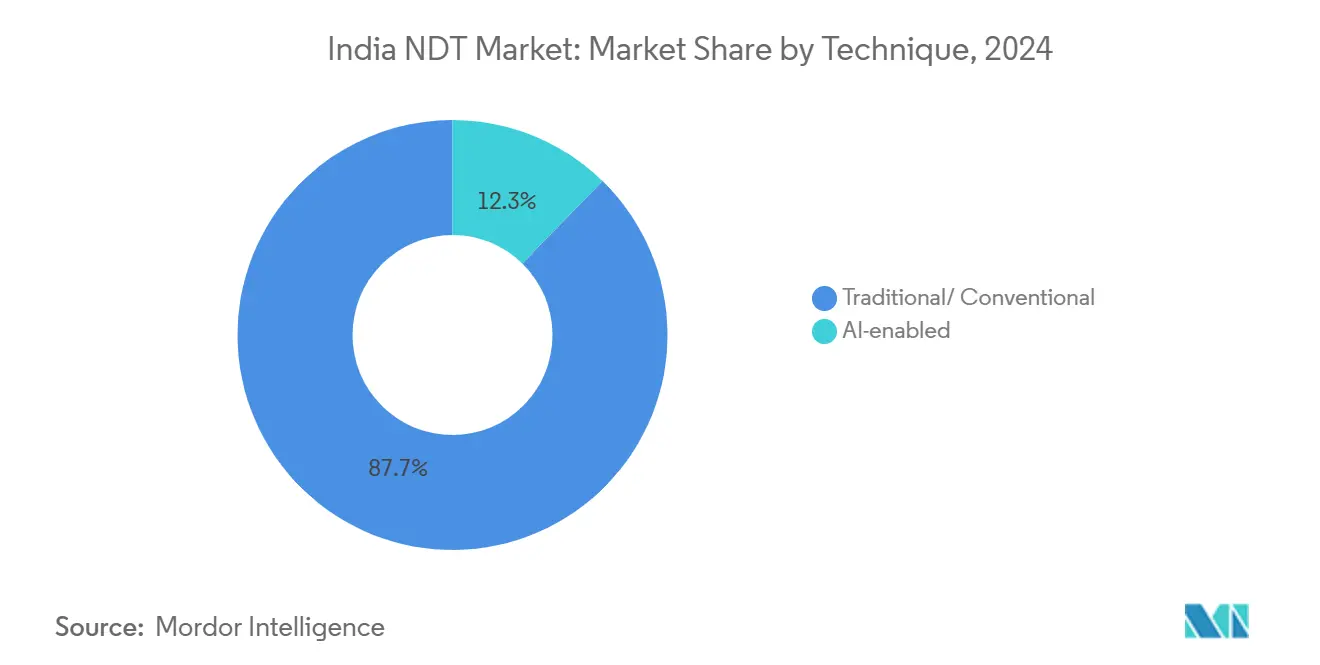
- By technique, traditional methods maintained 87.7% revenue share in 2024; AI-enabled systems are forecast to grow at a 17.6% CAGR between 2025 and 2030.
- By end-user, the oil and gas sector led the India NDT market, accounting for 24.8% of the market size in 2024. The automotive and transportation sector is expected to register the fastest CAGR of 11.4% through 2030.
India NDT Market Trends and Insights
Drivers Impact Analysis*
| Driver | (~) % Impact on CAGR Forecast | Geographic Relevance | Impact Timeline |
|---|---|---|---|
| An aging industrial asset base across refineries, power plants, and pipelines | +2.8% | National, concentrated in Gujarat, Maharashtra, and Tamil Nadu industrial clusters. | Medium term (2-4 years) |
| Stringent Indian safety regulations (BIS, PESO) mandating periodic inspections | +2.1% | National, with stricter enforcement in the petroleum and chemical sectors | Short term (≤ 2 years) |
| Expansion of city gas distribution pipelines under PNGRB bids | +1.9% | Urban centers and tier-2 cities, particularly in North and West India | Medium term (2-4 years) |
| Growth in aerospace and defense manufacturing under Make in India | +1.4% | Bangalore, Hyderabad, Chennai aerospace corridors | Long term (≥ 4 years) |
| Life-extension of wind turbine blades and solar structures | +0.7% | Gujarat, Rajasthan, and Tamil Nadu renewable energy hubs | Medium term (2-4 years) |
| Industry 4.0 adoption of AI-enabled predictive NDT analytics | +0.4% | Manufacturing clusters in Maharashtra, Tamil Nadu, and Karnataka | Long term (≥ 4 years) |
| Source: Mordor Intelligence | |||
Aging Industrial Asset Base Drives Inspection Demand
India’s 250 million ton annual refining capacity operates through facilities that are, on average, three decades old, compelling operators to schedule long-range ultrasonic and phased-array inspections for vessels, exchangers, and piping to prevent wall-thinning failures. Thermal power plants face similar reliability thresholds that intensify demand for periodic NDT audits. Predictive maintenance strategies rely on continuous data acquisition, thus elevating the adoption of digital radiography and corrosion mapping solutions. Regional clustering in Gujarat and Maharashtra creates dense inspection cycles, generating steady revenue visibility for certified service firms. As legacy assets approach life-extension milestones, the India NDT market continues to receive budget allocations, even as overall capital expenditure slows.
Stringent Safety Regulations Mandate Compliance-Driven Growth
The PESO framework prescribes statutory inspection intervals for storage tanks, pipelines, and pressure vessels, making third-party certification a non-negotiable operating requirement. BIS updates since 2024 now reference advanced ultrasonic and computed radiography techniques for critical components, prompting asset owners to procure higher-end equipment. Regulatory enforcement carries operational shutdown penalties, converting inspection spend from discretionary to mandatory outlay. Established providers with NABL accreditation benefit because smaller competitors struggle to meet process documentation thresholds. Compliance-driven demand also accelerates software uptake for digital traceability, supporting the upward trajectory of the India NDT market.
Pipeline Expansion Under PNGRB Creates Infrastructure Inspection Needs
The Petroleum and Natural Gas Regulatory Board aims to install 11,000 km of new city gas pipelines by 2025, with each segment requiring weld radiography, ultrasonic thickness gauging, and hydrostatic validation prior to commissioning.[2]Petroleum and Natural Gas Regulatory Board, cited in Indian Petro Plus archives, indianpetroplus.com Distributed project sites across tier-2 cities favor mobile inspection units and regional service providers. Post-commissioning, operators deploy intelligent pigging and guided-wave ultrasonic technologies for lifecycle monitoring, guaranteeing multiyear revenue streams. Heightened public safety scrutiny following recent leaks has tightened acceptance criteria, further embedding NDT in project schedules. Consequently, the India NDT market enjoys a predictable pipeline of jobs tied directly to national energy policy.
Make in India Aerospace Manufacturing Elevates Quality Standards
Aerospace corridors in Bangalore, Hyderabad, and Chennai host composite airframe, engine, and avionics production that must meet NADCAP and international OEM criteria. DRDO’s indigenous AI-assisted computed tomography platform shortens defect recognition cycles while ensuring zero-defect delivery requirements. High-resolution volumetric inspection of carbon-fiber structures, advanced ultrasonic testing of bonded joints, and fluorescent penetrant evaluation of turbine blades create demand for multi-method labs. Defense offsets and commercial aircraft localization draw global primes to partner with local NDT specialists, increasing knowledge transfer and driving the high-growth software segment of the India NDT market.
Restraints Impact Analysis*
| Restraint | (~) % Impact on CAGR Forecast | Geographic Relevance | Impact Timeline |
|---|---|---|---|
| High upfront cost of advanced NDT equipment | -1.8% | National, particularly affecting the MSME sector adoption | Short term (≤ 2 years) |
| Shortage of ASNT-Level III certified technicians | -1.2% | National, with acute shortages in tier-2 cities | Medium term (2-4 years) |
| Fragmented state-wise implementation of inspection standards | -0.9% | Varies by state regulatory enforcement capabilities | Medium term (2-4 years) |
| Import dependence for phased-array probes and high-end sensors | -0.6% | National, affecting technology adoption rates | Short term (≤ 2 years) |
| Source: Mordor Intelligence | |||
High Upfront Cost of Advanced NDT Equipment
Phased-array ultrasonic units priced above USD 100,000, along with fully equipped labs exceeding USD 500,000, deter market entry for small service firms. Capital intensity tilts competitive advantage toward incumbents with multiyear contracts. Equipment leasing schemes exist, but limited awareness and financing hurdles restrict uptake. Consequently, many MSMEs continue to rely on conventional magnetic particle and dye penetrant offerings, thereby limiting the adoption of advanced non-destructive testing (NDT) modalities within the Indian NDT market.
Shortage of ASNT-Level III Certified Technicians
Less than 1,700 ASNT-Level III professionals currently serve India’s expanding asset base, with significant gaps in the industrial belts of Uttar Pradesh, Odisha, and Madhya Pradesh.[3]American Society for Nondestructive Testing, “ASNT India Facility and Training Programs,” asnt.org Wage premiums rise as projects compete for scarce experts able to design and validate multi-method procedures. Training centers inaugurated in Chennai in 2024 have improved throughput; however, recertification cycles and method-specific specializations continue to limit availability. Staffing shortfalls prolong project timelines and increase costs, exerting a measurable drag on the growth rate of the India NDT market.
*Our forecasts treat driver/restraint impacts as directional, not additive. The impact forecasts reflect baseline growth, mix effects, and variable interactions.
Segment Analysis
By Component: Services Dominance Amid Software Acceleration
Services accounted for 78.6% of the Indian NDT market share in 2024, as statutory inspections for refineries and power plants require certified personnel on-site at fixed intervals. The services portion of the India NDT market size consistently absorbs budget allocations from mandatory shutdown audits. In contrast, software contributed a modest share but is expanding at a 14.5% CAGR as AI-driven defect recognition tools integrate with portable scanners, thereby shortening reporting cycles and reducing the need for subjective interpretation.
The widening software footprint signals a shift in business model, where inspection data are centralized on cloud platforms, enabling predictive analytics and remote Level III sign-offs. Equipment sales remain stable, supporting the growth of fleets of portable phased-array sets, while consumables continue to grow steadily in tandem with test volumes. Consequently, hybrid offerings that bundle field services with analytics subscriptions are emerging as a differentiator within the India NDT market.


By Testing Method: Ultrasonic Leadership Faces Eddy-Current Innovation
Ultrasonic testing accounted for 27.3% of the Indian NDT market size in 2024, owing to its versatility across weld, casting, and corrosion mapping applications. Robust technician training programs and continual probe improvements sustain its primacy. Eddy-current testing is expected to grow at a 11.5% CAGR through 2030, driven by demand for rapid heat-exchanger tube screening and aircraft surface crack detection, which eliminates the need for surface preparation. Radiography remains indispensable for inspecting dense welds, while visual inspection retains relevance for making quick accept-reject decisions.
Eddy-current’s portable probes and increasing automation fit lean maintenance windows, improving utilization rates at petrochemical complexes. Integration with robotic crawlers enables scanning of offshore risers, boosting adoption. As industries prioritize minimizing turnaround, these efficiency gains reinforce the trajectory of the India NDT market.
By Technique: Traditional Methods Sustain Market While AI-Enabled Systems Accelerate
Traditional techniques accounted for 87.7% of the revenue in 2024, underscoring entrenched procedures approved by regulators and insurers. However, AI-enabled modalities, which currently account for 12.3%, are expected to exhibit a 17.6% CAGR as deep-learning algorithms demonstrate superior radiograph interpretation accuracy. Pilot deployments in automotive and aerospace plants show a 30% faster defect classification, resulting in lower rework costs.
Full migration depends on technician upskilling and investments in data management and cybersecurity. Hybrid workflows—combining digital capture with AI-assisted review, followed by Level III sign-off—are becoming the standard. This convergence preserves compliance while capitalizing on analytics, solidifying long-term expansion of the India NDT market.
By End-User Industry: Oil and Gas Leadership Amid Automotive Transformation
Oil and gas contributed 24.8% of 2024 revenue, reflecting extensive pipelines and refinery networks subject to PESO statutes. Mandatory internal and external corrosion assessments lock in recurring work scopes. The automotive and transportation sector is forecast to post an 11.4% CAGR, as electric vehicle gigafactories require battery weld CT scans and composite body panel ultrasounds.
Power generation sustains baseline demand through turbine blade and boiler tube inspections, while aerospace relies on NADCAP-compliant labs for composite fuselage integrity. Sector diversification cushions macro-volatility, ensuring the India NDT market remains balanced across capital- and volume-driven verticals.
Geography Analysis
Western India, comprising Maharashtra and Gujarat, accounts for the majority of the Indian NDT market, primarily driven by refineries, petrochemical complexes, and auto OEM clusters.[4]Drishti IAS, “India Industrial Land Bank,” drishtiias.com Southern hubs in Tamil Nadu, Karnataka, and Telangana are adding aerospace, electronics, and renewable energy projects that require specialized ultrasound and CT capabilities. These states also lead in Industry 4.0 adoption, reinforcing growth momentum.
Eastern expansion is accelerating, as illustrated by TCR Engineering’s December 2024 Bhubaneswar lab, which shortens the turnaround time for mining and steel clients in Odisha, Jharkhand, and West Bengal. Northern markets benefit from PNGRB pipeline rollout and hydro project refurbishments, fueling demand for mobile radiography rigs. Tier-2 cities, such as Indore and Varanasi, now host NABL-accredited labs, reflecting the decentralization of testing capacity.
State-specific variations in inspection enforcement create operational complexity. National firms maintain satellite offices to navigate licensing requirements, while local players leverage their familiarity with provincial regulators. Harmonization efforts by BIS are underway, but staggered adoption timelines maintain regional nuances, which influence competitive dynamics within the Indian NDT market.
Competitive Landscape
The India NDT market exhibits moderate concentration, with the top five providers controlling a majority of the revenue share. Global leaders SGS, Bureau Veritas, and Intertek leverage worldwide accreditation suites and advanced digital platforms. Bureau Veritas’ prior acquisition of Sievert broadened its oil and gas footprint and access to guided-wave ultrasonic expertise. Domestic specialists such as TCR Engineering and Bharat NDT Services capitalize on geographic proximity and sector-specific knowledge.
Technology leadership shapes competitive edge. Providers deploying AI-enabled radiograph analytics report a 25% faster turnaround and reduced client downtime, which are key differentiators in high-penalty sectors. Investments also focus on drone-based infrared thermography for flare stacks and solar farms. Certification depth, such as ASNT, ISO 9712, and NADCAP, as well as multi-method portfolios, remain key prerequisites for bids. Market entry barriers persist because PESO registration and NABL accreditation demand capital and compliance rigor, limiting commoditization and sustaining pricing power in the India NDT market.
India NDT Industry Leaders
Mistras Group (India) Pvt Ltd
Olympus India Pvt Ltd
Eddyfi Technologies India Pvt Ltd
Zetec India Pvt Ltd
Applus+ Velosi India Pvt Ltd
- *Disclaimer: Major Players sorted in no particular order

Recent Industry Developments
- February 2025: RVS Quality Certifications extended NABL-accredited NDT labs to Mumbai, Delhi, Indore, and Varanasi, enhancing regional access to advanced testing.
- January 2025: ROSEN opened a new Indian office, expanding global provider presence for in-line pipeline inspection technologies.
- January 2025: PNGRB announced an 11,000 km city gas pipeline expansion, triggering large-scale radiographic and ultrasonic commissioning work across urban corridors.
- December 2024: Planys Technologies secured USD 5.8 million in funding to scale its underwater robotic NDT offerings for ports and dams.


India NDT Market Report Scope
| Equipment |
| Software |
| Services |
| Consumables |
| Ultrasonic Testing |
| Radiographic Testing |
| Magnetic Particle Testing |
| Liquid Penetrant Testing |
| Visual Inspection Testing |
| Eddy-Current Testing |
| Acoustic Emission Testing |
| Thermography / Infrared Testing |
| Computed Tomography Testing |
| Traditional / Conventional |
| AI-enabled |
| Oil and Gas |
| Power Generation |
| Aerospace |
| Defence |
| Automotive and Transportation |
| Manufacturing and Heavy Engineering |
| Construction and Infrastructure |
| Chemical and Petrochemical |
| Marine and Ship Building |
| Electronics and Semiconductor |
| Mining |
| Medical Devices |
| Others |
| By Component | Equipment |
| Software | |
| Services | |
| Consumables | |
| By Testing Method | Ultrasonic Testing |
| Radiographic Testing | |
| Magnetic Particle Testing | |
| Liquid Penetrant Testing | |
| Visual Inspection Testing | |
| Eddy-Current Testing | |
| Acoustic Emission Testing | |
| Thermography / Infrared Testing | |
| Computed Tomography Testing | |
| By Technique | Traditional / Conventional |
| AI-enabled | |
| By End-user Industry | Oil and Gas |
| Power Generation | |
| Aerospace | |
| Defence | |
| Automotive and Transportation | |
| Manufacturing and Heavy Engineering | |
| Construction and Infrastructure | |
| Chemical and Petrochemical | |
| Marine and Ship Building | |
| Electronics and Semiconductor | |
| Mining | |
| Medical Devices | |
| Others |


Key Questions Answered in the Report
What is the size of the Indian NDT market in 2025?
The market is valued at USD 0.75 billion in 2025 and is projected to reach USD 1.16 billion by 2030.
What is the expected growth rate for India NDT through 2030?
The market is forecast to expand at a 9.13% CAGR between 2025 and 2030.
Which component dominates spending in India NDT?
Services account for 78.6% of 2024 revenue because most inspections are outsourced to certified providers.
Which testing method is growing fastest in India?
Eddy-current testing is projected to grow at an 11.5% CAGR due to demand for rapid surface defect detection.
What sectors generate the most NDT demand?
The oil and gas sector leads with a 24.8% revenue share, while the automotive and transportation sector represents the fastest-growing end-user segment.
What are the main hurdles facing the industry?
High equipment costs and a shortage of ASNT-Level III technicians remain significant growth restraints.
Page last updated on:


