Market Overview
| Study Period | 2019 - 2030 |
|---|---|
| Forecast Data Period | 2025 - 2030 |
| Historical Data Period | 2019 - 2023 |
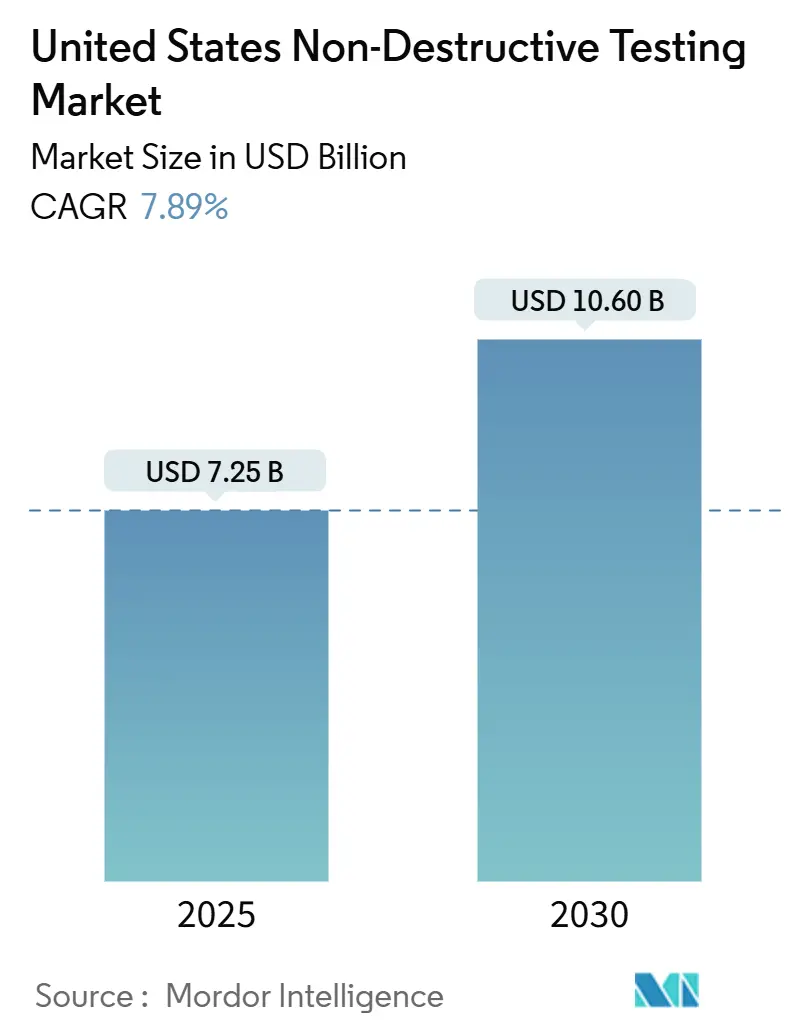
| Market Size (2025) | USD 7.25 Billion |
| Market Size (2030) | USD 10.60 Billion |
| Growth Rate (2025 - 2030) | 7.89% CAGR |
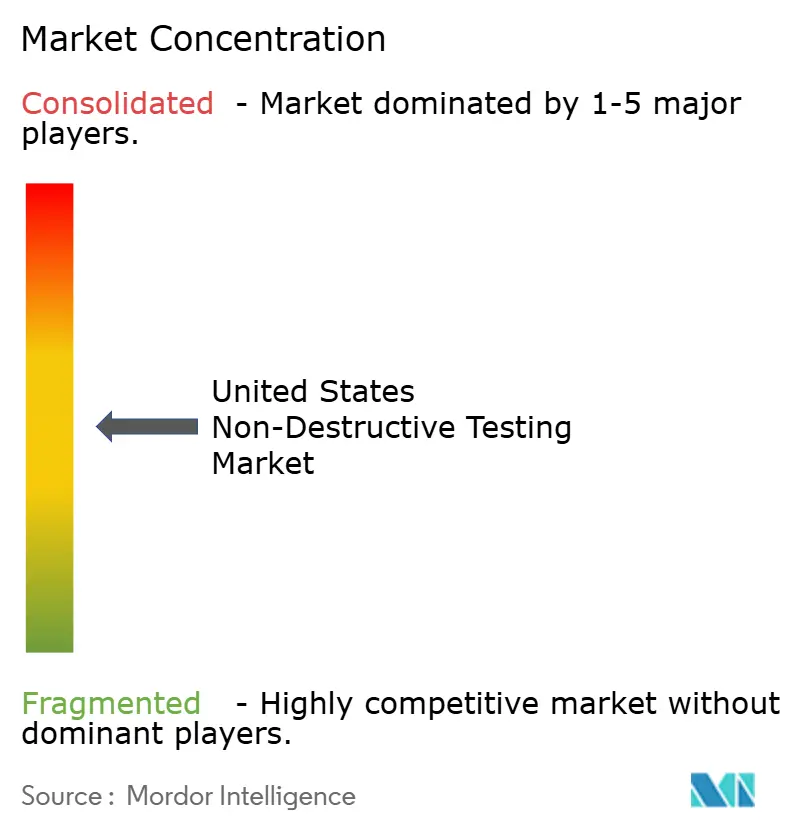
| Market Concentration | Medium |
Major Players *Disclaimer: Major Players sorted in no particular order Image © Mordor Intelligence. Reuse requires attribution under CC BY 4.0. | |
United States Non-Destructive Testing Market Analysis by Mordor Intelligence
The US NDT market size reached USD 7.25 billion in 2025 and is forecast to expand at a 7.89% CAGR, reaching USD 10.60 billion by 2030. Regulatory codes, federal infrastructure grants, and rising digitalization set the pace for growth, while an aging asset base across energy, transportation, and manufacturing sustains demand for day-to-day inspections. The integration of artificial intelligence, robotics, and cloud software is reducing inspection cycle time, lowering false-positive rates, and enabling analytics-driven service lines. Service providers that can pair certified personnel with advanced data platforms are capitalizing on price premiums, especially in nuclear, aerospace, and deep-water projects. The largest buyers remain oil and gas operators, but electric vehicle plants, hydrogen pipeline consortia, and on-site additive manufacturing hubs are scaling their inspection budgets faster than legacy markets.
Key Report Takeaways
- By component, services held 79.2% of the US NDT market share in 2024; software is projected to post a 12.6% CAGR through 2030.
- By testing method, ultrasonic testing accounted for 27.9% of the US NDT market size in 2024; eddy-current testing is projected to advance at a 9.6% CAGR through 2030.
- By technique, traditional approaches dominated the US NDT market, accounting for 88.3% of the market size in 2024. Meanwhile, AI-enabled methods are projected to rise at a 15.7% CAGR through 2030.
- By end-user industry, oil and gas accounted for 25.4% of the US NDT market size in 2024; automotive and transportation is the fastest-growing end-user at a 9.5% CAGR to 2030.
United States Non-Destructive Testing Market Trends and Insights
Drivers Impact Analysis*
| Driver | (~) % Impact on CAGR Forecast | Geographic Relevance | Impact Timeline |
|---|---|---|---|
| Increased shale and deep-water asset inspections | +1.8% | Texas, North Dakota, Gulf Coast | Medium term (2-4 years) |
| Mandatory inspection codes (ASME, API, ASTM) updates | +1.5% | National, concentrated in industrial corridors | Long term (≥ 4 years) |
| Aging nuclear and fossil power plant fleet refurbishment | +1.2% | Southeast, Northeast, Midwest | Long term (≥ 4 years) |
| Robotics-based remote NDT adoption in confined assets | +1.0% | Texas, Louisiana, California | Medium term (2-4 years) |
| Federal funding for hydrogen pipeline integrity programs | +0.8% | California, Texas, Northeast corridor | Long term (≥ 4 years) |
| In-process inline inspection demand from additive manufacturing | +0.6% | Michigan, Ohio, California | Medium term (2-4 years) |
| Source: Mordor Intelligence | |||
Increased Shale and Deep-Water Asset Inspections
Surging shale completions and renewed deep-water exploration are increasing the volumes of ultrasonic, phased-array, and guided-wave testing across high-pressure gathering lines and subsea manifolds. The Pipeline and Hazardous Materials Safety Administration awarded USD 196 million in 2024 safety grants, part of which funded advanced inspection pilots targeting unconventional resource corridors.[1]Pipeline and Hazardous Materials Safety Administration, “Pipeline Safety Grants for Advanced Inspection Technologies,” phmsa.dot.gov Operators recognize that unscheduled production losses can exceed USD 500,000 per day, strengthening the business case for predictive inspections. Remote, vehicle-mounted ultrasonics operating at extreme depths are now standard in Gulf of Mexico campaigns, and electromagnetic acoustic transducers are eliminating the need for surface preparation on coated risers, thereby reducing vessel time and personnel exposure.
Mandatory Inspection Code Updates
The American Petroleum Institute’s second edition of API 20S, issued in January 2025, embeds additive manufacturing-specific NDT annexes, effectively obligating certified service coverage for 3D-printed valves, pumps, and downhole tools.[2]American Petroleum Institute, “Second Edition of API 20S for Additive Manufacturing,” api.org Concurrently, ASME BPVC Section V added Full Matrix Capture requirements, forcing pressure vessel fabricators to requalify their procedures and personnel. Compliance-driven re-inspections immediately lift billable hours for firms equipped with matrix ultrasonics and certified operators. Insurance carriers follow regulators' lead by conditioning policy renewals on adherence to the updated codes, thereby indirectly expanding the addressable inspection volumes for the US NDT market.
Aging Nuclear and Fossil Power Plant Refurbishment
License renewals covering 94 nuclear reactors, approved through 2024, mandate full-scope baseline inspections spanning reactor pressure vessels, steam generators, and containment welds.[3]Nuclear Regulatory Commission, “License Renewal Applications for Operating Reactors,” nrc.gov Parallel life-extension programs at coal and gas stations demand phased-array ultrasonics for thick-wall boiler tubes and remote crawlers for turbine casing scans. Nuclear-qualified service rates continue to command price premiums of 30-50% due to stringent personnel certification requirements and limited availability of a Level III workforce. The sustained capital program across aging plants secures long-run visibility for specialized US NDT market service revenues.
Robotics-Based Remote NDT Adoption in Confined Assets
Non-entry aerial robots completed a 50-meter stack ultrasonic campaign in 64 minutes, logging 76 data points without scaffolding or confined-space permits, as demonstrated by an Avestec Technologies and Acuren field trial.[4]Avestec Technologies, “Non-Entry Ultrasonic Inspection of Industrial Stacks,” avestec.com Magnetic crawler systems now map corrosion in vertical reformer tubes 60% faster than rope-access crews. Integrated AI pipelines deliver real-time defect classification, reducing the need for human interpretation and enhancing inspection consistency to new heights. The capital intensity of robotics favors national players with scale, spurring consolidation and accelerating the diffusion of technology across the US NDT market.
Restraints Impact Analysis*
| Restraint | (~) % Impact on CAGR Forecast | Geographic Relevance | Impact Timeline |
|---|---|---|---|
| Scarcity of qualified Level-III inspectors | -1.4% | National, acute in rural areas | Long term (≥ 4 years) |
| High capex of digital radiography and CT systems | -1.1% | National, concentrated in smaller providers | Medium term (2-4 years) |
| Data security concerns in cloud-based NDT software | -0.7% | National, heightened in defense sectors | Short term (≤ 2 years) |
| Limited standardization for AI-enabled defect analytics | -0.5% | National, early adopter regions | Medium term (2-4 years) |
| Source: Mordor Intelligence | |||
Scarcity of Qualified Level-III Inspectors
Roughly one-third of today’s certified workforce will retire within the next decade, shrinking the talent pipeline precisely when AI-augmented ultrasonics, digital radiography, and computed tomography skills are most in demand. Achieving Level III status demands a decade-long trajectory of field hours, examinations, and recertifications under the American Society for Nondestructive Testing, making rapid backfill impossible. Hourly rates for nuclear and aerospace Level III professionals have increased by 15-20% annually since 2023, driving up operating costs for mid-tier service firms and limiting growth capacity in underserved rural markets.
High Capex of Digital Radiography and CT Systems
Transitioning from analog film to flat-panel digital detectors costs USD 150,000 to USD 300,000 per unit, while an industrial CT bay often exceeds USD 1 million, including shielding and calibration upgrades. Smaller providers lacking capital reserves or credit lines face multi-year payback periods, discouraging the adoption of new technology despite recognized productivity gains. ASME Section V validation, including normalized signal-to-noise testing and spatial resolution benchmarks, adds engineering overhead and delays return on investment. Capital barriers, therefore, reinforce market concentration in the US NDT market, favoring financially robust players.
*Our forecasts treat driver/restraint impacts as directional, not additive. The impact forecasts reflect baseline growth, mix effects, and variable interactions.
Segment Analysis
By Component: Services Dominance Faces Software Disruption
Services generated the bulk of 2024 revenue, reflecting the labor-intensive nature of field inspections and certified consulting. Their 79.2% share of the US NDT market size is underpinned by regulatory codes that oblige on-site examiner presence. However, asset owners now prioritize integrated service-software bundles that unify inspection scheduling, data storage, and analytics. Software, the smallest slice today, is outpacing all other components at a 12.6% CAGR. Advanced cloud platforms incorporate machine-learning defect libraries, delivering automatic flaw detection that halves interpretation time and strengthens audit traceability. Vendors bundling subscription analytics with mobile data capture are carving out recurring revenue lines that cushion cyclical project work.
Equipment demand remains healthy as ultrasound, phased-array, and full-matrix capture systems upgrade to faster digitizers and ruggedized probes. Consumables continue to grow through magnetic powders and penetrant dyes, although digital migration is slowly eroding sales of film and chemicals. The services-software power shift could reduce services’ share to roughly two-thirds of the US NDT market size by 2030, as asset owners internalize routine data analysis and outsource only high-complexity fieldwork.


By Testing Method: Ultrasonic Leadership Challenged by Eddy-Current Growth
Ultrasonic methods accounted for 27.9% of the US NDT market share in 2024. Their versatility in thick and thin sections, ability to size internal discontinuities, and expanding phased-array toolset keep them at the top of the method hierarchy. Time-of-flight diffraction further enhances the characterization of flaws in pipeline girth welds and pressure vessels. Radiographic testing remains essential for code-mandated weld imaging, albeit slowly being replaced by digital variants. Visual inspection tools remain relevant due to their ease of access and low cost, but drones and AI-enhanced cameras are automating much of the manual component.
Eddy-current testing is projected to grow at a 9.6% CAGR through 2030, driven by non-contact conductivity assessments across aerospace fastener sites and nuclear steam generator tubes. Expanded eddy-current array probes cover larger surfaces more quickly, reducing outages and maintenance windows for power producers and airlines. Magnetic particle and penetrant techniques maintain steady demand for surface crack verification in ferromagnetic assemblies, while thermography and acoustic emission find niche roles in composite health monitoring.
By Technique: AI-Enabled Methods Disrupt Traditional Approaches
Traditional manual ultrasonics, film radiography, and line-of-sight visual checks still captured 88.3% of the US NDT market share in 2024, thanks to entrenched regulatory approvals and established familiarity among engineers. Yet they suffer from variable interpretation quality and longer inspection cycles. AI-enabled workflows, rising at 15.7% CAGR, embed convolutional neural networks inside digital ultrasonic platforms and radiographic image processors. These algorithms flag anomalous patterns in real-time, reduce false positives by up to 40%, and enable partially autonomous report generation.
Larger asset owners are mandating AI-assisted audits as part of their predictive maintenance contracts, thereby accelerating the adoption of AI in this context. Continuous learning architecture means detection models are refined with each inspection, improving performance without physical retooling.

By End-User Industry: Oil and Gas Foundation Supports Automotive Acceleration
Oil and gas retained 25.4% of the US NDT market size in 2024, underwritten by over 3.4 million kilometers of pipelines, deep-water rigs, and liquefaction facilities that require constant integrity checks. Integrated operators continue to invest in guided-wave ultrasonics for unpiggable lines and ROV-based crawlers for subsea weld inspections. Power generation, including 94 relicensed nuclear units, remains the second largest buyer.
The automotive and transportation sector, buoyed by a domestic electric vehicle investment wave exceeding USD 16 billion since 2023, is growing at the fastest rate, with a 9.5% CAGR. Every gigafactory now embeds CT scanners to pre-qualify electrode sheets and spot lithium plating defects before pack assembly. On automotive lines, real-time ultrasonic monitoring of resistance spot welds reduces rework and maintains zero-defect body-in-white targets. Aerospace and defense, construction and infrastructure, and chemical processing collectively sustain a diverse opportunity matrix for service providers across the US NDT market.
Geography Analysis
Regional demand aligns closely with industrial asset density and regulatory oversight. The Gulf Coast, anchored by Texas and Louisiana, commands the largest regional slice due to its petrochemical complexes, offshore platforms, and cross-state pipeline networks. Specialized service hubs in Houston and Baton Rouge field multiskilled crews able to switch between refinery turnarounds and subsea campaigns on short notice.
Midwest states, from Ohio to Illinois, leverage long-standing heavy engineering bases, automotive plants, and fossil-powered utilities. This corridor’s demand profile favors volumetric weld imaging, eddy-current steam-turbine blade checks, and array ultrasonics on structural components. Training centers near Indianapolis and Detroit help alleviate Level III shortages, but rural wind-farm inspections still struggle with crew scarcity, which inflates rates.
California, Washington, and Arizona constitute the Western Innovation Locus, where aerospace composites, hydrogen refueling stations, and solar farms drive the adoption of CT, thermography, and acoustic emission techniques. State legislation often outpaces federal codes, necessitating more frequent audits and higher standards for data integrity. In the Northeast, aging nuclear reactors and urban bridge networks rely heavily on robotic crawlers and AI-enhanced visual drones to tackle limited-access geometries, maintaining robust demand even as heavy industry shifts south and west.
Competitive Landscape
The US NDT market remains moderately fragmented, with no single firm holding a significant national share; however, scale advantages are growing. Baker Hughes Waygate Technologies, Olympus Corporation, and MISTRAS Group sustain broad equipment and service portfolios, national technician rosters, and in-house software labs that shorten deployment times. Their recent strategies focus on subscription-based analytics portals that lock in multi-year data contracts rather than one-off inspections.
Acquisition activity accelerated in 2025 as industry leaders sought robotics skills and regional density. SGS acquired Applied Technical Services for USD 1.325 billion, raising its North American presence to 85 sites and over 2,100 technologists. ShawCor’s USD 260 million purchase of Desert NDT added 18 branches in shale basins, while Institut Dr. Foerster’s purchase of Prüftechnik NDT from Fluke augmented ultrasonic and eddy-current instrumentation lines. Emerging entrants, such as Avestec Technologies, build a competitive edge around non-entry drones and AI-ready data pipelines, selling equipment, SaaS analytics, and targeted services to niche verticals like thin-wall stacks and high-rise façades.
Integrated solution selling is the decisive battleground: customers increasingly demand single-source packages that blend equipment rental, certified operators, live dashboards, and lifecycle analytics. Firms lacking software ecosystems or robotic access solutions risk being relegated to commoditized labor pools, thereby compressing their margins.
United States Non-Destructive Testing Industry Leaders
Baker Hughes
NDT Global LLC
Applied Technical Services
Triumph Group
Mistras Group Inc.
- *Disclaimer: Major Players sorted in no particular order

Recent Industry Developments
- July 2025: SGS acquired Applied Technical Services for USD 1.325 billion to create North America’s largest provider of forensic NDT and infrastructure integrity programs.
- July 2025: ShawCor completed the USD 260 million acquisition of Desert NDT, expanding coverage across major shale basins with 18 additional branches.
- June 2025: Metalogic purchased NDT-PRO Services in Houston, adding a 15,000 sq ft facility and deep-water client contracts.
- April 2025: Institut Dr. Foerster signed a deal to acquire Prüftechnik NDT from Fluke, enhancing eddy-current R&D capacity.


United States Non-Destructive Testing Market Report Scope
Nondestructive testing (NDT) instruments can scan, inspect, and quantify flaws, corrosions, and other material conditions without permanently damaging or altering the examined product or part. NDT equipment encompasses a broad set of equipment, such as flaw detectors, thickness gages, material condition testers, visual inspection devices, acoustic emission testers, and eddy current instruments, along with devices that measure resistivity, conductivity, and corrosion.
The United States NDT Market Report is segmented by component (equipment, software, services, and consumables), testing method (ultrasonic testing, radiographic testing, magnetic particle testing, liquid penetrant testing, visual inspection testing, eddy-current testing, acoustic emission testing, thermography / infrared testing, computed tomography testing), technique (traditional/conventional, and ai-enabled), and end-user industry (oil and gas, power generation, aerospace, defense, automotive and transportation, marine and ship building, electronics and semiconductor, mining, medical devices). The market forecasts are provided in terms of value (USD).
By Component
| Equipment |
| Software |
| Services |
| Consumables |
By Testing Method
| Ultrasonic Testing |
| Radiographic Testing |
| Magnetic Particle Testing |
| Liquid Penetrant Testing |
| Visual Inspection Testing |
| Eddy-Current Testing |
| Acoustic Emission Testing |
| Thermography / Infrared Testing |
| Computed Tomography Testing |
By Technique
| Traditional/Conventional |
| AI-enabled |
By End-user Industry
| Oil and Gas |
| Power Generation |
| Aerospace |
| Defense |
| Automotive and Transportation |
| Manufacturing and Heavy Engineering |
| Construction and Infrastructure |
| Chemical and Petrochemical |
| Marine and Ship Building |
| Electronics and Semiconductor |
| Mining |
| Medical Devices |
| Other End-user Industry |
| By Component | Equipment |
| Software | |
| Services | |
| Consumables | |
| By Testing Method | Ultrasonic Testing |
| Radiographic Testing | |
| Magnetic Particle Testing | |
| Liquid Penetrant Testing | |
| Visual Inspection Testing | |
| Eddy-Current Testing | |
| Acoustic Emission Testing | |
| Thermography / Infrared Testing | |
| Computed Tomography Testing | |
| By Technique | Traditional/Conventional |
| AI-enabled | |
| By End-user Industry | Oil and Gas |
| Power Generation | |
| Aerospace | |
| Defense | |
| Automotive and Transportation | |
| Manufacturing and Heavy Engineering | |
| Construction and Infrastructure | |
| Chemical and Petrochemical | |
| Marine and Ship Building | |
| Electronics and Semiconductor | |
| Mining | |
| Medical Devices | |
| Other End-user Industry |


Key Questions Answered in the Report
What is the forecast value of the US NDT market in 2030?
The market is projected to reach USD 10.60 billion by 2030, expanding at a 7.89% CAGR.
Which component is growing fastest within US NDT?
Software is expected to grow at a 12.6% CAGR through 2030, reflecting the rapid adoption of AI analytics and cloud platforms.
Which testing method currently leads the market?
Ultrasonic testing holds the top position, with a 27.9% share of the 2024 revenue.
Why is automotive demand accelerating?
EV battery safety protocols and real-time weld quality monitoring are driving a 9.5% CAGR in automotive and transportation inspection spending.
How are robotics influencing inspection costs?
Non-entry drones and magnetic crawlers can reduce inspection time by up to 60% and eliminate the need for confined-space permits, thereby reducing overall project costs.
What talent gap challenges industry expansion?
A looming shortage of Level III inspectors, with one-third of the workforce set to retire within the next decade, is driving labor rates higher and constraining capacity.
Page last updated on:


