Pet Treats Market Size and Share
Market Overview
| Study Period | 2021 - 2031 |
|---|---|
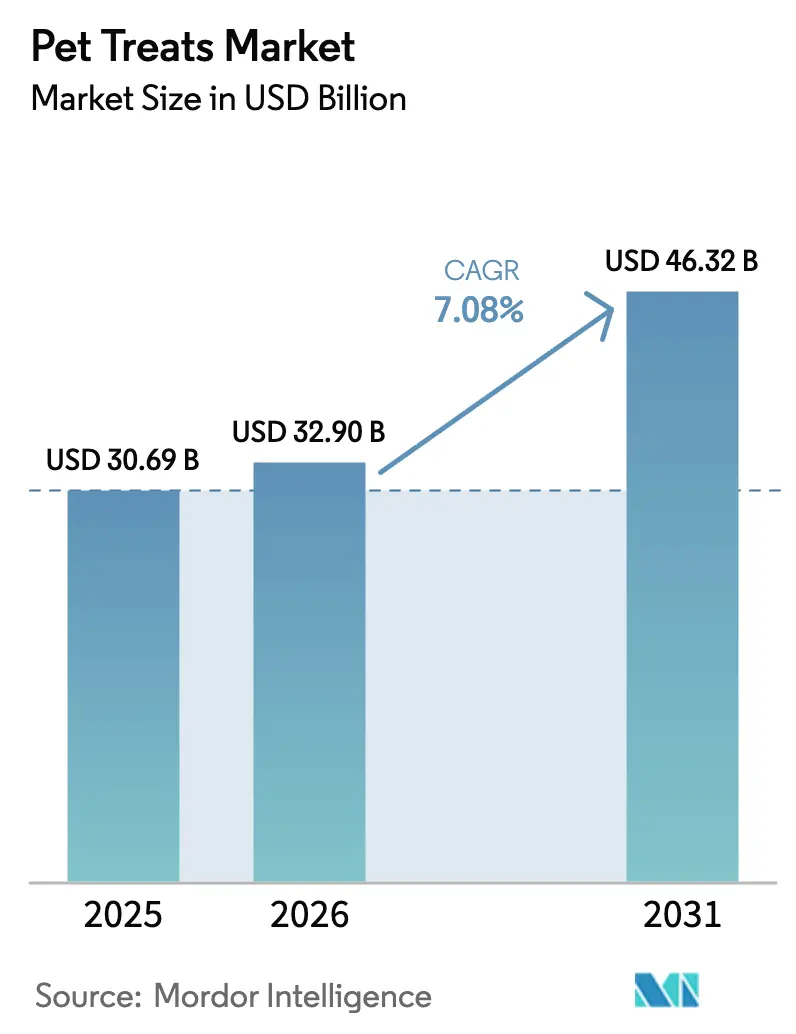
| Market Size (2026) | USD 32.90 Billion |
| Market Size (2031) | USD 46.32 Billion |
| Growth Rate (2026 - 2031) | 7.08% CAGR |
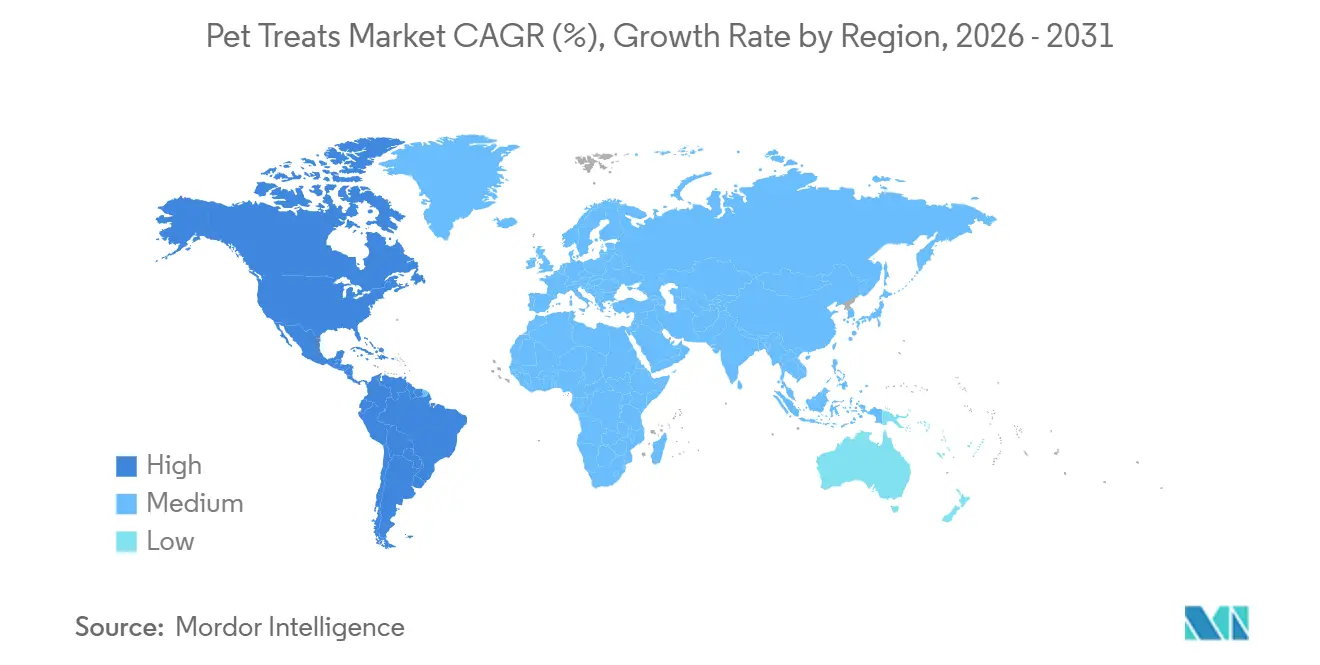
| Fastest Growing Market | North America |
| Largest Market | North America |
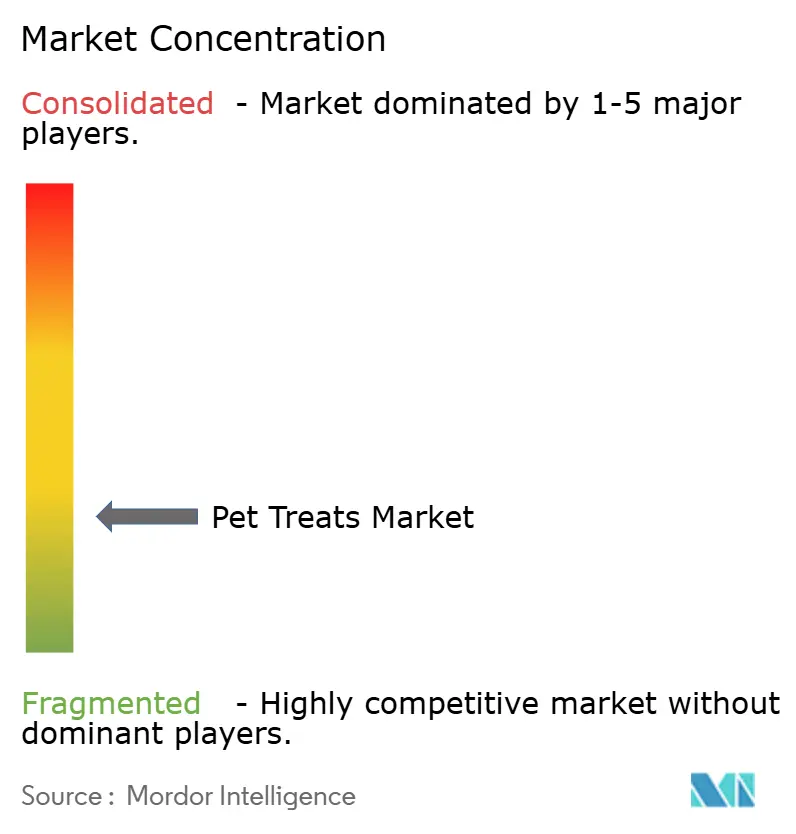
| Market Concentration | Low |
Major Players
*Disclaimer: Major Players sorted in no particular order Image © Mordor Intelligence. Reuse requires attribution under CC BY 4.0. |
|
Pet Treats Market Analysis by Mordor Intelligence
The pet treats market size is projected to expand from USD 30.69 billion in 2025 and USD 32.9 billion in 2026 to USD 46.32 billion by 2031, registering a CAGR of 7.08% between 2026 to 2031. Rising pet ownership, premiumization, and functional nutrition trends are lifting average spending per animal while widening the consumer base. Dental-health claims, clean-label ingredient decks, and sustainability narratives encourage shoppers to trade up, lifting price realization for manufacturers that can document efficacy and traceability. Regulatory clarity in the United States and the European Union quickens product registration, and expanded direct-to-consumer infrastructure cuts go-to-market costs for micro-brands. Supply chain fluctuations in specialty botanicals, including turmeric and blueberry extracts primarily sourced from India and Chile, are contributing to margin compression for functional treat lines, despite strong consumer willingness to pay for these ingredients. At the same time, commodity input inflation forces continuous reformulations that favor vertically integrated players with direct access to rendering or extrusion assets.
Key Report Takeaways
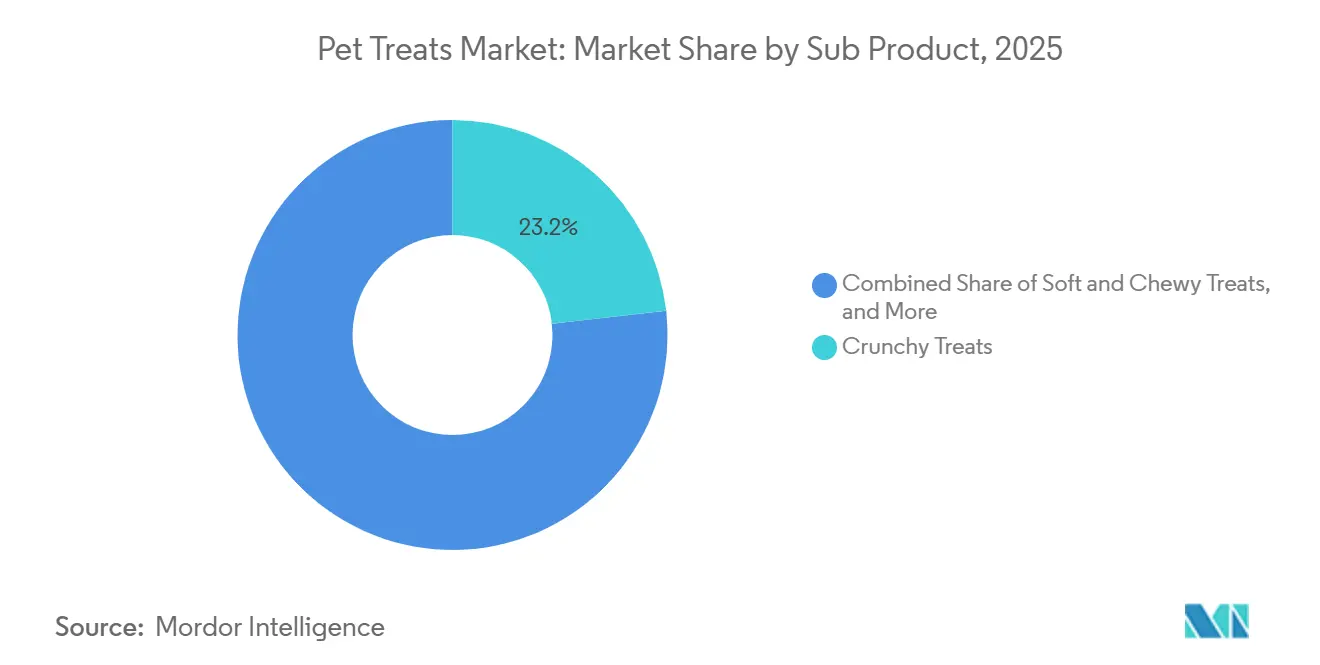
- By sub product, crunchy treats held 23.2% of the pet treats market share in 2025, while freeze-dried and jerky treats are set to expand at an 8.0% CAGR through 2031.
- By pet type, dogs accounted for 53.8% of the pet treats market size in 2025, yet cat spending is projected to rise at a 7.8% CAGR through 2031.
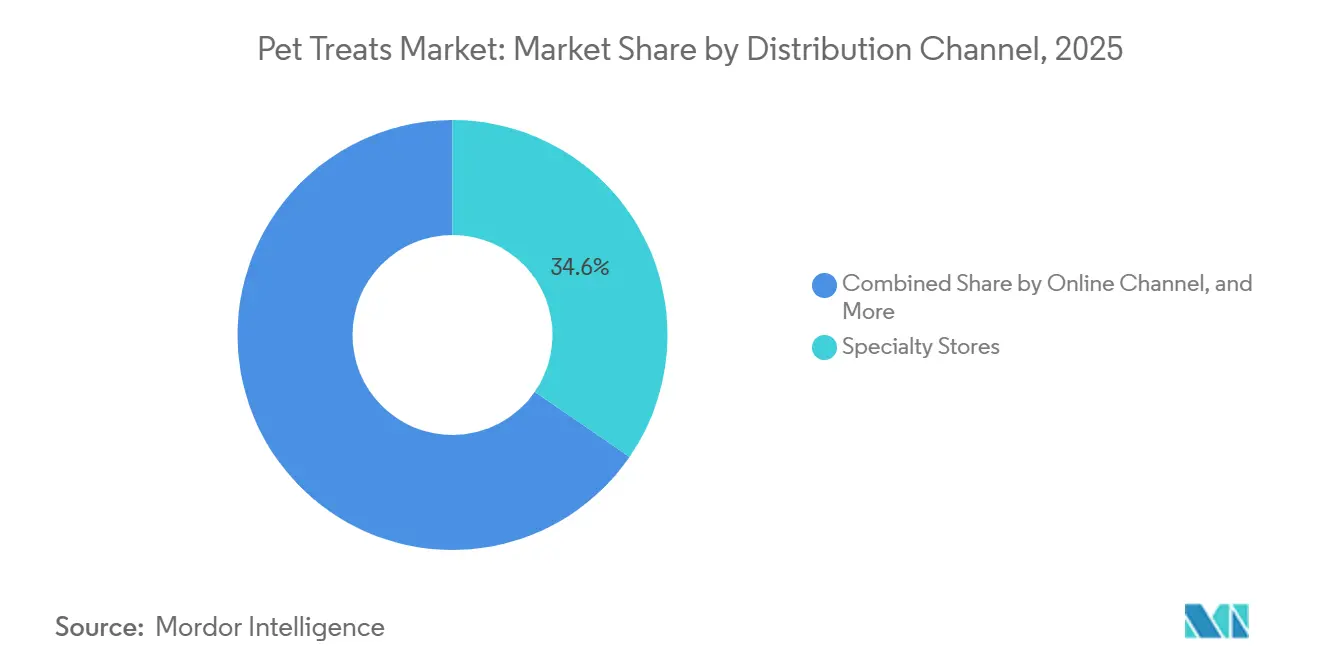
- By distribution channel, specialty stores accounted for 34.6% of revenue in 2025, whereas online channels are projected to grow at an 8.0% CAGR through 2031.
- By geography, North America led with 40.2% revenue share in 2025 and is forecast to post the fastest regional CAGR at 7.6% through 2031.
- Market concentration is low, with the top five players, including Mars, Incorporated, Nestlé Purina PetCare (Nestlé S.A.), Colgate-Palmolive Company (Hill’s Pet Nutrition, Inc.), General Mills, Inc., and The J.M. Smucker Company, together accounting for a smaller market share in 2025.
Note: Market size and forecast figures in this report are generated using Mordor Intelligence’s proprietary estimation framework, updated with the latest available data and insights as of 2026.
Global Pet Treats Market Trends and Insights
Drivers Impact Analysis*
| Driver | (~) % Impact on CAGR Forecast | Geographic Relevance | Impact Timeline |
|---|---|---|---|
| Humanization of pets and premiumization of treats | +1.1% | Global, strongest in North America and Western Europe | Medium term (2-4 years) |
| Accelerated dental-health focus in companion animals | +1.0% | North America and core European Union, expanding in major Asia-Pacific cities | Short term (≤ 2 years) |
| Expansion of direct-to-consumer subscription models | +1.2% | North America leads, followed by the United Kingdom and Australia | Medium term (2-4 years) |
| Retailer private-label expansion in emerging economies | +0.9% | South America, Southeast Asia, and Eastern Europe | Long term (≥ 4 years) |
| Advanced extrusion technologies reducing processing costs | +0.7% | United States, Germany, Thailand, and Brazil | Long term (≥ 4 years) |
| Up-cycling of meat by-products into sustainable treats | +0.8% | European Union and North America, pilots in Australia and New Zealand | Medium term (2-4 years) |
| Source: Mordor Intelligence | |||


Humanization of Pets and Premiumization of Treats
Consumers increasingly treat animals as family, allocating larger discretionary budgets to products that mirror human snacks in transparency, ethics, and functionality. Annual spending on pets in the United States increased from USD 123.6 billion in 2021 to USD 151.9 billion in 2024, surpassing inflation and demonstrating higher price elasticity in the premium segment[1]Source: American Pet Products Association, "Total U.S. Pet Industry Expenditures," americanpetproducts.org. Price premiums are often significantly higher for products certified as organic under the United States Department of Agriculture National Organic Program or verified by the Non-GMO Project. These certifications are increasingly common on new treat stock-keeping units. Furthermore, visually appealing packaging and compelling founder narratives play a crucial role in distinguishing products, allowing newer brands to gain shelf space in specialty stores across the United States, even with constrained media budgets. The pet treats market benefits from this emotionally influenced purchasing behavior, which helps maintain strong sales performance even during times of economic inflation.
Accelerated Dental-Health Focus in Companion Animals
Clinical groups such as the American Veterinary Medical Association (AVMA) and the American Veterinary Dental Society (AVDS) report that 80% of dogs and 70% of cats exhibit signs of periodontal disease by age 3[2]Source: American Veterinary Dental College, "Periodontal Disease in Dogs and Cats," avdc.org. This condition is the most commonly diagnosed medical disorder in small animal practice. Manufacturers have responded with textured or enzyme-coated dental treats, and more products have received Veterinary Oral Health Council acceptance over the years. These certifications support shelf prices that are significantly higher than standard biscuits. Additionally, updates to the European Pet Food Industry Federation guidelines now require plaque-reduction studies, which boost consumer confidence in these products. Retailers have adapted quickly as Petco allocated a notable portion of its treat aisle space to dental products during its remodels, reflecting the growing demand for dental-focused pet treats. Veterinary clinics also stock approved items as post-procedure recommendations, which convert a substantial percentage of trials into repeat purchases. This trend underscores the growing importance of dental health in the pet treats market, further accelerating its growth.
Retailer Private-Label Expansion in Emerging Economies
Supermarkets and specialty chains utilize data scale and in-house formulation to enhance gross profit margins. Tractor Supply Company’s 4health line achieved significant sales in pet food and treats in fiscal year twenty twenty-five, accounting for a notable portion of category revenue and posting margins considerably higher than those of national brands. Brazilian retailer Petz expanded its private-label treat offerings over a two-year period, capturing a substantial share of its treat revenue. In Poland, value-focused consumers drove private-label penetration to a significant level in twenty twenty-five. While scale barriers constrain smaller retailers, the growth of private-label offerings continues to prompt branded companies to invest in co-manufacturing agreements and retailer-exclusive lines, influencing the competitive landscape of the pet treats market.
Advanced Extrusion Technologies Reducing Processing Costs
Second-generation twin-screw extruders reduce energy consumption and allow the incorporation of heat-sensitive micronutrients without degradation. These extruders achieve significantly higher line speeds than legacy equipment and reduce moisture variance, resulting in a notable decrease in overall unit costs. This cost reduction is particularly significant amid raw material inflation, which is pressuring profit margins. Facilities in various countries, including the United States, Germany, Thailand, and Brazil, have adopted these extruders. The resulting savings are being directed toward research on functional coatings and enhanced pricing flexibility, which support the continued growth of the pet treats market despite fluctuations in commodity prices.
Restraints Impact Analysis*
| Restraint | (~) % Impact on CAGR Forecast | Geographic Relevance | Impact Timeline |
|---|---|---|---|
| Price inflation in key animal-protein inputs | –1.3% | Global, acute in North America and Europe | Short term (≤ 2 years) |
| Regulatory scrutiny of novel functional ingredients | –0.6% | European Union and North America with Asia-Pacific spillover | Medium term (2-4 years) |
| Rising competition from homemade treat communities | –0.5% | North America and Western Europe urban areas | Long term (≥ 4 years) |
| Supply-chain volatility in specialty botanicals | –0.4% | Global bottlenecks in India, Chile, and New Zealand | Short term (≤ 2 years) |
| Source: Mordor Intelligence | |||
Regulatory Scrutiny of Novel Functional Ingredients
In 2025, the European Food Safety Authority rejected three probiotic strains due to insufficient evidence of bioavailability in dogs[3]Source: European Food Safety Authority, “Scientific Opinion on Probiotics for Pets,” efsa.europa.eu. In the same year, the United States Food and Drug Administration Center for Veterinary Medicine issued four warning letters regarding joint-support claims. Moreover, the Association of American Feed Control Officials now requires species-specific feeding trials, which have significantly increased the costs associated with pre-market testing for each ingredient. These regulatory dynamics benefit established manufacturers with in-house toxicology and nutrition science expertise, while slowing innovation for smaller brands that depend on contract research organizations. The compliance requirements also impact international markets, as China's Ministry of Agriculture introduced new pet food registration regulations in 2025. These regulations include facility inspections and six-month shelf-life stability testing, potentially delaying market entry by 12 to 18 months for foreign brands aiming to access the rapidly growing pet population in China.
Supply-Chain Volatility in Specialty Botanicals
Turmeric, blueberry extract, and valerian root supplies are predominantly sourced from India, Chile, and New Zealand. Disruptions caused by monsoon seasons and port labor disputes significantly reduced turmeric exports during the specified period, leading to higher spot prices. Prolonged lead times have forced manufacturers to maintain inventory for several months, tying up financial resources and increasing the risk of potency degradation. This situation has created challenges for maintaining profitability in functional product lines, limiting the growth potential in the premium segment of the broader pet treats market until measures such as diversified sourcing or agricultural expansions are implemented to stabilize supply chains.
*Our forecasts treat driver/restraint impacts as directional, not additive. The impact forecasts reflect baseline growth, mix effects, and variable interactions.
Segment Analysis
By Sub Product: Freeze-dried and Jerky Treats Formats Gain from Clean-Label Demand
Crunchy treats are the largest subproduct and accounting for 23.2% of the pet treats market share in 2025, benefiting from economical extrusion and shelf stability beyond 18 months. Crunchy treats lead the market due to their strong multisensory appeal, combining distinct auditory feedback with a satisfying texture that conveys freshness and safety. They offer higher palatability and engagement through the sensory experience of "eating with ears" and provide dental benefits, such as tartar reduction, making them a preferred choice for pet consumers.
In contrast, the freeze-dried and jerky lines are projected to grow at an 8.0% CAGR through 2031, making them the fastest-expanding segment of the pet treats market for sub-products. Freeze-dried technology preserves raw protein nutrition and enables one-ingredient labels that appeal to a majority of United States shoppers who read ingredient lists before buying. Dental treats are facing increasing commoditization pressure as private-label products replicate the textures and formulations approved by the Veterinary Oral Health Council. Retailer-owned brands are gaining a significant share in the dental treat segment within European specialty chains. This trend is diminishing the pricing power of branded products, encouraging established companies to differentiate themselves through initiatives such as veterinary partnership programs and digital education efforts. These strategies aim to build brand equity that extends beyond products' functional attributes.


By Pets: Dogs Dominate, but Cats Deliver the Faster Climb
Dogs are the largest pet type and accounted for 53.8% of the pet treats market size in 2025, underpinned by larger populations and higher per-capita training usage. The segment is projected to post steady gains, anchored by joint-support and calming formulations. Dogs are the primary consumers of pet treats due to their strong food motivation, significant training needs, and owners' use of treat-based bonding rituals to express affection. Treats play an important role in positive reinforcement during training, fulfilling natural chewing instincts and offering mental stimulation, as most dogs are highly food-motivated.
Cat treats, though smaller, will record a 7.8% CAGR through 2031, emerging as the fastest-moving slice of the pet treats market size by species. Updated Association of American Feed Control Officials nutrient profiles clarify taurine minimums, sparking product launches that rose year on year in 2025. Functional feline items focused on hairball control and urinary wellness, driving cat treat sales, prompting major suppliers to deepen research into obligate carnivore palatability. The other pets category, which includes small mammals, birds, and reptiles, accounted for a small portion of the treat market value and is projected to grow steadily over the forecast period. This growth is limited by the relatively smaller populations of these pets and lower spending per pet. However, it is supported by the expansion of specialty retailers and the increasing accessibility of e-commerce platforms, which improve product availability for niche species.
By Distribution Channel: Online Channel Upshifts, Specialty Stores Defend
The specialty stores are the largest distribution channel, accounting for 34.6% of the pet treats market share in 2025, supported by knowledgeable staff, grooming services, and veterinary clinics that lift cross-category basket sizes. Specialty stores are strengthening their position through investments in experiential retail. For instance, Petco's store remodel program, in 2023, includes expanding average selling space to accommodate premium treats and self-service treat bars. This approach allows customers to purchase treats by weight and has been reported to generate significantly higher gross margins than pre-packaged alternatives, as highlighted in the retailer's investor presentations.
Online channels will grow at an 8.0% CAGR through 2031 and are projected to reshape inventory economics for the pet treats market share across retailers. Electronic commerce penetration increased in the United States, with Amazon and Chewy accounting for nearly three-quarters of that value. Subscription models embedded in those platforms lock in recurring orders, while algorithmic merchandising surfaces niche labels without national advertising. Physical specialty outlets respond with experiential upgrades, including self-serve treat bars with superior gross margins to packaged equivalents. Supermarkets and hypermarkets place pet treats near human snacks to drive impulse purchases, though shelf-space rationalization concentrates velocity among the top 15 stock-keeping units. Convenience outlets and rural feed stores, serving immediate-need or remote geographies and preserving an omnichannel spread in the pet treats market.
Geography Analysis
North America is the largest geography, accounting for 40.2% of the pet treats market share in 2025 and set to grow at a 7.6% CAGR through 2031. The United States accounted for the majority of regional sales, driven by high household pet ownership and substantial annual per-dog spending on treats. Canadian regulatory harmonization under the Canadian Food Inspection Agency reduced time-to-market for new formulas, enabling faster rollouts. Mexico is experiencing significant annual growth from a modest base, driven by the adoption of products among the urban middle class. However, average spending remains considerably lower than in the United States. Rising protein costs have led manufacturers to increase list prices, putting price elasticity to the test.
Europe accounted for a significant share of the global market value and is projected to experience steady growth over the coming years. Germany, the United Kingdom, and France collectively dominate the region's market, contributing significantly to its overall performance. The European Food Safety Authority's decision to reject new probiotic strains in 2025 delayed the introduction of functional products, as the market for dental and joint-health treats has remained strong and continues to perform well. Private-label products have gained a notable share in specialty chains, with retailers such as Fressnapf benefiting from vertical sourcing strategies. Eastern Europe has shown stronger growth than Western Europe, with countries like Poland and the Czech Republic making significant progress as modern retail channels have expanded distribution opportunities for international vendors.
The Asia-Pacific region remains the strongest among major markets. China accounts for nearly half of the regional sales, driven by the population of registered dogs and cats. New registration rules from the Ministry of Agriculture in 2023 require facility audits and six months of stability data, increasing the lead time for foreign brands by approximately one year. In Japan, the aging pet population is driving demand for senior-health treats. Meanwhile, in India, the pet treat market is growing as Tier 1 cities increasingly adopt Western pet care practices. Southeast Asia, led by Thailand and Indonesia, is experiencing growth driven by millennial pet ownership and the expansion of specialty retail networks, fueling rapid growth in the regional pet treats market.

Competitive Landscape
Market concentration is low, with the top five players, including Mars, Incorporated, Nestlé Purina PetCare (Nestlé S.A.), Colgate-Palmolive Company (Hill’s Pet Nutrition, Inc.), General Mills, Inc., and The J.M. Smucker Company, together accounting for a smaller market share in 2025. Mars, Incorporated and Nestlé Purina PetCare deploy vertically integrated rendering, extrusion, and digital platforms that insulate them from raw-material swings and enable rapid marketing. Manufacturers are increasingly focusing on functional differentiation as part of their competitive strategies. This includes obtaining Veterinary Oral Health Council (VOHC) dental acceptance seals, Association of American Feed Control Officials (AAFCO) nutritional adequacy statements, and third-party certifications such as United States Department of Agriculture (USDA) Organic and Non-Genetically Modified Organism (Non-GMO) Project verification to support premium pricing and enhance brand equity beyond basic treat attributes. Opportunities for innovation are emerging in the use of upcycled ingredients, with startups transforming brewery spent grains, surplus produce, and seafood bycatch into treats. These products often command premium prices while aligning with Benefit Corporation (B-Corp) sustainability standards.
Technology deployment is transforming competitive dynamics as manufacturers implement near-infrared spectroscopy to verify ingredient quality in real time. This reduces batch rejection rates, enhances gross margins, and ensures consistent product quality. Additionally, blockchain traceability systems, introduced by Nestlé Purina PetCare in 2025 for its Beyond line of treats, allow consumers to scan QR codes to access farm-level sourcing data. These systems address transparency requirements, build consumer trust, and provide first-party consumer data to guide product development strategies and improve supply chain efficiency.
Private equity investors are increasingly targeting regional treat manufacturers with enterprise values of 8x to 12x trailing EBITDA. This trend is creating exit opportunities for founders while offering incumbents bolt-on acquisition targets that enable geographic expansion or provide specialized format expertise. The competitive landscape is projected to split into two segments: large-scale players focused on cost efficiency and vertical integration, and premium specialists that maintain pricing power through functional innovation and brand positioning. Meanwhile, middle-market players may face margin compression and market share losses unless they implement clear differentiation strategies.
Pet Treats Industry Leaders
-
Mars, Incorporated
-
Colgate-Palmolive Company (Hill's Pet Nutrition, Inc.)
-
Nestlé Purina PetCare (Nestlé S.A.)
-
General Mills, Inc.
-
The J.M. Smucker Company
- *Disclaimer: Major Players sorted in no particular order

Recent Industry Developments
- February 2026: Pure Treats Inc., the Canadian parent company of PureBites, acquired Primal Pet Foods from the private equity firm Kinderhook Industries. The acquisition aims to "return Primal to its roots," emphasizing independent neighborhood pet retail partnerships and high-quality raw nutrition.
- December 2025: Bark Bistro has introduced its Buddy Budder line of natural peanut butter dog treats in 464 Sprouts Farmers Market locations across the United States. This expansion represents a significant milestone for the company, which has grown from a startup to a brand with over 15,000 retail partners. The products, including Squeeze Packs, are made with human-grade, dog-safe ingredients.
- December 2025: The Nutriment Company (TNC) has acquired Antos, a Netherlands-based developer and distributor of pet treats. This acquisition enhances TNC's presence in the European pet treats market and grants access to Antos' extensive distribution network in the Benelux region, leveraging its logistics facility in the Netherlands as a central hub.
- November 2025: Petbeing, a United States-based company, has introduced a new 9-SKU value-focused dog treat line for private-label partners to address supply gaps in the market. The product line includes popular formats such as Beef Bites, Jerky Sticks, and Dental Chews, offered in 40-oz jars, with smaller pouches currently under development.


Global Pet Treats Market Report Scope
Pet treats are commercial food products formulated specifically for pets. They are not designed to provide complete and balanced nutrition but are intended for occasional feeding as rewards, during training, or for enjoyment. As a subset of pet food, these treats are typically made from ingredients such as meat, grains, or vegetables and should be offered in moderation to maintain a balanced diet. The Pet Treats Market Report is Segmented by Sub Product (Crunchy Treats, Dental Treats, Freeze-Dried and Jerky Treats, Soft and Chewy Treats, and Other Treats), by Pets (Cats, Dogs, and Other Pets), by Distribution Channel (Convenience Stores, Online Channel, Specialty Stores, Supermarkets/Hypermarkets, and Other Channels), and by Geography (Africa, Asia-Pacific, Europe, North America, South America, and Middle East). The Market Forecasts are Provided in Terms of Value (USD) and Volume (Metric Tons).
| Crunchy Treats |
| Dental Treats |
| Freeze-dried and Jerky Treats |
| Soft and Chewy Treats |
| Other Treats |
| Cats |
| Dogs |
| Other Pets |
| Convenience Stores |
| Online Channel |
| Specialty Stores |
| Supermarkets/Hypermarkets |
| Other Channels |
| North America | Canada |
| Mexico | |
| United States | |
| Rest of North America | |
| Europe | France |
| Germany | |
| Italy | |
| Netherlands | |
| Poland | |
| Russia | |
| Spain | |
| United Kingdom | |
| Rest of Europe | |
| Asia-Pacific | Australia |
| China | |
| India | |
| Indonesia | |
| Japan | |
| Malaysia | |
| Philippines | |
| Taiwan | |
| Thailand | |
| Vietnam | |
| Rest of Asia-Pacific | |
| South America | Argentina |
| Brazil | |
| Rest of South America | |
| Middle East | Saudi Arabia |
| United Arab Emirates | |
| Turkey | |
| Rest of Saudi Arabia | |
| Africa | South Africa |
| Rest of Africa |
| By Sub Product | Crunchy Treats | |
| Dental Treats | ||
| Freeze-dried and Jerky Treats | ||
| Soft and Chewy Treats | ||
| Other Treats | ||
| By Pets | Cats | |
| Dogs | ||
| Other Pets | ||
| By Distribution Channel | Convenience Stores | |
| Online Channel | ||
| Specialty Stores | ||
| Supermarkets/Hypermarkets | ||
| Other Channels | ||
| By Geography | North America | Canada |
| Mexico | ||
| United States | ||
| Rest of North America | ||
| Europe | France | |
| Germany | ||
| Italy | ||
| Netherlands | ||
| Poland | ||
| Russia | ||
| Spain | ||
| United Kingdom | ||
| Rest of Europe | ||
| Asia-Pacific | Australia | |
| China | ||
| India | ||
| Indonesia | ||
| Japan | ||
| Malaysia | ||
| Philippines | ||
| Taiwan | ||
| Thailand | ||
| Vietnam | ||
| Rest of Asia-Pacific | ||
| South America | Argentina | |
| Brazil | ||
| Rest of South America | ||
| Middle East | Saudi Arabia | |
| United Arab Emirates | ||
| Turkey | ||
| Rest of Saudi Arabia | ||
| Africa | South Africa | |
| Rest of Africa | ||


Market Definition
- FUNCTIONS - Pet foods are usually intended to provide complete and balanced nutrition to the pet but are primarily used as functional products. The scope includes the food and supplements consumed by pets including veterinary diets. Supplements/nutraceuticals that are directly supplied to pets are considered within the scope.
- RESELLERS - Companies engaged in reselling of pet food without value addition have been excluded from the market scope, in order to avoid double counting.
- END CONSUMERS - Pet owners are considered to be the end-consumers in the market studied.
- DISTRIBUTION CHANNELS - Supermarkets/hypermarkets, specialty stores, convenience stores, online channels and other channels are considered within the scope. The stores which are exclusively providing pet related basic and custom products are considered within the scope of specialty stores.
| Keyword | Definition |
|---|---|
| Pet Food | The scope of pet food includes the food that is eatable by pets including food, treats, veterinary diets, and nutraceuticals/supplements. |
| Food | Food is animal feed intended for consumption by pets. It is formulated to provide essential nutrients and meet the dietary needs of various types of pets, including dogs, cats, and other animals. These are generally segmented into dry and wet pet foods. |
| Dry Pet Food | Dry pet foods may be extruded/baked (kibbles) or flaked. They have a lower moisture content, typically around 12-20%. |
| Wet Pet Food | Wet pet food, also known as canned pet food or moist pet food, generally has a higher moisture content compared to dry pet food, often ranging from 70-80%. |
| Kibbles | Kibbles are dry, processed pet food in small, bite-sized pieces or pellets. They are specifically formulated to provide balanced nutrition for various domestic animals, such as dogs, cats, and other animals. |
| Treats | Pet Treats are special food items or rewards given to pets, to show affection, and encourage good behavior. They are especially used during training. Pet treats are made from various combinations of meat or meat-derived materials with other ingredients. |
| Dental Treats | Pet dental treats are specialized treats that are formulated to promote good oral hygiene in pets. |
| Crunchy Treats | It is a type of pet treat that has a firm and crispy texture which can be a good source of nutrition for pets. |
| Soft and chewy treats | Soft and Chewy pet treats are a type of pet food product that is formulated to be easy to chewy and digest. They are usually made from soft and pliable ingredients, such as meat, poultry, or vegetables, that have been blended and formed into bite-sized pieces or strips. |
| Freeze-dried & Jerky Treats | Freeze-dried and jerky treats are snacks given to pets, that are prepared through a special preservation process, without damaging the nutritional content, resulting in long-lasting, nutrient-rich treats. |
| Urinary Tract Disease Diets | These are commercial diets that are specifically formulated to promote urinary health and reduce the risk of urinary tract infections and other urinary problems. |
| Renal Diets | These are specialized pet foods formulated to support the health of pets with kidney disease or renal insufficiency. |
| Digestive Sensitivity Diets | Digestive-sensitive diets are specially formulated to meet the nutritional needs of pets with digestive issues such as food intolerances, allergies, and sensitivities. These diets are designed to be easily digestible and to reduce the symptoms of digestive problems in pets. |
| Oral Care Diets | Oral care diets for pets are specially formulated diets produced to promote oral health and hygiene in pets. |
| Grain-Free Pet Food | Pet food that does not contain common grains like wheat, corn, or soy. Grain-free diets are often preferred by pet owners seeking alternative options or if their pets have specific dietary sensitivities. |
| Premium Pet Food | High-quality pet food formulated with superior ingredients often offers additional nutritional benefits compared to standard pet food. |
| Natural Pet Food | Pet food made from natural ingredients, with minimal processing and without artificial preservatives. |
| Organic Pet Food | Pet food is produced using organic ingredients, free from synthetic pesticides, hormones, and genetically modified organisms (GMOs). |
| Extrusion | A manufacturing process used to produce dry pet food, where ingredients are cooked, mixed, and shaped under high pressure and temperature. |
| Other Pets | Other pets include birds, fish, rabbits, hamsters, ferrets, and reptiles. |
| Palatability | The taste, texture, and aroma of pet food influence its appeal and acceptance by pets. |
| Complete and Balanced Pet Food | Pet food that provides all essential nutrients in appropriate proportions to meet the nutritional needs of pets without additional supplementation. |
| Preservatives | These are the substances that are added to pet food to extend its shelf life and prevent spoilage. |
| Nutraceuticals | Food products that offer health benefits beyond basic nutrition, often contain bioactive compounds with potential therapeutic effects. |
| Probiotics | Live beneficial bacteria that promote a healthy balance of gut flora, supporting digestive health and immune function in pets. |
| Antioxidants | Compounds that help neutralize harmful free radicals in the body, promoting cellular health and supporting the immune system in pets. |
| Shelf-Life | The duration of which pet food remains safe and nutritionally viable for consumption after its production date. |
| Prescription diet | Specialized pet food formulated to address specific medical conditions under veterinary supervision. |
| Allergen | A substance that can cause allergic reactions in some pets, leading to food allergies or sensitivities. |
| Canned food | Wet pet food that is packed in cans and contains higher moisture content than dry food. |
| Limited ingredient diet (LID) | Pet food formulated with a reduced number of ingredients to minimize potential allergens. |
| Guaranteed Analysis | The minimum or maximum levels of certain nutrients present in pet food. |
| Weight management | Pet food designed to help pets maintain a healthy weight or support weight loss efforts. |
| Other Nutraceuticals | It includes prebiotics, antioxidants, digestive fiber, enzymes, essential oils and herbs. |
| Other Veterinary Diets | It includes weight management diets, skin and coat health, cardiac care, and joint care. |
| Other Treats | It includes rawhides, mineral blocks, lickables, and catnips. |
| Other Dry Foods | It includes cereal flakes, mixers, meal toppers, freeze-dried foods, and air-dried foods. |
| Other Animals | It includes birds, fish, reptiles, and small animals (rabbits, ferrets, hamsters). |
| Other Distribution Channels | It includes veterinary clinics, local unregulated stores, and feed and farm stores. |
| Proteins and Peptides | Proteins are large molecules composed of basic units called amino acids which help in the growth and development of pets. Peptides are the short string of 2 to 50 amino acids. |
| Omega-3 fatty acids | Omega-3 fatty acids are essential polyunsaturated fats that play a crucial role in the overall health and well-being of Pets |
| Vitamins | Vitamins are the essential organic compounds that are essential for vital physiological functioning. |
| Minerals | Minerals are naturally occurring inorganic substances that are essential for various physiological functions in pets. |
| CKD | Chronic Kidney Disease |
| DHA | Docosahexaenoic Acid |
| EPA | Eicosapentaenoic Acid |
| ALA | Alpha-linolenic Acid |
| BHA | Butylated Hydroxyanisol |
| BHT | Butylated Hydroxytoluene |
| FLUTD | Feline Lower Urinary Tract Disease |


Research Methodology
Mordor Intelligence follows a four-step methodology in all our reports.
- Step-1: IDENTIFY KEY VARIABLES: In order to build a robust forecasting methodology, the variables and factors identified in Step-1 are tested against available historical market numbers. Through an iterative process, the variables required for market forecast are set and the model is built on the basis of these variables.
- Step-2: Build a Market Model: Market-size estimations for the forecast years are in nominal terms. Inflation is not a part of the pricing, and the average selling price (ASP) is kept constant throughout the forecast period.
- Step-3: Validate and Finalize: In this important step, all market numbers, variables and analyst calls are validated through an extensive network of primary research experts from the market studied. The respondents are selected across levels and functions to generate a holistic picture of the market studied.
- Step-4: Research Outputs: Syndicated Reports, Custom Consulting Assignments, Databases & Subscription Platforms


