Market Overview
| Study Period | 2018 - 2031 |
|---|---|
| Forecast Data Period | 2026 - 2031 |
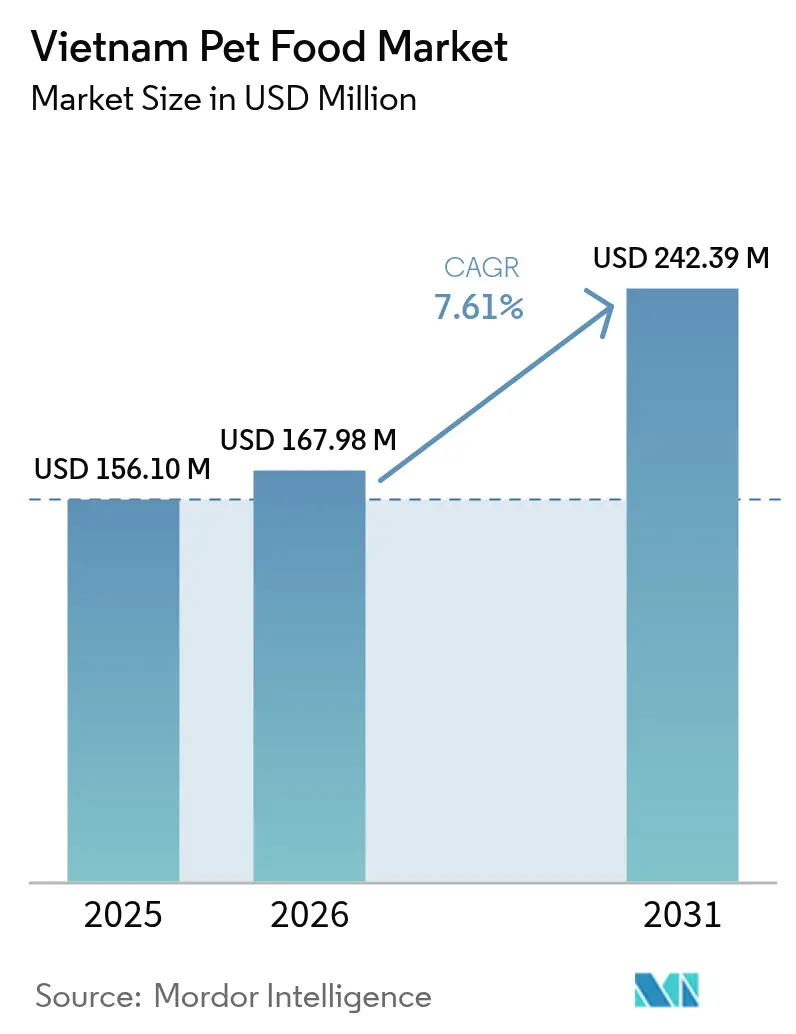
| Base Year Market Size (2025) | USD 156.1 Million |
| Market Size (2026) | USD 167.98 Million |
| Market Size (2031) | USD 242.39 Million |
| Growth Rate (2026 - 2031) | 7.61% CAGR |
| Market Concentration | Medium |
Major Players
*Disclaimer: Major Players sorted in no particular order Image © Mordor Intelligence. Reuse requires attribution under CC BY 4.0. |
|
Vietnam Pet Food Market Analysis by Mordor Intelligence
The Vietnam pet food market size in 2026 is estimated at USD 167.98 million, growing from 2025 value of USD 156.1 million with 2031 projections showing USD 242.39 million, growing at 7.61% CAGR over 2026-2031. Robust urban income growth, widening pet ownership, and the appeal of functional nutrition anchor this expansion. Rising numbers of single-person households, social media–driven brand awareness, and a supportive e-commerce ecosystem are accelerating premium product uptake. Input-cost headwinds, evolving regulatory oversight, and pricing gaps between urban and rural buyers create near-term friction, yet integrated manufacturers with omnichannel reach continue to capture outsized gains. The Vietnam pet food market also benefits from government incentives encouraging local meat by-product use, helping domestic players manage volatility in imported proteins.
Key Report Takeaways
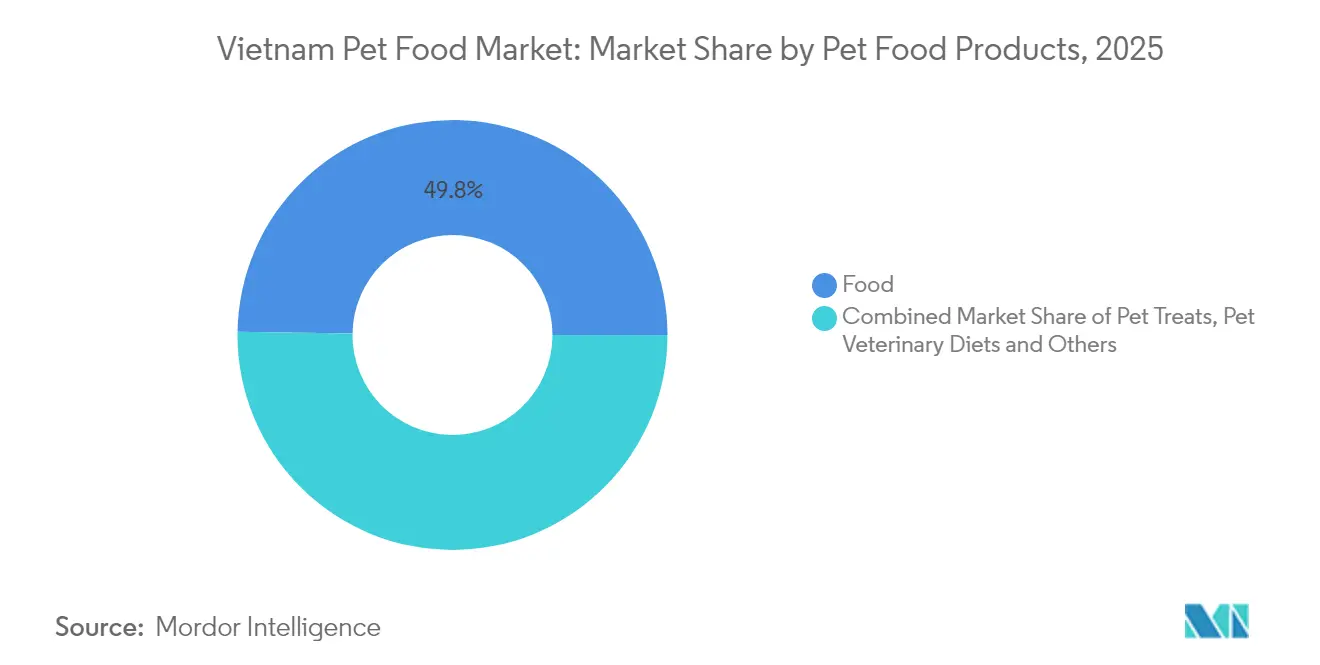
- By Product Category, traditional food held 49.76% of the Vietnam pet food market share in 2025, while nutraceuticals and supplements are projected to grow at an 11.62% CAGR through 2031.
- By Pet Type, dogs accounted for 61.12% of the Vietnam pet food market size in 2025, and cats are forecast to expand at an 8.27% CAGR to 2031.
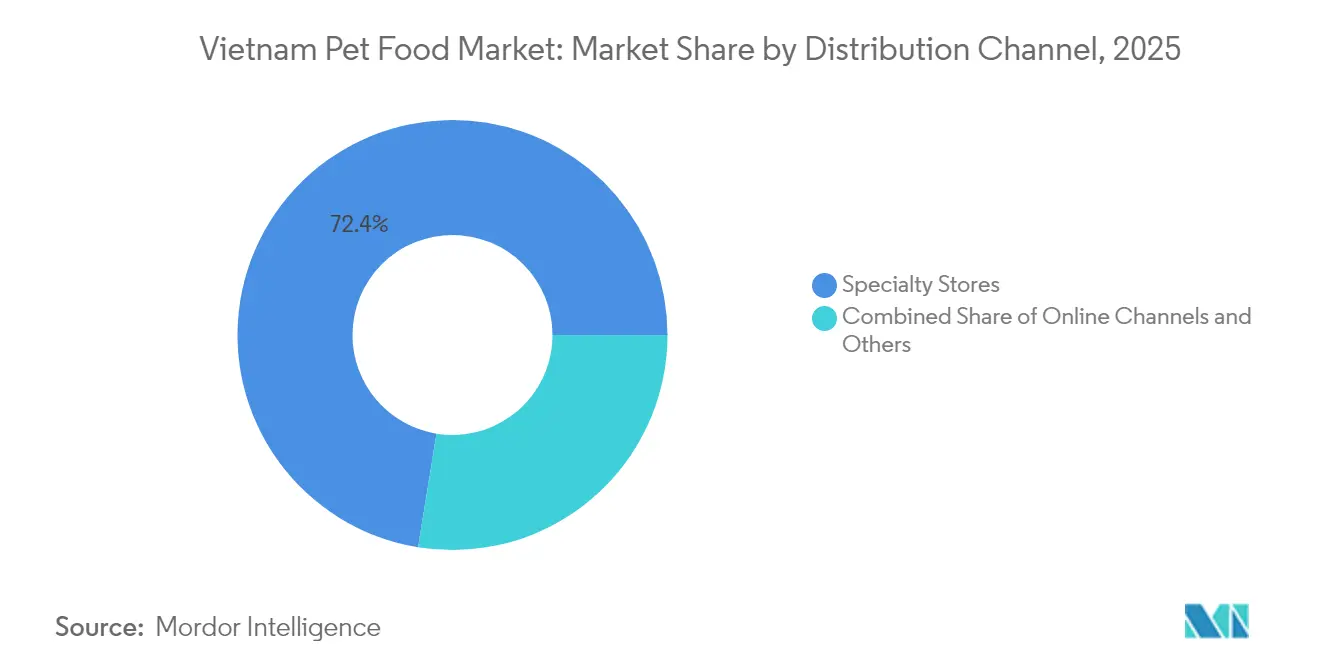
- By Distribution Channel, specialty stores led with a 72.44% revenue share in 2025, and the online channel is advancing at a 9.33% CAGR through 2031.
Note: Market size and forecast figures in this report are generated using Mordor Intelligence’s proprietary estimation framework, updated with the latest available data and insights as of 2026.
Vietnam Pet Food Market Trends and Insights
Drivers Impact Analysis*
| Driver | (~) % Impact on CAGR Forecast | Geographic Relevance | Impact Timeline |
|---|---|---|---|
| Rising disposable incomes of pet owners | +1.80% | Ho Chi Minh City and Hanoi | Medium term (2-4 years) |
| Humanization of pets boosting functional diets | +2.10% | National, strongest in Tier-1 cities | Long term (≥ 4 years) |
| Expansion of specialty retail chains | +1.20% | Major urban centers expanding to provinces | Medium term (2-4 years) |
| Growth of e-commerce and last-mile delivery | +1.50% | Nationwide, rapid in cities | Short term (≤ 2 years) |
| Government incentives for meat by-product use | +0.90% | Manufacturing hubs in Binh Duong and Dong Nai | Long term (≥ 4 years) |
| Expatriate demand for imported grain-free diets | +0.40% | Ho Chi Minh City, Hanoi, and Da Nang | Medium term (2-4 years) |
| Source: Mordor Intelligence | |||


Rising Disposable Incomes of Pet Owners
In 2024, Vietnam's average monthly income per capita reached USD 213, reflecting a 9.1% increase compared to 2023. This growth rate surpassed the 6.2% increase observed between 2022 and 2023[1]General Statistics Office of Vietnam, "Press Release: Results of the 2024 Living Standards Survey", Hanoi: General Statistics Office of Vietnam, 2024, NSO.GOV.VN. Vietnamese pet owners allocate larger shares of discretionary budgets to pets, pushing premium segment penetration from 15% in 2022 to 23% in 2024. Imported functional diets can command 40–60% price premiums, yet remain accessible as income elasticity shows every 10% rise in disposable income lifts premium spending by 15%. Ho Chi Minh City and Hanoi buyers spend 3.2 times more per pet than rural counterparts, encouraging brand owners to layer portfolios with mid-tier and super-premium lines to capture broadening demand.
Humanization of Pets Boosting Functional Diets
Pets increasingly occupy family-member status, and owners seek products with probiotics, omega-3s, and organic components mirroring human food wellness trends[2]Vietnam Food Association, “Food Industry Trends Report 2024,” VIETNAMFOOD.ORG.VN. Nutraceutical products surged in 2024, as veterinary clinics logged more nutrition consultations. Influencers on Facebook and TikTok promote premium formulas to a combined 2.3 million followers, amplifying awareness. Positioning diets as long-term health investments rather than commodities supports margin expansion, particularly among millennials and Gen Z households. This shift is deepening category sophistication, with consumers prioritizing ingredient transparency, ethical sourcing, and functional claims such as immunity and gut health. As a result, brands that integrate science-backed nutrition with emotional marketing are capturing loyalty faster, reinforcing the premiumization wave driving growth in the Vietnam pet food market.
Expansion of Specialty Retail Chains
Retailers such as AEON Pet and Petmart Vietnam expanded their network in 2024, marking a 28% increase in store coverage[3]AEON Vietnam, “Store Expansion Report 2024,” AEON.COM.VN. These outlets stock three to four times more SKUs than supermarkets, host trained staff, and routinely run in-store education events. Premium launches gain traction quickly, and trial rates in specialty outlets sit 65% higher than mass retail. Chains now target secondary cities where competition remains limited, reinforcing the Vietnam pet food market’s multi-tier retail structure. Growing pet ownership in urban households and rising demand for functional and imported diets further strengthen specialty retail momentum. Additionally, retailers are increasingly integrating omnichannel strategies, combining physical outlets with online platforms to capture repeat purchases and expand reach.
Government Incentives for Meat By-Product Use
Circular 04/2024 provides tax relief to firms using locally sourced by-products, trimming production costs 8–12%[4]Vietnam Ministry of Agriculture and Rural Development, “Circular 01/2024 and 04/2024 Implementation Guidelines,” MARD.GOV.VN. Vietnam’s significant livestock sector ensures steady supply, while mandated safety testing maintains quality. Domestic processors with integrated supply chains benefit most, gaining cost resilience against imported protein swings and enhancing competitiveness in the Vietnam pet food market. The policy promotes sustainable sourcing and waste reduction, aligning with Vietnam's circular economy objectives. Consequently, local manufacturers are investing in rendering and feed-grade protein recovery facilities to enhance domestic ingredient ecosystems and decrease reliance on imports.
Restraints Impact Analysis*
| Restraint | (~) % Impact on CAGR Forecast | Geographic Relevance | Impact Timeline |
|---|---|---|---|
| Price sensitivity in rural provinces | -1.40% | Mekong Delta and northern rural areas | Long term (≥ 4 years) |
| Volatile supply of premium protein inputs | -1.10% | Import-dependent manufacturers nationwide | Short term (≤ 2 years) |
| Plastic-waste regulations driving costs | -0.80% | National, greatest on single-serve packs | Medium term (2-4 years) |
| Saturation of dog-food segment in Tier-1 cities | -0.60% | Ho Chi Minh City and Hanoi | Medium term (2-4 years) |
| Source: Mordor Intelligence | |||
Price Sensitivity in Rural Provinces
Average rural income is 40% of city levels, so basic nutrition products dominate outside Tier-1 zones. High logistics costs in remote districts raise shelf prices by 15–20%, deterring premium adoption. Rural consumers spend significantly less on pet food compared to urban households, keeping the Vietnam pet food market’s value heavily weighted toward cities. International brands relying on imports face the steepest hurdles due to weak rural purchasing power and fragmented distribution networks. Limited retailer reach and low awareness of nutritional differentiation further constrain premium category expansion beyond urban centers.
Plastic-Waste Regulations Driving Costs
Extended Producer Responsibility (EPR) rules require recycling fees based on packaging volume, lifting costs by 3–5%. Biodegradable films cost up to 60% more than conventional plastics, challenging profitability on single-serve sachets popular among urban buyers. Smaller importers without sustainability programs could exit, consolidating share among larger players. In addition, limited domestic recycling infrastructure and inconsistent waste collection systems increase compliance burdens for local manufacturers. As sustainability standards tighten, companies are being pushed to redesign packaging and invest in eco-label certifications, raising upfront costs and slowing product innovation cycles within the Vietnam pet food market.
*Our forecasts treat driver/restraint impacts as directional, not additive. The impact forecasts reflect baseline growth, mix effects, and variable interactions.
Segment Analysis
By Pet Food Product: Functional Nutrition Realigns Demand
Traditional food secured 49.76% of sales in 2025, followed by treats, veterinary diets, and fast-climbing nutraceuticals. Nutraceuticals and supplements captured the smallest absolute slice but posted the strongest double-digit rise, signaling a decisive move toward scientifically positioned products. Dry formulas remain the day-to-day staple, thanks to affordable pricing and long shelf life, while wet offerings cater to palatability and portion control.
The fastest-growing nutraceuticals segment is projected to expand at an 11.62% CAGR, outpacing veterinary diets, treats, and food. The Vietnam pet food market size for functional products is fueled by 18% annual demand for probiotics and 22% growth in omega-3 enriched recipes. Stringent import testing under Circular 01/2024 encourages local R&D, helping Vietnamese firms add value and retain margins. Dental chews and freeze-dried treats also climb swiftly as owners link oral care and premium snacking with overall wellness.


By Pets: Cats Front the Next Wave
Dogs represented 61.12% of 2025 revenue, followed by cats and other pets. Within dogs, small-breed formulas dominate urban baskets, while large-breed variants prevail in suburban districts. Cat-specific products, especially hairball and indoor recipes, are gaining traction with the species’ rising popularity among city dwellers. Increasing humanization of pets and the demand for tailored diets are further driving innovation across all pet types.
Cats head the growth table at an 8.27% CAGR, outpacing dogs and other pets as apartment living and millennial ownership trends reinforce feline appeal. Life-stage and breed-specific cat nutrition grows 22% year over year. Exotic pet numbers also rise modestly, opening niche spaces for insect-protein and species-tailored formulations, highlighting Vietnam’s gradual shift toward diversified and health-oriented pet food consumption.
By Distribution Channel: Omnichannel Becomes Norm
Specialty stores captured 72.44% of 2025 sales, followed by supermarkets and hypermarkets, with online and convenience channels gradually expanding their footprint. The specialty channel’s dominance stems from curated assortments, personalized advisory services, and premium positioning that resonate with discerning pet owners. Mass retail continues to attract value-focused buyers through promotions and one-stop shopping convenience, ensuring balanced market coverage across income tiers.
Online leads growth at a 9.33% CAGR, followed by convenience stores, specialty, and supermarkets. The Vietnam pet food market size sold online is set to quadruple by 2031 as mobile-first consumers and loyalty subscriptions expand. Cross-channel research patterns mean 67% of buyers read reviews online before purchasing in stores, prompting brands to integrate inventory visibility and click-and-collect services.
Geography Analysis
Ho Chi Minh City and Hanoi accounted for a significant share of national pet food sales in 2025, with per-capita spending exceeding three times the rural average. Higher incomes, extensive retail networks, and early adoption of Western pet care practices support market value. Increasing consumer sophistication is driving the growth of premium products, with high-income areas such as District 1 and District 7 in Ho Chi Minh City reporting the highest average transaction values.
Secondary coastal and river cities, Da Nang, Hai Phong, and Can Tho, are expanding at 12–15% annually, driven by tourism, industrial investment, and rising middle-class populations. Retail infrastructure in these cities mirrors early Tier-1 patterns, with specialty chains rolling out new formats. Competitive intensity is lower, offering first-mover advantage to brands willing to invest in localized merchandising and community engagement.
Rural provinces still lean on working dogs and hobby fishkeeping, requiring affordable, utilitarian formulas. Logistics costs add 15–20% to rural shelf prices, limiting premium uptake. However, e-commerce penetration is improving as last-mile networks mature, letting rural consumers access wider assortments at city-level pricing. Northern provinces prefer chicken and pork bases, while southern buyers show a penchant for fish and shrimp formulas that align with local palates.
Competitive Landscape
The top five companies controlled a dominant share of 2024 sales, demonstrating moderate concentration. Mars Incorporated and Nestlé (Purina) leverage global R&D and marketing heft, while the Charoen Pokphand Group. competes on local supply chain strength.
Technology deployment marks a key differentiator. Category leaders implement AI-driven demand forecasting, automated blending lines, and pet profile–based recommendation engines. Patent filings rose 34% in 2024, focusing on functional actives, insect protein, and compostable packaging. New entrants target white-space niches: prescription diets, raw and freeze-dried alternatives, and insect-based treats. Retailer private labels are also gaining traction, especially online, putting margin pressure on branded producers.
M&A activity is poised to rise as multinationals scout local assets offering established distribution. Meanwhile, mid-size Vietnamese firms form joint ventures with regional seafood and livestock processors to secure ingredient supply and scale. Regulatory compliance around microbiological testing and plastic waste adds cost layers that favor larger, vertically integrated operators.
Vietnam Pet Food Industry Leaders
-
Mars, Incorporated
-
Nestle (Purina)
-
Charoen Pokphand Group.
-
EBOS Group Limited
-
DoggyMan H.A.Co.,Ltd.
- *Disclaimer: Major Players sorted in no particular order

Recent Industry Developments
- June 2025: The American Feed Industry Association secured federal funding of USD 242,600 through the USDA’s Emerging Markets Program to support United States animal food exports to Vietnam. This initiative is anticipated to enhance trade relations and drive the growth of Vietnam’s pet food market by providing greater access to high-quality pet food ingredients and formulations.
- August 2025: AEON Vietnam has announced plans to accelerate the expansion of its retail network. By the end of 2025, the company aims to operate 8 shopping centres, 15 general merchandise stores and supermarkets, 45 medium- and small-sized supermarkets, 180 convenience stores, and 29 speciality shops. This expanded network is estimated to significantly increase the availability of premium pet-food brands across both urban and regional markets in Vietnam.
- September 2024: VAFO PRAHA s.r.o. launched new meaty pouches for dogs under its Brit Premium by Nature brand, featuring high meat content and locally-sourced vegetables, promoting balanced nutrition in Vietnam. This aligned with their sustainability initiatives by ensuring quality ingredients and supporting local sourcing.


Vietnam Pet Food Market Report Scope
The Vietnam Pet Food Market Report is Segmented Into Pet Food Product (Food, Pet Nutraceuticals/Supplements, Pet Treats, and Pet Veterinary Diets), Pets (Cats, Dogs, and Other Pets), and Distribution Channel (Convenience Stores, Online Channel, Specialty Stores, Supermarkets/Hypermarkets, and Other Channels). The Market Size is Given in Terms of Both Value (USD) and Volume (Metric Tons)
Pet Food Product
| Food | By Sub Product | Dry Pet Food | By Sub Dry Pet Food | Kibbles |
| Other Dry Pet Food | ||||
| Wet Pet Food | ||||
| Pet Nutraceuticals/Supplements | By Sub Product | Milk Bioactives | ||
| Omega-3 Fatty Acids | ||||
| Probiotics | ||||
| Proteins and Peptides | ||||
| Vitamins and Minerals | ||||
| Other Nutraceuticals | ||||
| Pet Treats | By Sub Product | Crunchy Treats | ||
| Dental Treats | ||||
| Freeze-dried and Jerky Treats | ||||
| Soft and Chewy Treats | ||||
| Other Treats | ||||
| Pet Veterinary Diets | By Sub Product | Derma Diets | ||
| Diabetes | ||||
| Digestive Sensitivity | ||||
| Obesity Diets | ||||
| Oral Care Diets | ||||
| Renal | ||||
| Urinary Tract Disease | ||||
| Other Veterinary Diets |
Pets
| Cats |
| Dogs |
| Other Pets |
Distribution Channel
| Convenience Stores |
| Online Channel |
| Specialty Stores |
| Supermarkets/Hypermarkets |
| Other Channels |
| Pet Food Product | Food | By Sub Product | Dry Pet Food | By Sub Dry Pet Food | Kibbles |
| Other Dry Pet Food | |||||
| Wet Pet Food | |||||
| Pet Nutraceuticals/Supplements | By Sub Product | Milk Bioactives | |||
| Omega-3 Fatty Acids | |||||
| Probiotics | |||||
| Proteins and Peptides | |||||
| Vitamins and Minerals | |||||
| Other Nutraceuticals | |||||
| Pet Treats | By Sub Product | Crunchy Treats | |||
| Dental Treats | |||||
| Freeze-dried and Jerky Treats | |||||
| Soft and Chewy Treats | |||||
| Other Treats | |||||
| Pet Veterinary Diets | By Sub Product | Derma Diets | |||
| Diabetes | |||||
| Digestive Sensitivity | |||||
| Obesity Diets | |||||
| Oral Care Diets | |||||
| Renal | |||||
| Urinary Tract Disease | |||||
| Other Veterinary Diets | |||||
| Pets | Cats | ||||
| Dogs | |||||
| Other Pets | |||||
| Distribution Channel | Convenience Stores | ||||
| Online Channel | |||||
| Specialty Stores | |||||
| Supermarkets/Hypermarkets | |||||
| Other Channels | |||||


Market Definition
- FUNCTIONS - Pet foods are usually intended to provide complete and balanced nutrition to the pet but are primarily used as functional products. The scope includes the food and supplements consumed by pets including veterinary diets. Supplements/nutraceuticals that are directly supplied to pets are considered within the scope.
- RESELLERS - Companies engaged in reselling of pet food without value addition have been excluded from the market scope, in order to avoid double counting.
- END CONSUMERS - Pet owners are considered to be the end-consumers in the market studied.
- DISTRIBUTION CHANNELS - Supermarkets/hypermarkets, specialty stores, convenience stores, online channels and other channels are considered within the scope. The stores which are exclusively providing pet related basic and custom products are considered within the scope of specialty stores.
| Keyword | Definition |
|---|---|
| Pet Food | The scope of pet food includes the food that is eatable by pets including food, treats, veterinary diets, and nutraceuticals/supplements. |
| Food | Food is animal feed intended for consumption by pets. It is formulated to provide essential nutrients and meet the dietary needs of various types of pets, including dogs, cats, and other animals. These are generally segmented into dry and wet pet foods. |
| Dry Pet Food | Dry pet foods may be extruded/baked (kibbles) or flaked. They have a lower moisture content, typically around 12-20%. |
| Wet Pet Food | Wet pet food, also known as canned pet food or moist pet food, generally has a higher moisture content compared to dry pet food, often ranging from 70-80%. |
| Kibbles | Kibbles are dry, processed pet food in small, bite-sized pieces or pellets. They are specifically formulated to provide balanced nutrition for various domestic animals, such as dogs, cats, and other animals. |
| Treats | Pet Treats are special food items or rewards given to pets, to show affection, and encourage good behavior. They are especially used during training. Pet treats are made from various combinations of meat or meat-derived materials with other ingredients. |
| Dental Treats | Pet dental treats are specialized treats that are formulated to promote good oral hygiene in pets. |
| Crunchy Treats | It is a type of pet treat that has a firm and crispy texture which can be a good source of nutrition for pets. |
| Soft and chewy treats | Soft and Chewy pet treats are a type of pet food product that is formulated to be easy to chewy and digest. They are usually made from soft and pliable ingredients, such as meat, poultry, or vegetables, that have been blended and formed into bite-sized pieces or strips. |
| Freeze-dried & Jerky Treats | Freeze-dried and jerky treats are snacks given to pets, that are prepared through a special preservation process, without damaging the nutritional content, resulting in long-lasting, nutrient-rich treats. |
| Urinary Tract Disease Diets | These are commercial diets that are specifically formulated to promote urinary health and reduce the risk of urinary tract infections and other urinary problems. |
| Renal Diets | These are specialized pet foods formulated to support the health of pets with kidney disease or renal insufficiency. |
| Digestive Sensitivity Diets | Digestive-sensitive diets are specially formulated to meet the nutritional needs of pets with digestive issues such as food intolerances, allergies, and sensitivities. These diets are designed to be easily digestible and to reduce the symptoms of digestive problems in pets. |
| Oral Care Diets | Oral care diets for pets are specially formulated diets produced to promote oral health and hygiene in pets. |
| Grain-Free Pet Food | Pet food that does not contain common grains like wheat, corn, or soy. Grain-free diets are often preferred by pet owners seeking alternative options or if their pets have specific dietary sensitivities. |
| Premium Pet Food | High-quality pet food formulated with superior ingredients often offers additional nutritional benefits compared to standard pet food. |
| Natural Pet Food | Pet food made from natural ingredients, with minimal processing and without artificial preservatives. |
| Organic Pet Food | Pet food is produced using organic ingredients, free from synthetic pesticides, hormones, and genetically modified organisms (GMOs). |
| Extrusion | A manufacturing process used to produce dry pet food, where ingredients are cooked, mixed, and shaped under high pressure and temperature. |
| Other Pets | Other pets include birds, fish, rabbits, hamsters, ferrets, and reptiles. |
| Palatability | The taste, texture, and aroma of pet food influence its appeal and acceptance by pets. |
| Complete and Balanced Pet Food | Pet food that provides all essential nutrients in appropriate proportions to meet the nutritional needs of pets without additional supplementation. |
| Preservatives | These are the substances that are added to pet food to extend its shelf life and prevent spoilage. |
| Nutraceuticals | Food products that offer health benefits beyond basic nutrition, often contain bioactive compounds with potential therapeutic effects. |
| Probiotics | Live beneficial bacteria that promote a healthy balance of gut flora, supporting digestive health and immune function in pets. |
| Antioxidants | Compounds that help neutralize harmful free radicals in the body, promoting cellular health and supporting the immune system in pets. |
| Shelf-Life | The duration of which pet food remains safe and nutritionally viable for consumption after its production date. |
| Prescription diet | Specialized pet food formulated to address specific medical conditions under veterinary supervision. |
| Allergen | A substance that can cause allergic reactions in some pets, leading to food allergies or sensitivities. |
| Canned food | Wet pet food that is packed in cans and contains higher moisture content than dry food. |
| Limited ingredient diet (LID) | Pet food formulated with a reduced number of ingredients to minimize potential allergens. |
| Guaranteed Analysis | The minimum or maximum levels of certain nutrients present in pet food. |
| Weight management | Pet food designed to help pets maintain a healthy weight or support weight loss efforts. |
| Other Nutraceuticals | It includes prebiotics, antioxidants, digestive fiber, enzymes, essential oils and herbs. |
| Other Veterinary Diets | It includes weight management diets, skin and coat health, cardiac care, and joint care. |
| Other Treats | It includes rawhides, mineral blocks, lickables, and catnips. |
| Other Dry Foods | It includes cereal flakes, mixers, meal toppers, freeze-dried foods, and air-dried foods. |
| Other Animals | It includes birds, fish, reptiles, and small animals (rabbits, ferrets, hamsters). |
| Other Distribution Channels | It includes veterinary clinics, local unregulated stores, and feed and farm stores. |
| Proteins and Peptides | Proteins are large molecules composed of basic units called amino acids which help in the growth and development of pets. Peptides are the short string of 2 to 50 amino acids. |
| Omega-3 fatty acids | Omega-3 fatty acids are essential polyunsaturated fats that play a crucial role in the overall health and well-being of Pets |
| Vitamins | Vitamins are the essential organic compounds that are essential for vital physiological functioning. |
| Minerals | Minerals are naturally occurring inorganic substances that are essential for various physiological functions in pets. |
| CKD | Chronic Kidney Disease |
| DHA | Docosahexaenoic Acid |
| EPA | Eicosapentaenoic Acid |
| ALA | Alpha-linolenic Acid |
| BHA | Butylated Hydroxyanisol |
| BHT | Butylated Hydroxytoluene |
| FLUTD | Feline Lower Urinary Tract Disease |


Research Methodology
Mordor Intelligence follows a four-step methodology in all our reports.
- Step-1: IDENTIFY KEY VARIABLES: In order to build a robust forecasting methodology, the variables and factors identified in Step-1 are tested against available historical market numbers. Through an iterative process, the variables required for market forecast are set and the model is built on the basis of these variables.
- Step-2: Build a Market Model: Market-size estimations for the forecast years are in nominal terms. Inflation is not a part of the pricing, and the average selling price (ASP) is kept constant throughout the forecast period.
- Step-3: Validate and Finalize: In this important step, all market numbers, variables and analyst calls are validated through an extensive network of primary research experts from the market studied. The respondents are selected across levels and functions to generate a holistic picture of the market studied.
- Step-4: Research Outputs: Syndicated Reports, Custom Consulting Assignments, Databases & Subscription Platforms


