Market Overview
| Study Period | 2018 - 2031 |
|---|---|
| Forecast Data Period | 2026 - 2031 |
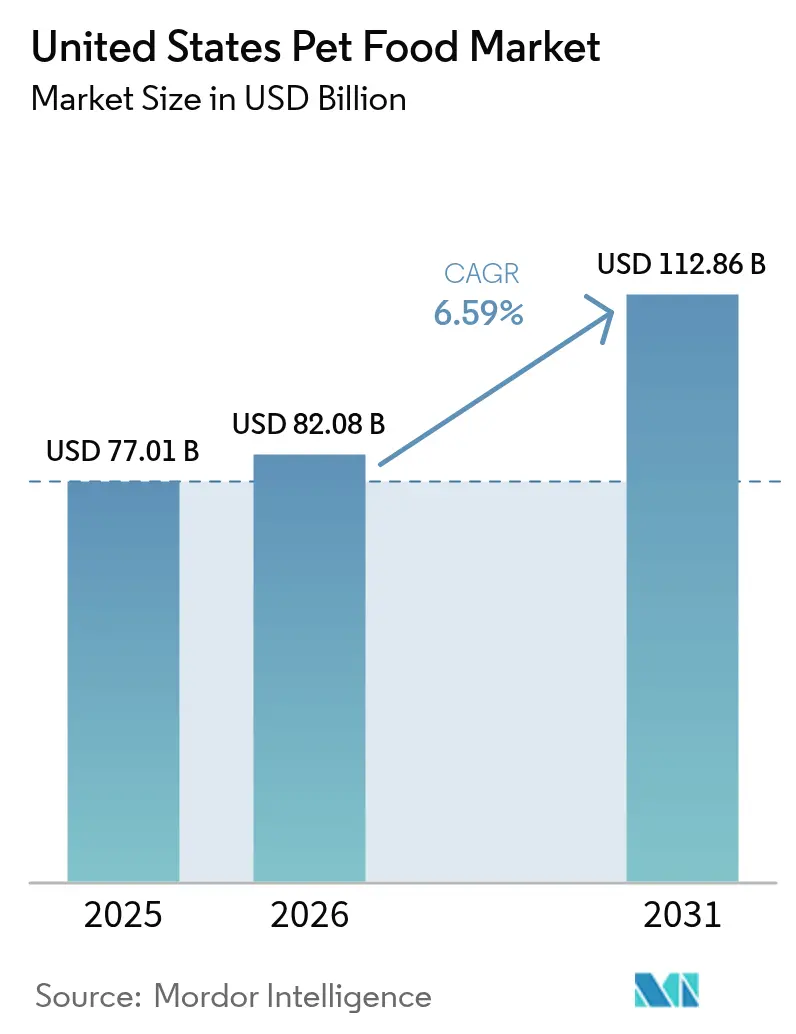
| Base Year Market Size (2025) | USD 77.01 Billion |
| Market Size (2026) | USD 82.08 Billion |
| Market Size (2031) | USD 112.86 Billion |
| Growth Rate (2026 - 2031) | 6.59% CAGR |
| Market Concentration | Medium |
Major Players *Disclaimer: Major Players sorted in no particular order Image © Mordor Intelligence. Reuse requires attribution under CC BY 4.0. | |
United States Pet Food Market Analysis by Mordor Intelligence
The United States pet food market size was valued at USD 77.01 billion in 2025 and estimated to grow from USD 82.08 billion in 2026 to reach USD 112.86 billion by 2031, at a CAGR of 6.59% during the forecast period (2026-2031). Rising disposable incomes and the continued humanization of pets drive demand for premium and functional formulations across urban and suburban households. Fresh and minimally processed foods are gaining traction as owners equate diet quality with preventive healthcare, prompting manufacturers to invest in cold-chain logistics and human-grade production lines. E-commerce adoption accelerates the adoption of subscription services that lock in repeat purchases and facilitate personalized diet plans. At the same time, sustained R&D around gut health additives and alternative proteins positions ingredient suppliers for incremental growth through 2030.
Key Report Takeaways
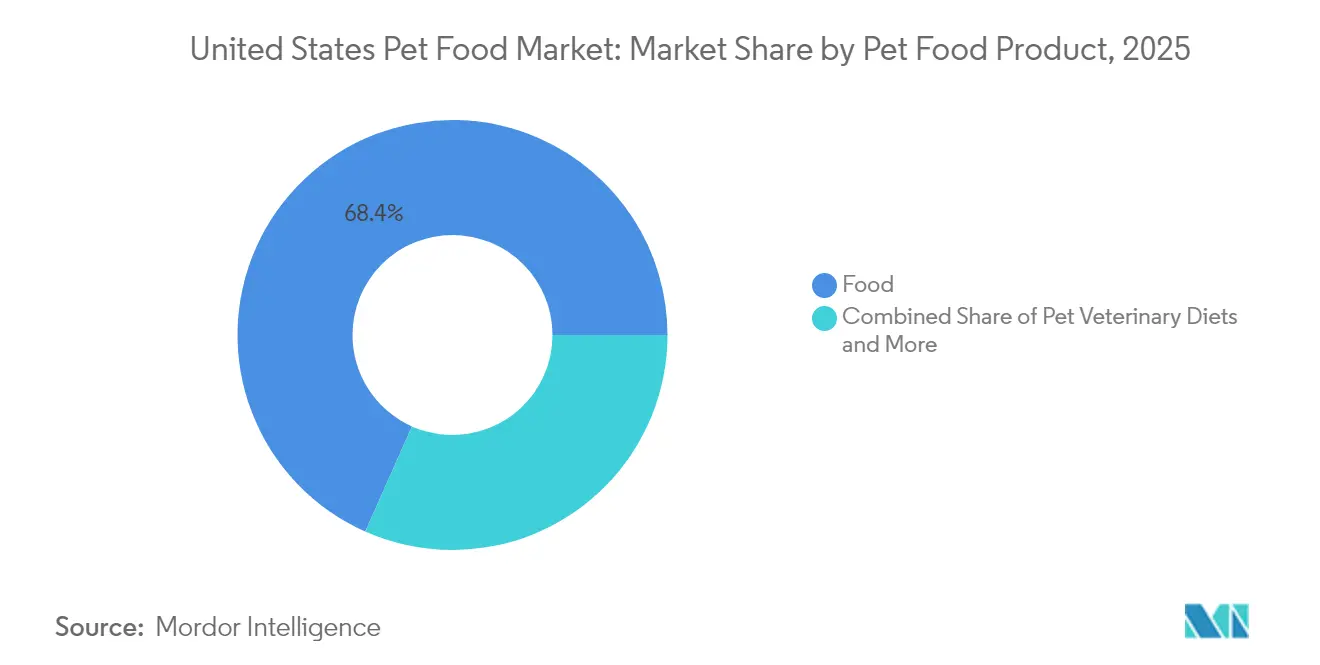
- By product category, food accounted for 68.35% of the revenue share in 2025, and pet veterinary diets are projected to expand at an 7.62% CAGR through 2031.
- By pets, dogs captured a 49.20% share of the United States pet food market in 2025 while sustaining an 7.95% CAGR to 2031.
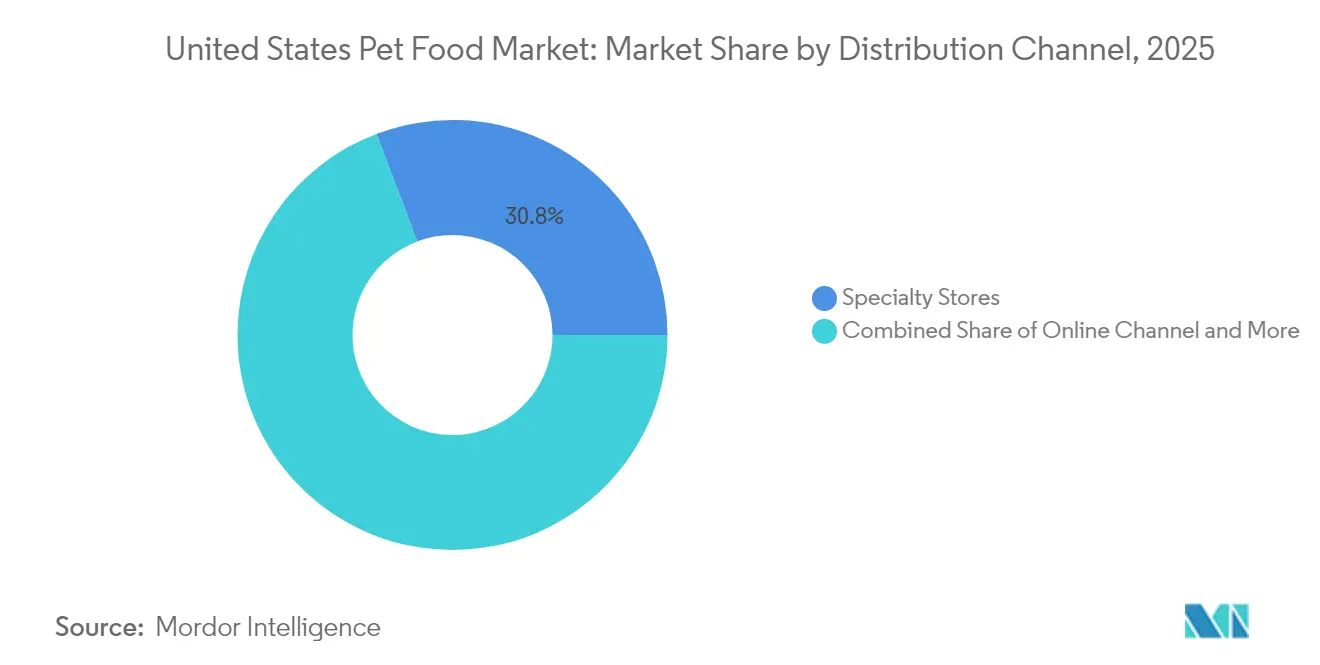
- By distribution channel, specialty stores accounted for 30.75% of 2025 sales, while the online channel is projected to advance at an 8.35% CAGR through 2031.
Note: Market size and forecast figures in this report are generated using Mordor Intelligence’s proprietary estimation framework, updated with the latest available data and insights as of 2026.
United States Pet Food Market Trends and Insights
Drivers Impact Analysis*
| Driver | (~) % Impact on CAGR Forecast | Geographic Relevance | Impact Timeline |
|---|---|---|---|
| Premiumization and human-grade formulations | +1.2% | National, concentrated in urban markets | Medium term (2-4 years) |
| Functional ingredients targeting gut and immune health | +0.9% | National, with higher adoption in coastal regions | Long term (≥ 4 years) |
| Direct-to-consumer (DTC) fresh-frozen meal services | +0.7% | National, early gains in metropolitan areas | Short term (≤ 2 years) |
| Subscription-based automatic replenishment models | +0.8% | National, accelerated by e-commerce growth | Medium term (2-4 years) |
| Veterinary channel endorsement of life-stage diets | +0.6% | National, stronger in suburban markets | Long term (≥ 4 years) |
| Corporate ESG commitments driving sustainable packaging | +0.4% | National, led by environmentally conscious regions | Long term (≥ 4 years) |
| Source: Mordor Intelligence | |||


Premiumization and Human-Grade Formulations
The shift toward human-grade pet food formulations represents a fundamental recalibration of consumer expectations, with pet owners increasingly viewing nutrition as a form of preventive healthcare rather than merely basic sustenance. This trend drives margin expansion across the value chain, as human-grade products command price premiums of 40-60% over conventional kibble formulations[1]. The regulatory framework surrounding human-grade claims has tightened significantly, with AAFCO (Association of American Feed Control Officials) establishing stricter guidelines for ingredient sourcing and processing standards that mirror human food safety protocols. The trend particularly benefits smaller, specialized brands that can navigate regulatory compliance more efficiently than large-scale manufacturers, who are often constrained by existing infrastructure investments.
Functional Ingredients Targeting Gut and Immune Health
Functional ingredient integration transforms pet food from basic nutrition to targeted health intervention, with probiotics, prebiotics, and omega-3 fatty acids becoming standard inclusions rather than premium add-ons. Research on the gut-brain axis in companion animals mirrors human nutrition science, creating opportunities for cross-pollination between ingredient suppliers serving both markets. Regulatory influence from the FDA's Center for Veterinary Medicine ensures ingredient safety while allowing health claims that support premium positioning. This trend particularly benefits ingredient suppliers with dual human-pet portfolios, creating economies of scale and shared R&D investments across market segments.
Direct-to-Consumer (DTC) Fresh-Frozen Meal Services
Direct-to-consumer models disrupt traditional retail relationships by capturing higher margins while building direct customer relationships that enable personalized nutrition and subscription revenue streams. The Farmer's Dog raised USD 39 million in Series funding in 2024, demonstrating investor confidence in the model's scalability potential. Cold-chain logistics represent both a barrier and a competitive moat, as companies with established distribution networks gain sustainable advantages over new entrants. Subscription economics create predictable revenue streams that support higher customer acquisition costs, though churn rates remain elevated compared to traditional retail purchases. The model particularly succeeds in urban markets where convenience premiums justify higher per-serving costs and delivery logistics remain economically viable.
Subscription-Based Automatic Replenishment Models
Automatic replenishment transforms pet food purchasing from episodic transactions to recurring revenue relationships, enabling retailers to capture larger customer lifetime values while reducing acquisition costs. Chewy's autoship program accounts for 70% of net sales, demonstrating the model's effectiveness in driving customer loyalty and generating predictable cash flows. The subscription model creates switching costs through convenience and customization features, though it requires sophisticated inventory management and demand forecasting capabilities. Regulatory compliance factors become more complex as subscription services must navigate state-by-state regulations governing automatic billing and cancellation policies. This trend benefits established e-commerce players with existing logistics infrastructure while challenging traditional brick-and-mortar retailers to develop omnichannel capabilities.
Restraints Impact Analysis*
| Restraint | (~) % Impact on CAGR Forecast | Geographic Relevance | Impact Timeline |
|---|---|---|---|
| Supply-side pressure from meat protein inflation | -0.8% | National, affecting all protein-based products | Short term (≤ 2 years) |
| FTC's Scrutiny of Natural and Human-Grade Claims | -0.5% | National, regulatory enforcement nationwide | Medium term (2-4 years) |
| Growing consumer skepticism toward ultra-processed kibbles | -0.6% | National, stronger in educated demographics | Long term (≥ 4 years) |
| Protein-source volatility from insect farming scale-ups | -0.4% | National, intensified in competitive markets | Medium term (2-4 years) |
| Source: Mordor Intelligence | |||
Supply-Side Pressure from Meat Protein Inflation
Protein cost volatility creates margin compression, forcing manufacturers to balance ingredient quality with pricing competitiveness, particularly for premium products that emphasize high meat content. Chicken prices increased 23% year-over-year in 2024, while beef costs rose 18%, creating significant input cost pressures for manufacturers heavily reliant on animal proteins [1]Source: USDA Economic Research Service, “Food Price Outlook,” ers.usda.gov . Supply chain diversification becomes increasingly critical as companies seek alternative protein sources, including insect-based and plant-based formulations, that offer both cost stability and sustainability benefits. The constraint particularly impacts smaller manufacturers with limited purchasing power and supply chain flexibility compared to large-scale producers with global sourcing capabilities and long-term supplier contracts.
FTC's Scrutiny of Natural and Human-Grade Claims
Regulatory enforcement intensifies around marketing claims as the FTC increases scrutiny of "natural," "human-grade," and health-related assertions that lack scientific substantiation or clear definitional standards. The FTC issued warning letters to 12 pet food companies in 2024 regarding unsubstantiated health claims, creating compliance costs and reformulation requirements across the industry[2]Source: Federal Trade Commission, “Pet Food Marketing Claims Enforcement,” ftc.gov. Legal risk mitigation requires increased investment in clinical studies and regulatory affairs capabilities, creating barriers for smaller companies while benefiting established players with existing compliance infrastructure. The regulatory environment particularly affects premium brands that rely on health and quality claims for differentiation and pricing power in competitive market segments.
*Our forecasts treat driver/restraint impacts as directional, not additive. The impact forecasts reflect baseline growth, mix effects, and variable interactions.
Segment Analysis
By Pet Food Product: Therapeutic Diets Drive Category Evolution
Food products maintain a dominant market position, with a 68.35% share in 2025, encompassing both traditional dry and wet formulations that serve as the foundation for the market. his accelerated growth is primarily driven by the increasing prevalence of health issues in pets, particularly pet obesity and dental problems, coupled with growing awareness among pet owners about preventive healthcare. The segment's growth is supported by the rising demand for premium and specialized pet food ingredients, including grain-free and organic options. Major manufacturers are continuously expanding their production capabilities and introducing innovative products to meet the evolving nutritional requirements of pets.
Pet veterinary diets are emerging as the fastest-growing segment, with an 7.62% CAGR through 2031, reflecting the medicalization of pet nutrition as veterinarians increasingly prescribe therapeutic formulations for specific health conditions. The segment's expansion is further supported by veterinarians' increasing recommendations for specialized diets to manage various health conditions. The market is witnessing a significant shift towards customized veterinary diets, with manufacturers developing specialized formulations for specific health conditions such as diabetes, digestive sensitivity, and urinary tract diseases. The rise of e-commerce channels has also contributed to the segment's growth by improving accessibility to these specialized products.


By Pets: Dogs Sustain Market Leadership Through Demographics
Dogs are projected to command a 49.20% market share in 2025, with 7.95% CAGR growth anticipated through 2031, supported by favorable demographics, including increasing pet ownership rates and higher per-pet spending among dog owners compared to other companion animals. The canine segment benefits from size diversity, which enables targeted nutrition formulations, ranging from small-breed kibbles addressing metabolic needs to large-breed formulations supporting joint health and controlled growth rates.
The segment's dominance is particularly evident in dry pet food consumption, where kibbles are the most widely consumed format. The segment's strong performance is supported by the increasing trend of pet humanization, with a significant number of dog owners considering their pets as family members. This segment is experiencing the most robust growth trajectory, driven by factors such as the rising number of dog owners, dogs' social nature, versatility, and the wider availability of specialized pet care products.
By Distribution Channel: Digital Transformation Reshapes Retail Landscape
Specialty stores are projected to maintain a 30.75% market share in 2025, driven by expert consultation, a premium product focus, and community-building efforts that foster customer loyalty beyond price competition. These stores have established themselves as the preferred destination for pet owners seeking high-quality and specialized pet food products. The segment's leadership position is attributed to its extensive product offerings, including premium brands and specialized dietary options that cater to specific pet needs and requirements. Specialty stores differentiate themselves through expert staff who provide personalized recommendations and guidance on pet nutrition.
Online channel are projected to surge with an 8.35% CAGR through 2031, transforming the pet food retail landscape through convenience, subscription models, and direct-to-consumer relationships that bypass traditional intermediaries. Online retailers are increasingly incorporating features such as detailed product information, customer reviews, and personalized recommendations to enhance the shopping experience. The channel is particularly strong in the premium and specialized pet food categories, where consumers often seek specific products that may not be readily available in traditional retail outlets. The integration of advanced technologies and artificial intelligence for personalized shopping experiences islikely to further drive the growth of online pet food sales.
Geography Analysis
The United States represents a mature yet dynamic pet food market characterized by high per-capita pet ownership rates and increasing humanization trends that drive premium product adoption and category expansion. Regional variations reflect demographic and economic factors, with coastal markets leading the adoption of premium products, while inland regions maintain stronger traditional product preferences. The regulatory framework provides market stability through FDA (Food and Drug Administration) oversight and AAFCO (Association of American Feed Control Officials) standards that ensure product safety and nutritional adequacy across all geographic markets .
Urban markets demonstrate higher growth rates and premium product penetration, driven by higher disposable incomes, smaller living spaces that favor convenient packaging, and greater exposure to humanization trends through social media and peer influence. Rural markets remain important due to higher pet ownership rates and working animal populations that require specialized nutrition formulations for optimal performance and health maintenance. The geographic distribution of veterinary clinics influences the accessibility of therapeutic diets, with urban concentrations creating competitive advantages for prescription product manufacturers.
State-level regulations create complexity around online sales and direct-to-consumer models, particularly for therapeutic diets that require veterinary oversight and prescription management. The trend toward sustainable packaging gains traction in environmentally conscious regions while facing resistance in cost-sensitive markets that prioritize value over environmental benefits. This geographic diversity requires manufacturers to develop flexible marketing and distribution strategies that address regional preferences while maintaining operational efficiency across diverse market conditions.
Competitive Landscape
The United States pet food market exhibits a consolidated structure dominated by large multinational corporations with diverse product portfolios. Mars, Incorporated, Nestle (Purina), Colgate-Palmolive Company (Hill's Pet Nutrition, Inc.), The J.M. Smucker Company, and General Mills Inc. are leveraging their extensive research capabilities, established distribution networks, and strong brand recognition to maintain their market positions. The market is characterized by the presence of both diversified consumer goods companies that have pet food divisions and specialized pet food manufacturers in the USA, with the former having an advantage due to their broader resource base and cross-segment synergies. The competitive landscape has been shaped by significant merger and acquisition activities, with larger players acquiring smaller, innovative companies to expand their product offerings and capture emerging market segments.
The market also features a notable presence of mid-sized and smaller specialized players who focus on premium and super-premium segments, particularly in natural and organic pet food categories. These companies compete through product differentiation, focusing on specific dietary needs or pet health conditions. Regional players maintain their relevance through strong local distribution networks and understanding of specific geographic market needs, though they face increasing pressure from the expansion strategies of larger competitors.
Technology adoption accelerates competitive differentiation through personalized nutrition platforms, subscription management systems, and direct-to-consumer capabilities that enable customer relationship management and data-driven product development. White-space opportunities emerge in therapeutic nutrition, sustainable packaging, and alternative protein sources where regulatory barriers and technical complexity limit competition while offering significant growth potential.
United States Pet Food Industry Leaders
Mars, Incorporated
Nestle (Purina)
Colgate-Palmolive Company (Hill's Pet Nutrition, Inc.)
The J.M. Smucker Company
General Mills Inc.
- *Disclaimer: Major Players sorted in no particular order

Recent Industry Developments
- July 2025: Mars, Incorporated, a global manufacturer of over 40 well-known snacking, food, and pet brands in the United States, including Royal Canin and PEDIGREE, plans to expand its United States-based manufacturing operations. The company intends to invest approximately USD 2 billion into its United States operations by the end of 2026. This investment reinforces Mars' commitment to United States-based manufacturing, where 94% of the products it sells in the United States are produced domestically. Over the past five years, Mars has invested more than USD 6 billion in United States manufacturing facilities.
- May 2023: Nestle Purina launched new cat treats under the Friskies "Friskies Playfuls - treats" brand. These treats are round in shape and are available in chicken and liver and salmon and shrimp flavors for adult cats.
- March 2023: Blue Buffalo, a subsidiary of General Mills Inc., launched its new high-protein dry dog food line, BLUE Wilderness Premier Blend. It is formulated with chicken and a blend of antioxidants, vitamins, and minerals.


United States Pet Food Market Report Scope
Food, Pet Nutraceuticals/Supplements, Pet Treats, Pet Veterinary Diets are covered as segments by Pet Food Product. Cats, Dogs are covered as segments by Pets. Convenience Stores, Online Channel, Specialty Stores, Supermarkets/Hypermarkets are covered as segments by Distribution Channel.Pet Food Product
| Food | By Sub Product | Dry Pet Food | By Sub Dry Pet Food | Kibbles |
| Other Dry Pet Food | ||||
| Wet Pet Food | ||||
| Pet Nutraceuticals/Supplements | By Sub Product | Milk Bioactives | ||
| Omega-3 Fatty Acids | ||||
| Probiotics | ||||
| Proteins and Peptides | ||||
| Vitamins and Minerals | ||||
| Other Nutraceuticals | ||||
| Pet Treats | By Sub Product | Crunchy Treats | ||
| Dental Treats | ||||
| Freeze-dried and Jerky Treats | ||||
| Soft & Chewy Treats | ||||
| Other Treats | ||||
| Pet Veterinary Diets | By Sub Product | Diabetes | ||
| Digestive Sensitivity | ||||
| Oral Care Diets | ||||
| Renal | ||||
| Urinary tract disease | ||||
| Obesity Diets | ||||
| Derma Diets | ||||
| Other Veterinary Diets |
Pets
| Cats |
| Dogs |
| Other Pets |
Distribution Channel
| Convenience Stores |
| Online Channel |
| Specialty Stores |
| Supermarkets/Hypermarkets |
| Other Channels |
| Pet Food Product | Food | By Sub Product | Dry Pet Food | By Sub Dry Pet Food | Kibbles |
| Other Dry Pet Food | |||||
| Wet Pet Food | |||||
| Pet Nutraceuticals/Supplements | By Sub Product | Milk Bioactives | |||
| Omega-3 Fatty Acids | |||||
| Probiotics | |||||
| Proteins and Peptides | |||||
| Vitamins and Minerals | |||||
| Other Nutraceuticals | |||||
| Pet Treats | By Sub Product | Crunchy Treats | |||
| Dental Treats | |||||
| Freeze-dried and Jerky Treats | |||||
| Soft & Chewy Treats | |||||
| Other Treats | |||||
| Pet Veterinary Diets | By Sub Product | Diabetes | |||
| Digestive Sensitivity | |||||
| Oral Care Diets | |||||
| Renal | |||||
| Urinary tract disease | |||||
| Obesity Diets | |||||
| Derma Diets | |||||
| Other Veterinary Diets | |||||
| Pets | Cats | ||||
| Dogs | |||||
| Other Pets | |||||
| Distribution Channel | Convenience Stores | ||||
| Online Channel | |||||
| Specialty Stores | |||||
| Supermarkets/Hypermarkets | |||||
| Other Channels | |||||


Market Definition
- FUNCTIONS - Pet foods are usually intended to provide complete and balanced nutrition to the pet but are primarily used as functional products. The scope includes the food and supplements consumed by pets including veterinary diets. Supplements/nutraceuticals that are directly supplied to pets are considered within the scope.
- RESELLERS - Companies engaged in reselling of pet food without value addition have been excluded from the market scope, in order to avoid double counting.
- END CONSUMERS - Pet owners are considered to be the end-consumers in the market studied.
- DISTRIBUTION CHANNELS - Supermarkets/hypermarkets, specialty stores, convenience stores, online channels and other channels are considered within the scope. The stores which are exclusively providing pet related basic and custom products are considered within the scope of specialty stores.
| Keyword | Definition |
|---|---|
| Pet Food | The scope of pet food includes the food that is eatable by pets including food, treats, veterinary diets, and nutraceuticals/supplements. |
| Food | Food is animal feed intended for consumption by pets. It is formulated to provide essential nutrients and meet the dietary needs of various types of pets, including dogs, cats, and other animals. These are generally segmented into dry and wet pet foods. |
| Dry Pet Food | Dry pet foods may be extruded/baked (kibbles) or flaked. They have a lower moisture content, typically around 12-20%. |
| Wet Pet Food | Wet pet food, also known as canned pet food or moist pet food, generally has a higher moisture content compared to dry pet food, often ranging from 70-80%. |
| Kibbles | Kibbles are dry, processed pet food in small, bite-sized pieces or pellets. They are specifically formulated to provide balanced nutrition for various domestic animals, such as dogs, cats, and other animals. |
| Treats | Pet Treats are special food items or rewards given to pets, to show affection, and encourage good behavior. They are especially used during training. Pet treats are made from various combinations of meat or meat-derived materials with other ingredients. |
| Dental Treats | Pet dental treats are specialized treats that are formulated to promote good oral hygiene in pets. |
| Crunchy Treats | It is a type of pet treat that has a firm and crispy texture which can be a good source of nutrition for pets. |
| Soft and chewy treats | Soft and Chewy pet treats are a type of pet food product that is formulated to be easy to chewy and digest. They are usually made from soft and pliable ingredients, such as meat, poultry, or vegetables, that have been blended and formed into bite-sized pieces or strips. |
| Freeze-dried & Jerky Treats | Freeze-dried and jerky treats are snacks given to pets, that are prepared through a special preservation process, without damaging the nutritional content, resulting in long-lasting, nutrient-rich treats. |
| Urinary Tract Disease Diets | These are commercial diets that are specifically formulated to promote urinary health and reduce the risk of urinary tract infections and other urinary problems. |
| Renal Diets | These are specialized pet foods formulated to support the health of pets with kidney disease or renal insufficiency. |
| Digestive Sensitivity Diets | Digestive-sensitive diets are specially formulated to meet the nutritional needs of pets with digestive issues such as food intolerances, allergies, and sensitivities. These diets are designed to be easily digestible and to reduce the symptoms of digestive problems in pets. |
| Oral Care Diets | Oral care diets for pets are specially formulated diets produced to promote oral health and hygiene in pets. |
| Grain-Free Pet Food | Pet food that does not contain common grains like wheat, corn, or soy. Grain-free diets are often preferred by pet owners seeking alternative options or if their pets have specific dietary sensitivities. |
| Premium Pet Food | High-quality pet food formulated with superior ingredients often offers additional nutritional benefits compared to standard pet food. |
| Natural Pet Food | Pet food made from natural ingredients, with minimal processing and without artificial preservatives. |
| Organic Pet Food | Pet food is produced using organic ingredients, free from synthetic pesticides, hormones, and genetically modified organisms (GMOs). |
| Extrusion | A manufacturing process used to produce dry pet food, where ingredients are cooked, mixed, and shaped under high pressure and temperature. |
| Other Pets | Other pets include birds, fish, rabbits, hamsters, ferrets, and reptiles. |
| Palatability | The taste, texture, and aroma of pet food influence its appeal and acceptance by pets. |
| Complete and Balanced Pet Food | Pet food that provides all essential nutrients in appropriate proportions to meet the nutritional needs of pets without additional supplementation. |
| Preservatives | These are the substances that are added to pet food to extend its shelf life and prevent spoilage. |
| Nutraceuticals | Food products that offer health benefits beyond basic nutrition, often contain bioactive compounds with potential therapeutic effects. |
| Probiotics | Live beneficial bacteria that promote a healthy balance of gut flora, supporting digestive health and immune function in pets. |
| Antioxidants | Compounds that help neutralize harmful free radicals in the body, promoting cellular health and supporting the immune system in pets. |
| Shelf-Life | The duration of which pet food remains safe and nutritionally viable for consumption after its production date. |
| Prescription diet | Specialized pet food formulated to address specific medical conditions under veterinary supervision. |
| Allergen | A substance that can cause allergic reactions in some pets, leading to food allergies or sensitivities. |
| Canned food | Wet pet food that is packed in cans and contains higher moisture content than dry food. |
| Limited ingredient diet (LID) | Pet food formulated with a reduced number of ingredients to minimize potential allergens. |
| Guaranteed Analysis | The minimum or maximum levels of certain nutrients present in pet food. |
| Weight management | Pet food designed to help pets maintain a healthy weight or support weight loss efforts. |
| Other Nutraceuticals | It includes prebiotics, antioxidants, digestive fiber, enzymes, essential oils and herbs. |
| Other Veterinary Diets | It includes weight management diets, skin and coat health, cardiac care, and joint care. |
| Other Treats | It includes rawhides, mineral blocks, lickables, and catnips. |
| Other Dry Foods | It includes cereal flakes, mixers, meal toppers, freeze-dried foods, and air-dried foods. |
| Other Animals | It includes birds, fish, reptiles, and small animals (rabbits, ferrets, hamsters). |
| Other Distribution Channels | It includes veterinary clinics, local unregulated stores, and feed and farm stores. |
| Proteins and Peptides | Proteins are large molecules composed of basic units called amino acids which help in the growth and development of pets. Peptides are the short string of 2 to 50 amino acids. |
| Omega-3 fatty acids | Omega-3 fatty acids are essential polyunsaturated fats that play a crucial role in the overall health and well-being of Pets |
| Vitamins | Vitamins are the essential organic compounds that are essential for vital physiological functioning. |
| Minerals | Minerals are naturally occurring inorganic substances that are essential for various physiological functions in pets. |
| CKD | Chronic Kidney Disease |
| DHA | Docosahexaenoic Acid |
| EPA | Eicosapentaenoic Acid |
| ALA | Alpha-linolenic Acid |
| BHA | Butylated Hydroxyanisol |
| BHT | Butylated Hydroxytoluene |
| FLUTD | Feline Lower Urinary Tract Disease |


Research Methodology
Mordor Intelligence follows a four-step methodology in all our reports.
- Step-1: IDENTIFY KEY VARIABLES: In order to build a robust forecasting methodology, the variables and factors identified in Step-1 are tested against available historical market numbers. Through an iterative process, the variables required for market forecast are set and the model is built on the basis of these variables.
- Step-2: Build a Market Model: Market-size estimations for the forecast years are in nominal terms. Inflation is not a part of the pricing, and the average selling price (ASP) is kept constant throughout the forecast period.
- Step-3: Validate and Finalize: In this important step, all market numbers, variables and analyst calls are validated through an extensive network of primary research experts from the market studied. The respondents are selected across levels and functions to generate a holistic picture of the market studied.
- Step-4: Research Outputs: Syndicated Reports, Custom Consulting Assignments, Databases & Subscription Platforms


