North America Pet Treats Market Size and Share
Market Overview
| Study Period | 2018 - 2031 |
|---|---|
| Forecast Data Period | 2026 - 2031 |
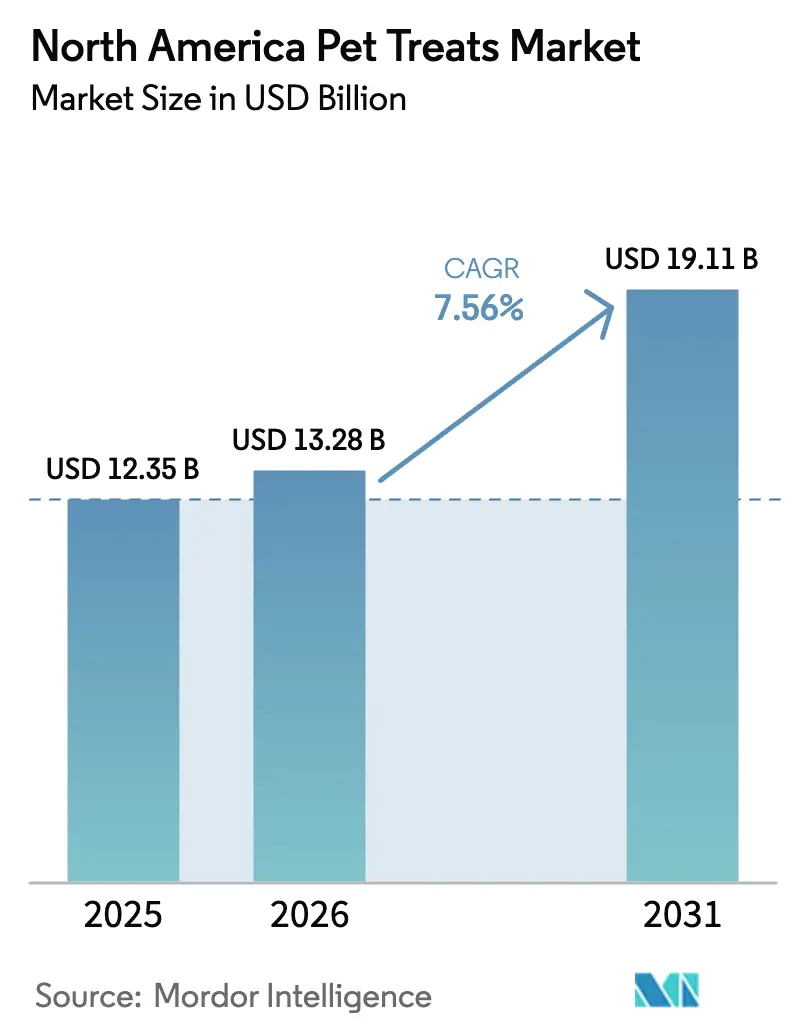
| Base Year Market Size (2025) | USD 12.35 Billion |
| Market Size (2026) | USD 13.28 Billion |
| Market Size (2031) | USD 19.11 Billion |
| Growth Rate (2026 - 2031) | 7.56% CAGR |
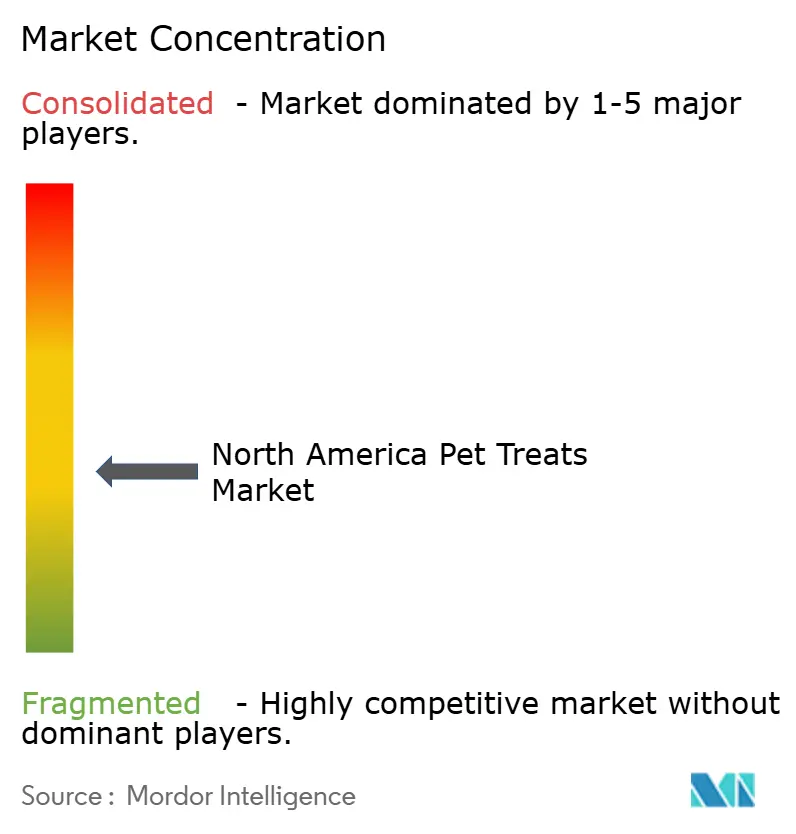
| Market Concentration | Medium |
Major Players *Disclaimer: Major Players sorted in no particular order Image © Mordor Intelligence. Reuse requires attribution under CC BY 4.0. | |
North America Pet Treats Market Analysis by Mordor Intelligence
The North America pet treats market size is expected to grow from USD 12.35 billion in 2025 to USD 13.28 billion in 2026 and is forecast to reach USD 19.11 billion by 2031 at 7.56% CAGR over 2026-2031. As pet humanization expands, the adoption of functional ingredients and omnichannel retail strategies continue to drive demand on an upward trajectory. Premium formulations with human-grade, single-source proteins appeal to owners who equate pet wellness with their own personal health habits. Digital subscriptions and auto-replenishment solutions cement repeat purchasing, while specialty stores reinforce premium positioning through in-store education. Direct-to-consumer entrants are leveraging data-rich models to chip away at the incumbent's share. Regulatory clarity around novel ingredients, as facilitated by the FDA (Food and Drug Administration) and Animal Food Ingredient Consultation program, accelerates innovation while raising the compliance stakes for smaller firms.
Key Report Takeaways
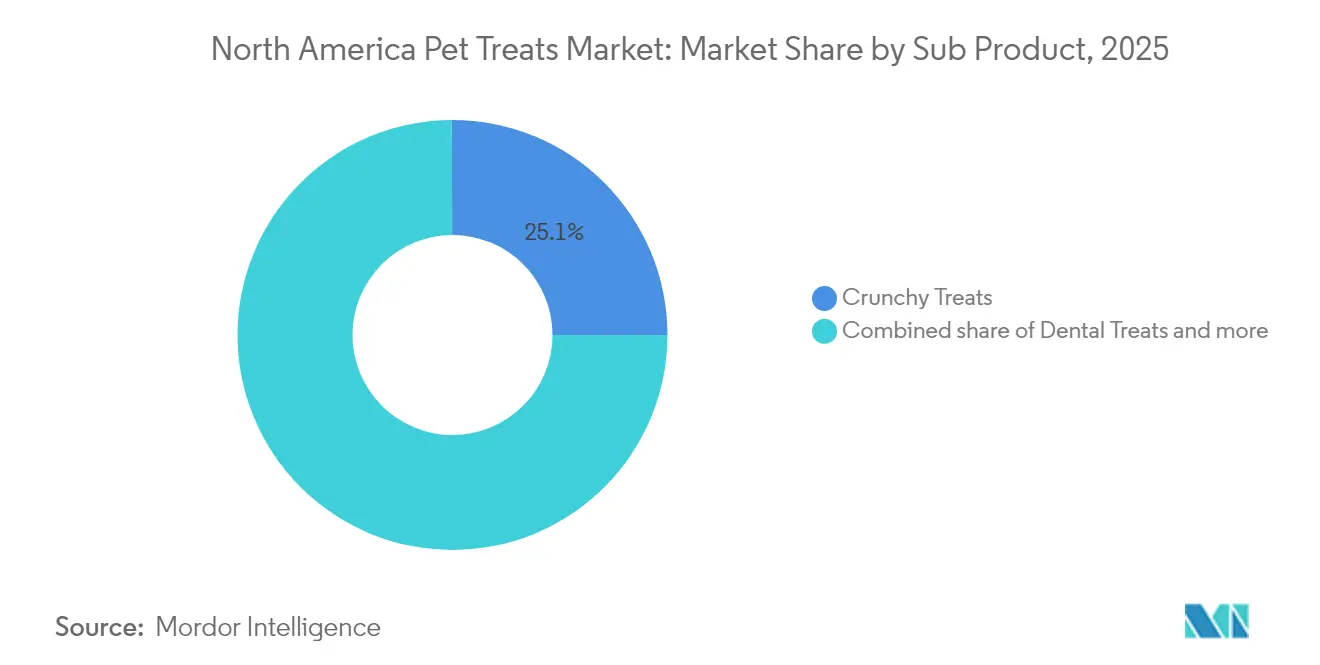
- By sub-product, crunchy treats led the North American pet treats market with a 25.05% share in 2025, while crunchy treats are projected to expand at a 6.38% CAGR through 2031.
- By pet type, dogs commanded a 55.12% share of the North American pet treats market in 2025, while the market is projected to expand at a 8.74% CAGR through 2031.
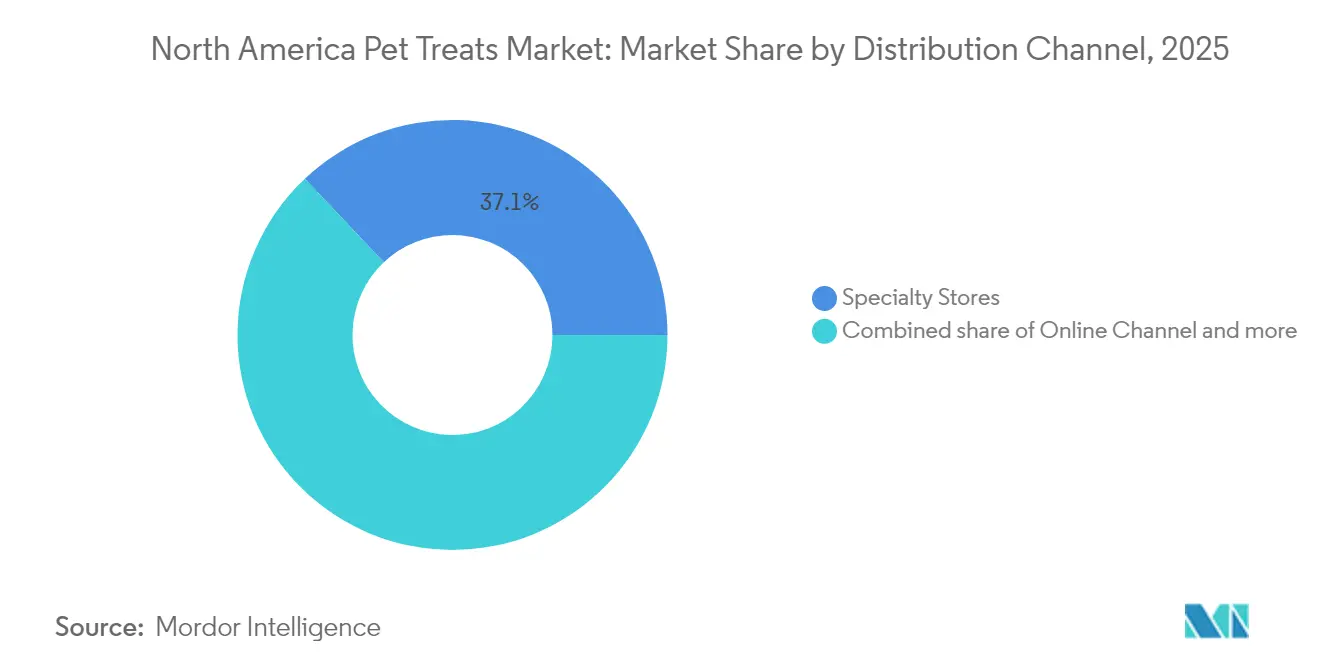
- By distribution channel, specialty stores held a 37.05% revenue share in 2025, whereas online channels are projected to expand at an 8.62% CAGR through 2031.
- By geography, the United States accounted for 84.32% of 2025 sales, and Mexico is projected to grow at a 7.62% CAGR through 2031.
Note: Market size and forecast figures in this report are generated using Mordor Intelligence’s proprietary estimation framework, updated with the latest available data and insights as of 2026.
North America Pet Treats Market Trends and Insights
Drivers Impact Analysis*
| Driver | (~) % Impact on CAGR Forecast | Geographic Relevance | Impact Timeline |
|---|---|---|---|
| Humanization-driven premium spend | +2.1% | Urban hubs across North America | Medium term (2-4 years) |
| Rising pet ownership in the United States and Canada | +1.8% | Core North America | Long term (≥ 4 years) |
| Rapid e-commerce and DTC (Direct-to-Consumer) adoption | +1.5% | Urban North America | Short term (≤ 2 years) |
| Retail-media impulse activation in specialty chains | +0.9% | Concentrated metro markets | Medium term (2-4 years) |
| Emergence of low-MOQ (low minimum order quantity) co-manufacturing for single-ingredient treats | +0.7% | Midwest and Southeast U.S. production hubs | Long term (≥ 4 years) |
| Tele-vet bundling of functional treats | +0.5% | Early-adopter urban centers | Long term (≥ 4 years) |
| Source: Mordor Intelligence | |||


Humanization-Driven Premium Spending
Pet humanization has evolved beyond emotional attachment to drive measurable premium spending behaviors, with owners increasingly treating their pets as family members who require human-grade nutrition standards. This trend is evident in the rapid adoption of treats featuring recognizable ingredients like carrots and turnips, which are replacing traditional by-product formulations that have dominated the category for decades. Regulatory compliance frameworks, such as those established by the Association of American Feed Control Officials (AAFCO), provide credibility for premium claims, while emerging FDA (Food and Drug Administration) guidance, as outlined through the Animal Food Ingredient Consultation program, offers clearer pathways for innovative ingredient approvals.
Rising Pet Ownership in the United States and Canada
Government statistics confirm sustained growth in pet ownership across North America, with the most recent USDA National Animal Health Monitoring System data indicating that 70% of United States households owned pets in 2024, up from 67% in 2020. Statistics Canada's Survey of Household Spending shows similar trends, with 58% of Canadian households reporting pet ownership in 2023, representing a 3% increase from the pre-pandemic level [1]Source:Source: Statistics Canada, “Digital Economy and Society Statistics,” statcan.gc.ca USDA Economic Research Service, “Retail Food Price Data,” ers.usda.gov. The demographic expansion is particularly pronounced among millennials and Gen Z cohorts, with Census Bureau American Community Survey data showing that 35% of households aged 25-34 acquired pets between 2020 and 2024, compared to 18% in the previous four-year period. This ownership expansion directly correlates with treat market growth.
E-commerce and DTC (Direct-to-Consumer) Adoption
Government trade statistics document the accelerated shift toward online pet product purchasing, with Census Bureau Monthly Retail Trade Survey data showing e-commerce pet and pet supplies sales growing 28% in 2024 to reach USD 8.2 billion, compared to 12% growth in traditional pet store sales[2]Source: USDA Economic Research Service, “Retail Food Price Data,” ers.usda.gov. Statistics Canada's Digital Economy data confirms parallel trends in Canada, with online pet product sales increasing 35% in 2024, significantly outpacing the 18% growth in overall e-commerce. The trend is supported by improved logistics infrastructure and consumer comfort with recurring deliveries, creating sustainable competitive advantages for brands mastering omnichannel integration.
Retail-Media Impulse Activation in Specialty Chains
Specialty stores offset higher price points by utilizing data-backed shelf displays that promote limited-ingredient “pick two” bundles, thereby lifting basket sizes by double digits. Retail media placements within endcaps prompt unplanned purchases, particularly for first-time buyers exploring functional chews. Staff training and sampling further differentiate brick-and-mortar experiences, sustaining premium treat momentum even as mass retail faces price compression. In 2024, USDA Economic Research Service data on retail margins indicate that specialty pet retailers maintain gross margins of 35-40% on treats, compared to 25-30% for mass retailers, supporting investment in customer engagement technologies that drive incremental sales.
Restraints Impact Analysis*
| Restraint | (~) % Impact on CAGR Forecast | Geographic Relevance | Impact Timeline |
|---|---|---|---|
| Inflation-led trade-down toward private label | -1.2% | Price-sensitive segments | Short term (≤ 2 years) |
| Heightened FDA / CFIA (Food and Drug Administration/Canadian Food Inspection Agency) recall and labeling scrutiny | -0.8% | All of North America | Medium term (2-4 years) |
| Cannibalization by functional supplements | -0.6% | Premium consumer clusters | Medium term (2-4 years) |
| Cost pressure from alternative-protein sustainability mandates | -0.4% | Regulatory overlap with North America | Long term (≥ 4 years) |
| Source: Mordor Intelligence | |||
Inflation-Led Trade-Down Toward Private Label
Economic pressures are accelerating consumer migration toward lower-priced private label alternatives, creating significant headwinds for branded treat manufacturers. This trade-down behavior is reflected in private label market share gains. Retailers are capitalizing on this trend through aggressive private label expansion, exemplified by Chewy's private brand sales growing over 60% in Q3 2024, with particular strength in consumables categories. The restraint disproportionately impacts premium segments, where price sensitivity is highest, forcing branded manufacturers to compete on value rather than differentiation. This compresses margins and reduces investment capacity for innovation and marketing initiatives that drive category growth.
Heightened FDA / CFIA (Food and Drug Administration/Canadian Food Inspection Agency) Recall and Labeling Scrutiny
Intensified regulatory oversight is creating compliance cost pressures and market entry barriers that constrain industry growth and innovation velocity. The expiration of the AAFCO memorandum of understanding in October 2024 has fundamentally altered ingredient approval pathways, narrowing routes to FDA's GRAS notice process, Food Additive Petitions, and the newly introduced Animal Food Ingredient Consultation program. The compliance burden disproportionately impacts smaller manufacturers lacking dedicated regulatory resources, potentially accelerating consolidation while reducing the innovation pipeline that drives category expansion and consumer interest.
*Our forecasts treat driver/restraint impacts as directional, not additive. The impact forecasts reflect baseline growth, mix effects, and variable interactions.
Segment Analysis
By Sub-Product: Crunchy Treats Retain Leadership through Convenience
Crunchy treats accounted for 25.05% of the North American pet treats market share in 2025, while they are projected to expand at a 6.38% CAGR through 2031, benefiting from their long shelf life, easy portion control, and clear training use cases. This segment's leadership position is attributed to the wide variety of products available to cater to diverse pet owner preferences.
Dogs are the primary consumers of crunchy treats, making a significant contribution to the market value, followed by cats, which tend to be more selective in their food choices. The United States dominates the North American crunchy pet treats market, holding around 85% share of this segment, attributed to factors including higher pet ownership rates, greater presence of premium and natural pet food brands, and wider product availability through specialty pet food stores such as Petco and PetSmart.


By Pets: Dogs Dominate While Cat Segment Accelerates Growth
Dogs commanded 55.12% market share in 2025, reflecting their higher treat consumption frequency, larger portion sizes, and owners' willingness to invest in training and reward-based products. The dog segment benefits from established behavioral associations between treats and positive reinforcement, resulting in consistent demand across various life stages and activity levels. The segment's dominance is further reinforced by dogs' higher consumption of treats compared to other pets, particularly in the categories of dental treats and crunchy treats.
The dog segment is experiencing accelerated growth at a 8.74% CAGR through 2031. The United States leads this segment, accounting for approximately 83% of the regional dog treats market, driven by the widespread availability of premium and natural treat options. The segment's growth is supported by increasing pet humanization trends, with pet owners, particularly millennials, showing a strong preference for high-quality, natural, and functional treats that cater to the specific health needs of their dogs.
By Distribution Channel: Specialty Stores Lead While Online Channels Surge
Specialty stores maintained their market leadership with a 37.05% share in 2025, leveraging knowledgeable staff, premium product assortments, and experiential elements, such as treat bars and sampling programs, to differentiate themselves from mass retail competitors. The channel's strength lies in its ability to support premium positioning through education and personalized recommendations, particularly for functional treats that require explanations of health benefits and usage instructions.
Online channels are experiencing the fastest growth at 8.62% CAGR, driven by subscription services, auto-replenishment programs, and the convenience of recurring deliveries for busy pet owners. Major specialty store chains have also expanded their presence through their own e-commerce platforms, contributing to the growth of the segment. The convenience and flexibility offered by online channels, including the ability to compare prices and access a wide variety of products, have made them increasingly popular among pet owners.
Geography Analysis
The United States dominates the North America pet treats market with an 84.32% share in 2025, supported by the world's largest pet-owning population and the highest per-capita spending on pet products. The United States market benefits from a mature distribution infrastructure, established premium positioning acceptance, and regulatory frameworks that support innovation while ensuring safety standards. Consumer behavior research indicates a strong preference for natural ingredients, with messaging emphasizing "no artificial ingredients" driving significantly higher purchase intent than generic "real food" positioning.
Mexico emerges as the fastest-growing geographic segment, with a 7.62% CAGR through 2031, driven by expanding middle-class pet ownership and significant infrastructure investments by multinational companies. Regulatory harmonization efforts and cross-border manufacturing efficiency support market development. Local consumer preferences and price sensitivity necessitate the development of tailored product positioning strategies.
Canada represents a significant growth opportunity. The Canadian market benefits from CFIA regulatory oversight, which ensures product safety while facilitating cross-border trade with the United States. The Rest of North America category encompasses smaller markets that benefit from regional trade agreements and shared distribution networks, although regulatory compliance requirements vary by jurisdiction and can impact product availability and pricing strategies.
Competitive Landscape
The North American pet treats market is moderately consolidated, dominated by large multinational corporations with diverse product portfolios and established brand presence. Mars, Incorporated, Hill's Pet Nutrition, Inc., General Mills Inc., Nestle (Purina), and The J.M. Smucker Company are leveraging their extensive research and development capabilities, manufacturing infrastructure, and distribution networks to maintain market leadership. Local players and specialists operate in niche segments, focusing on premium, natural, and specialized animal treats, though their market share remains relatively small compared to the major conglomerates.
The market has witnessed significant merger and acquisition activity, with major players acquiring smaller companies to expand their product portfolios and market reach. These acquisitions primarily target companies with strong positions in natural and premium treat segments, innovative product offerings, or established regional presence. The trend of consolidation is likely to continue as larger companies seek to strengthen their market position and capitalize on growing consumer demand for premium and specialized pet snacks.
Technology adoption is reshaping competitive dynamics through precision manufacturing, ingredient traceability, and direct-to-consumer platforms that enable smaller brands to compete effectively against established players. Companies like Purina are investing in startup innovation through programs that support AI-driven veterinary tools, alternative protein development, and specialized product formats, demonstrating how incumbents are leveraging external innovation to maintain competitive positioning.
North America Pet Treats Industry Leaders
Mars, Incorporated
General Mills Inc.
Nestle (Purina)
The J.M. Smucker Company
Hill's Pet Nutrition, Inc. (Colgate-Palmolive Company)
- *Disclaimer: Major Players sorted in no particular order

Recent Industry Developments
- December 2024: General Mills completed its acquisition of Whitebridge Pet Brands' North American premium cat feeding and pet treat business, including Tiki Pets and Cloud Star brands plus two manufacturing facilities in Joplin, Missouri, strengthening its premium pet portfolio to complement Blue Buffalo.
- May 2023: Nestle Purina launched new cat treats under the Friskies "Friskies Playfuls - treats" brand. These treats are round in shape and are available in chicken and liver and salmon and shrimp flavors for adult cats.
- February 2023: Nestle SA acquired the US pet treats factory from investor-backed local supplier Red Collar Pet Foods. The company aims to expand its pet food business in North America.


North America Pet Treats Market Report Scope
Crunchy Treats, Dental Treats, Freeze-dried and Jerky Treats, Soft & Chewy Treats are covered as segments by Sub Product. Cats, Dogs are covered as segments by Pets. Convenience Stores, Online Channel, Specialty Stores, Supermarkets/Hypermarkets are covered as segments by Distribution Channel. Canada, Mexico, United States are covered as segments by Country.| Dental Treats |
| Crunchy Treats |
| Soft and Chewy Treats |
| Freeze-dried and Jerky Treats |
| Other Treats |
| Dogs |
| Cats |
| Other Pets |
| Convenience Stores |
| Online Channel |
| Specialty Stores |
| Supermarkets/Hypermarkets |
| Other Channels |
| United States |
| Canada |
| Mexico |
| Rest of North America |
| Sub Product | Dental Treats |
| Crunchy Treats | |
| Soft and Chewy Treats | |
| Freeze-dried and Jerky Treats | |
| Other Treats | |
| Pets | Dogs |
| Cats | |
| Other Pets | |
| Distribution Channel | Convenience Stores |
| Online Channel | |
| Specialty Stores | |
| Supermarkets/Hypermarkets | |
| Other Channels | |
| Geography | United States |
| Canada | |
| Mexico | |
| Rest of North America |


Market Definition
- FUNCTIONS - Pet foods are usually intended to provide complete and balanced nutrition to the pet but are primarily used as functional products. The scope includes the food and supplements consumed by pets including veterinary diets. Supplements/nutraceuticals that are directly supplied to pets are considered within the scope.
- RESELLERS - Companies engaged in reselling of pet food without value addition have been excluded from the market scope, in order to avoid double counting.
- END CONSUMERS - Pet owners are considered to be the end-consumers in the market studied.
- DISTRIBUTION CHANNELS - Supermarkets/hypermarkets, specialty stores, convenience stores, online channels and other channels are considered within the scope. The stores which are exclusively providing pet related basic and custom products are considered within the scope of specialty stores.
| Keyword | Definition |
|---|---|
| Pet Food | The scope of pet food includes the food that is eatable by pets including food, treats, veterinary diets, and nutraceuticals/supplements. |
| Food | Food is animal feed intended for consumption by pets. It is formulated to provide essential nutrients and meet the dietary needs of various types of pets, including dogs, cats, and other animals. These are generally segmented into dry and wet pet foods. |
| Dry Pet Food | Dry pet foods may be extruded/baked (kibbles) or flaked. They have a lower moisture content, typically around 12-20%. |
| Wet Pet Food | Wet pet food, also known as canned pet food or moist pet food, generally has a higher moisture content compared to dry pet food, often ranging from 70-80%. |
| Kibbles | Kibbles are dry, processed pet food in small, bite-sized pieces or pellets. They are specifically formulated to provide balanced nutrition for various domestic animals, such as dogs, cats, and other animals. |
| Treats | Pet Treats are special food items or rewards given to pets, to show affection, and encourage good behavior. They are especially used during training. Pet treats are made from various combinations of meat or meat-derived materials with other ingredients. |
| Dental Treats | Pet dental treats are specialized treats that are formulated to promote good oral hygiene in pets. |
| Crunchy Treats | It is a type of pet treat that has a firm and crispy texture which can be a good source of nutrition for pets. |
| Soft and chewy treats | Soft and Chewy pet treats are a type of pet food product that is formulated to be easy to chewy and digest. They are usually made from soft and pliable ingredients, such as meat, poultry, or vegetables, that have been blended and formed into bite-sized pieces or strips. |
| Freeze-dried & Jerky Treats | Freeze-dried and jerky treats are snacks given to pets, that are prepared through a special preservation process, without damaging the nutritional content, resulting in long-lasting, nutrient-rich treats. |
| Urinary Tract Disease Diets | These are commercial diets that are specifically formulated to promote urinary health and reduce the risk of urinary tract infections and other urinary problems. |
| Renal Diets | These are specialized pet foods formulated to support the health of pets with kidney disease or renal insufficiency. |
| Digestive Sensitivity Diets | Digestive-sensitive diets are specially formulated to meet the nutritional needs of pets with digestive issues such as food intolerances, allergies, and sensitivities. These diets are designed to be easily digestible and to reduce the symptoms of digestive problems in pets. |
| Oral Care Diets | Oral care diets for pets are specially formulated diets produced to promote oral health and hygiene in pets. |
| Grain-Free Pet Food | Pet food that does not contain common grains like wheat, corn, or soy. Grain-free diets are often preferred by pet owners seeking alternative options or if their pets have specific dietary sensitivities. |
| Premium Pet Food | High-quality pet food formulated with superior ingredients often offers additional nutritional benefits compared to standard pet food. |
| Natural Pet Food | Pet food made from natural ingredients, with minimal processing and without artificial preservatives. |
| Organic Pet Food | Pet food is produced using organic ingredients, free from synthetic pesticides, hormones, and genetically modified organisms (GMOs). |
| Extrusion | A manufacturing process used to produce dry pet food, where ingredients are cooked, mixed, and shaped under high pressure and temperature. |
| Other Pets | Other pets include birds, fish, rabbits, hamsters, ferrets, and reptiles. |
| Palatability | The taste, texture, and aroma of pet food influence its appeal and acceptance by pets. |
| Complete and Balanced Pet Food | Pet food that provides all essential nutrients in appropriate proportions to meet the nutritional needs of pets without additional supplementation. |
| Preservatives | These are the substances that are added to pet food to extend its shelf life and prevent spoilage. |
| Nutraceuticals | Food products that offer health benefits beyond basic nutrition, often contain bioactive compounds with potential therapeutic effects. |
| Probiotics | Live beneficial bacteria that promote a healthy balance of gut flora, supporting digestive health and immune function in pets. |
| Antioxidants | Compounds that help neutralize harmful free radicals in the body, promoting cellular health and supporting the immune system in pets. |
| Shelf-Life | The duration of which pet food remains safe and nutritionally viable for consumption after its production date. |
| Prescription diet | Specialized pet food formulated to address specific medical conditions under veterinary supervision. |
| Allergen | A substance that can cause allergic reactions in some pets, leading to food allergies or sensitivities. |
| Canned food | Wet pet food that is packed in cans and contains higher moisture content than dry food. |
| Limited ingredient diet (LID) | Pet food formulated with a reduced number of ingredients to minimize potential allergens. |
| Guaranteed Analysis | The minimum or maximum levels of certain nutrients present in pet food. |
| Weight management | Pet food designed to help pets maintain a healthy weight or support weight loss efforts. |
| Other Nutraceuticals | It includes prebiotics, antioxidants, digestive fiber, enzymes, essential oils and herbs. |
| Other Veterinary Diets | It includes weight management diets, skin and coat health, cardiac care, and joint care. |
| Other Treats | It includes rawhides, mineral blocks, lickables, and catnips. |
| Other Dry Foods | It includes cereal flakes, mixers, meal toppers, freeze-dried foods, and air-dried foods. |
| Other Animals | It includes birds, fish, reptiles, and small animals (rabbits, ferrets, hamsters). |
| Other Distribution Channels | It includes veterinary clinics, local unregulated stores, and feed and farm stores. |
| Proteins and Peptides | Proteins are large molecules composed of basic units called amino acids which help in the growth and development of pets. Peptides are the short string of 2 to 50 amino acids. |
| Omega-3 fatty acids | Omega-3 fatty acids are essential polyunsaturated fats that play a crucial role in the overall health and well-being of Pets |
| Vitamins | Vitamins are the essential organic compounds that are essential for vital physiological functioning. |
| Minerals | Minerals are naturally occurring inorganic substances that are essential for various physiological functions in pets. |
| CKD | Chronic Kidney Disease |
| DHA | Docosahexaenoic Acid |
| EPA | Eicosapentaenoic Acid |
| ALA | Alpha-linolenic Acid |
| BHA | Butylated Hydroxyanisol |
| BHT | Butylated Hydroxytoluene |
| FLUTD | Feline Lower Urinary Tract Disease |


Research Methodology
Mordor Intelligence follows a four-step methodology in all our reports.
- Step-1: IDENTIFY KEY VARIABLES: In order to build a robust forecasting methodology, the variables and factors identified in Step-1 are tested against available historical market numbers. Through an iterative process, the variables required for market forecast are set and the model is built on the basis of these variables.
- Step-2: Build a Market Model: Market-size estimations for the forecast years are in nominal terms. Inflation is not a part of the pricing, and the average selling price (ASP) is kept constant throughout the forecast period.
- Step-3: Validate and Finalize: In this important step, all market numbers, variables and analyst calls are validated through an extensive network of primary research experts from the market studied. The respondents are selected across levels and functions to generate a holistic picture of the market studied.
- Step-4: Research Outputs: Syndicated Reports, Custom Consulting Assignments, Databases & Subscription Platforms


