US Pet Treats Market Size and Share
Market Overview
| Study Period | 2021 - 2031 |
|---|---|
| Forecast Data Period | 2026 - 2031 |
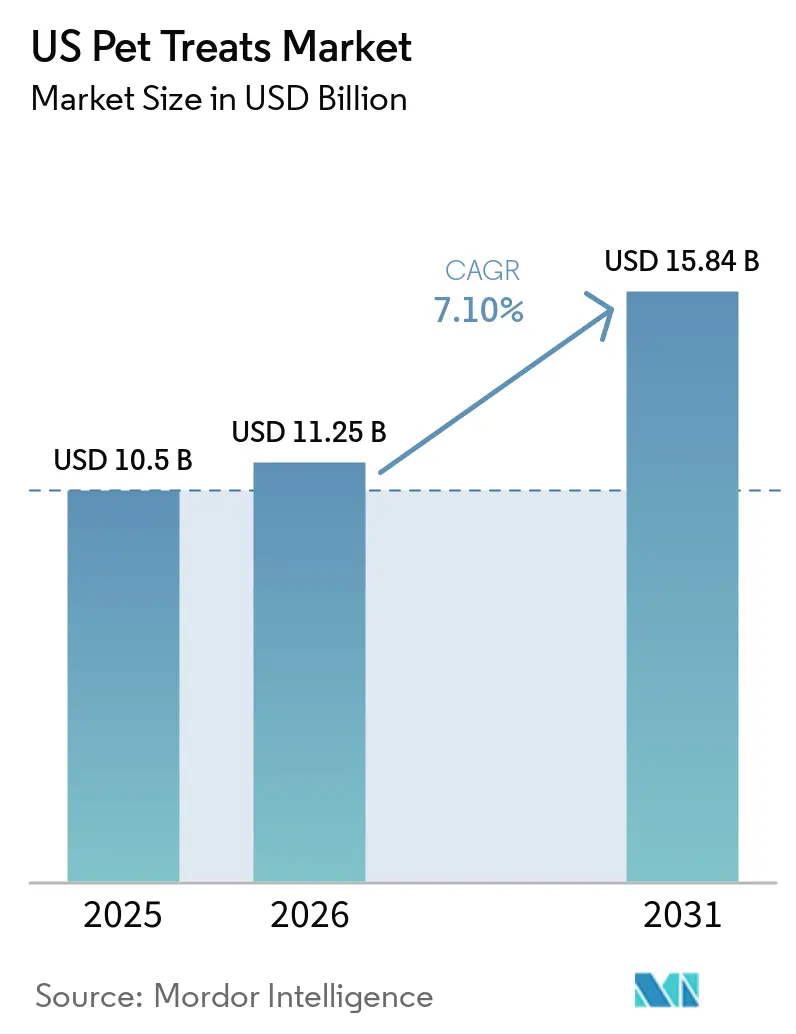
| Base Year Market Size (2025) | USD 10.5 Billion |
| Market Size (2026) | USD 11.25 Billion |
| Market Size (2031) | USD 15.84 Billion |
| Growth Rate (2026 - 2031) | 7.10% CAGR |
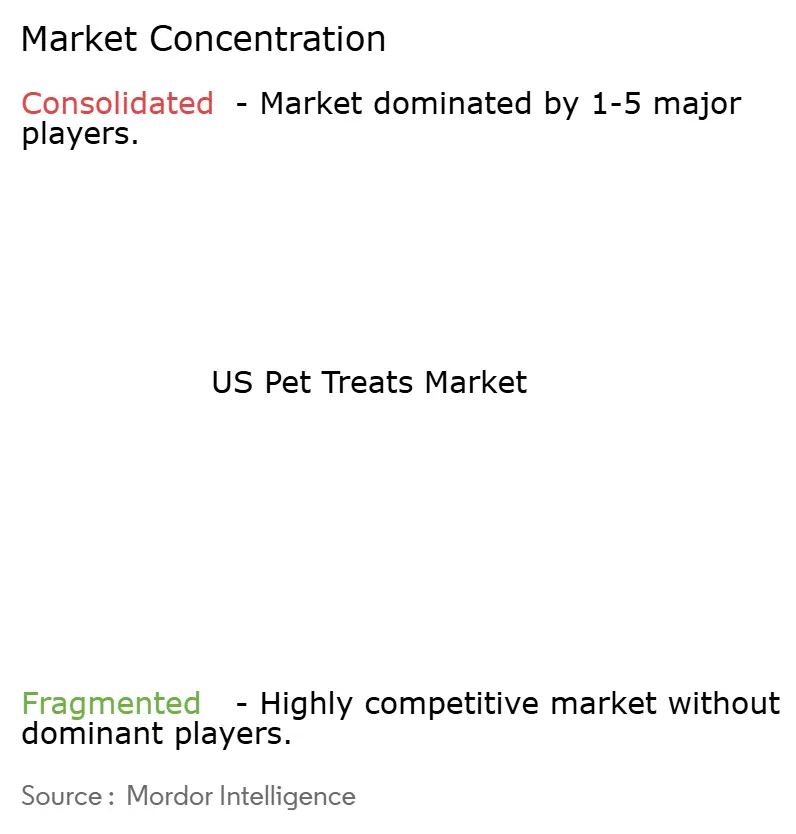
| Market Concentration | Medium |
Major Players *Disclaimer: Major Players sorted in no particular order Image © Mordor Intelligence. Reuse requires attribution under CC BY 4.0. | |
US Pet Treats Market Analysis by Mordor Intelligence
The US pet treats market size was valued at USD 10.50 billion in 2025 and estimated to grow from USD 11.25 billion in 2026 to reach USD 15.84 billion by 2031, at a CAGR of 7.10% during the forecast period (2026-2031). The US pet treats market is growing as treats have become a regular component of pet care rather than an occasional purchase. This trend is closely linked to the increasing humanization of pets across U.S. households. According to the American Pet Products Association, the broader U.S. pet industry has experienced significant growth, with 95 million households owning at least one pet, driving consistent demand for pet treats in everyday scenarios. The market is also influenced by rising demand for products featuring premium ingredients, dental care benefits, calming support, and digital replenishment options. These factors are steering growth toward products that encourage repeat purchases and support higher price points. The market is evolving at two distinct speeds. Premium and functional product lines are growing faster, while demand for undifferentiated value and indulgent products is softening due to budget constraints. Market competition remains moderate. However, regulatory scrutiny is increasing, with the Association of American Feed Control Officials, labeling requirements, and Food and Drug Administration oversight of therapeutic and cannabidiol claims raising compliance standards for both established players and emerging brands in the US pet treats market.
Key Report Takeaways
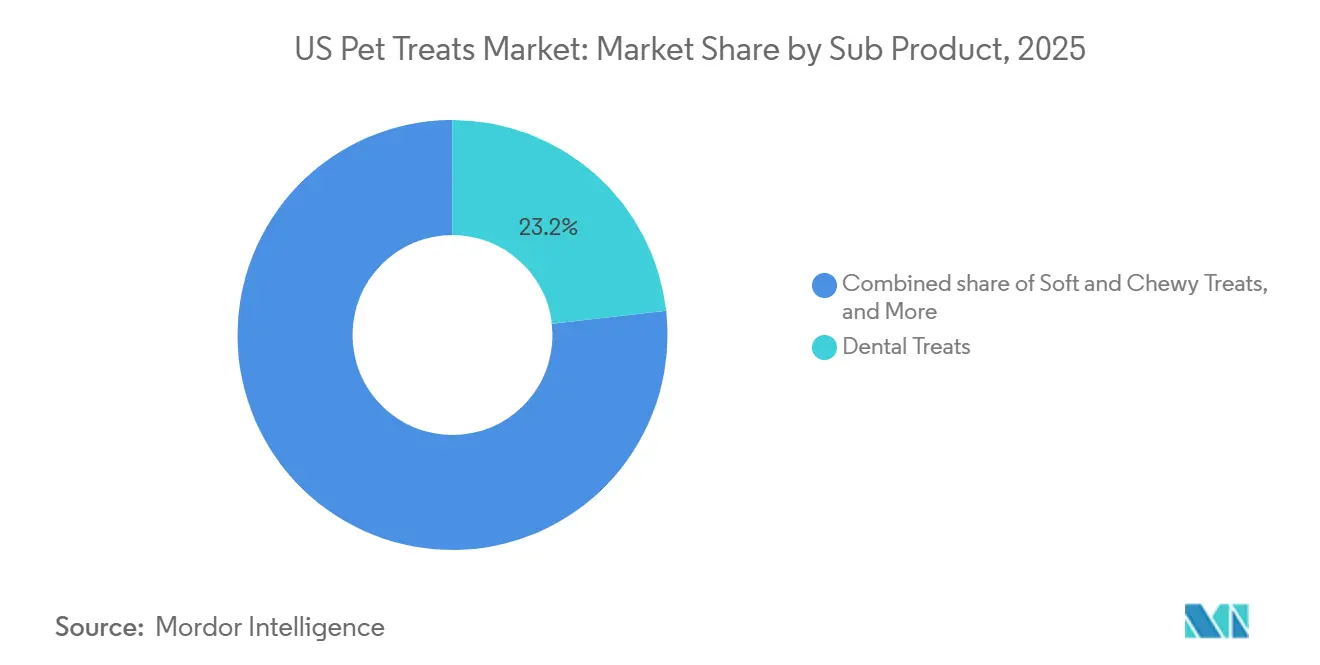
- By product type, Dental Treats were the largest segment, accounting for 23.2% of the United States pet treats market share in 2025, while Freeze-Dried and Jerky Treats were the fastest-growing segment, with an 8.5% CAGR from 2026-2031.
- By pet type, Dogs were the largest segment, accounting for 55% of the United States pet treats market share in 2025, while Cats were the fastest-growing segment, with a 11.2% CAGR from 2026 to 2031.
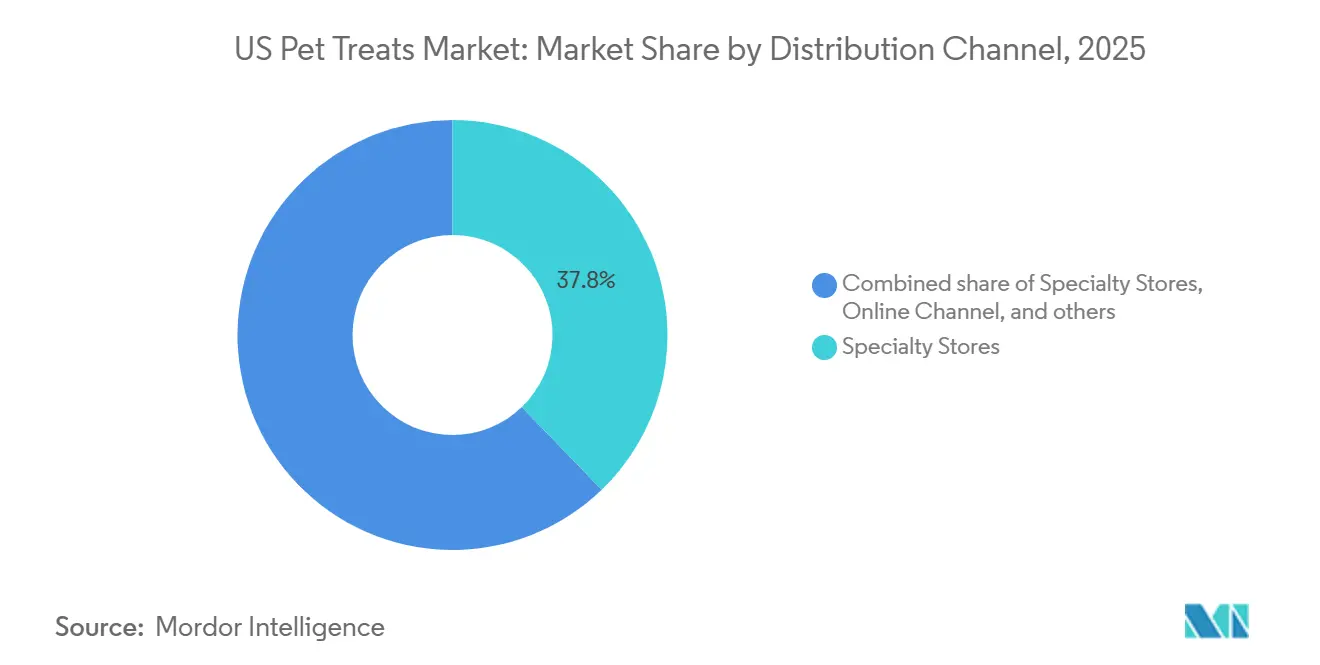
- By distribution channel, Specialty Pet Stores were the largest segment, accounting for 37.8% of the United States pet treats market in 2025, while the Online Channel was the fastest-growing segment, with an 8.8% CAGR from 2026-2031.
Note: Market size and forecast figures in this report are generated using Mordor Intelligence’s proprietary estimation framework, updated with the latest available data and insights as of 2026.
US Pet Treats Market Trends and Insights
Drivers Impact Analysis*
| Driver | (~) % Impact on CAGR Forecast | Geographic Relevance | Impact Timeline |
|---|---|---|---|
| Premiumization and natural ingredient demand | +1.8% | National, with stronger demand in the West, Northeast, and urban South, where premium pet care spending is higher | Medium term (2-4 years) |
| Functional wellness and dental treat adoption | +1.5% | National, with the strongest pull in the West and Northeast, where health-led pet purchases are more developed | Medium term (2-4 years) |
| Rising cat ownership and cat-focused treat demand | +1.2% | National, especially in metro and suburban markets with stronger Gen Z and Millennial household formation | Short term (≤ 2 years) |
| Online autoship and recurring digital purchasing | +1.0% | National, with early concentration in Western and Northeastern metro areas, where digital pet retail is more mature | Short term (≤ 2 years) |
| Expansion of United States freeze-dried manufacturing capacity | +0.7% | National, supported by Midwest and South production hubs serving broad retail and e-commerce networks | Long term (≥ 4 years) |
| United States made and transparent sourcing preference | +0.5% | National, with higher relevance in premium specialty stores and online channels | Medium term (2-4 years) |
| Source: Mordor Intelligence | |||
Premiumization and Natural Ingredient Demand
The US pet treats market continues to benefit from pet owners moving toward natural, premium, and cleaner-label products, even while household budgets remain selective. The American Pet Products Association reported that the share of dog owners buying premium food rose by 5% from 2023 to 2024, while the share buying basic food fell by 7%, which shows that trade-up behavior remains durable in pet care[1]Source: American Pet Products Association, “The American Pet Products Association Releases 2025 State of the Industry Report,” American Pet Products Association, americanpetproducts.org. In the US pet treats market, that preference is becoming more specific, as buyers seek named proteins, limited-ingredient recipes, and human-grade processing rather than paying more for brand recognition alone. Millennials and Gen Z owners also show an 18 to 20% higher likelihood of owning multiple pets, which increases repeat treat purchasing and supports premium basket growth across dog and cat households. Ingredient transparency now serves as a basic purchase filter in the pet specialty channel, meaning brands without clear sourcing and formula communication face a weaker position in the US pet treats market.
Functional Wellness and Dental Treat Adoption
The US pet treats market is moving closer to routine wellness because dental, digestive, joint, and immune-related positioning is pushing treats into daily care habits. The Veterinary Oral Health Council (VOHC) accepted products list has become an important commercial screening tool, giving dental treats with recognized efficacy stronger shelf appeal in both stores and e-commerce. This demand is also being reinforced by veterinary connectivity, as Chewy stated in its fiscal 2024 finanacials that around 17,000 veterinary practices were enrolled in PracticeHub as of February 2025, which linked a large share of clinics to its digital pet care ecosystem. Nulo used this direction in 2024 when it launched a functional jerky treat and dental chew line with premium meat content, a BC30 probiotic, and targeted benefits such as mobility and gut health. Mars also strengthened this space in 2025 with GREENIES Canine Dental Check, an artificial intelligence (AI) tool tied to veterinary technician consultation, which shows how the US pet treats market is increasingly linking product sales with health monitoring and service layers.
Rising Cat Ownership and Cat-Focused Treat Demand
The US pet treats market is getting a clear boost from stronger cat ownership, widening demand beyond its long-standing dog-heavy base. The American Pet Products Association stated that cat ownership reached 39% of U.S. households, or 53 million households, in 2025, up 5% year over year. It also reported that the share of homes with 3 or more cats rose by 36% from 2018 to 2024, which increases treat frequency and volume per household. Another important shift is behavioral, as the share of cat owners using training treats reached 35% after a 30% increase from 2018 to 2024, which creates more routine use occasions for treats. This is why cat-specific lickable, puree, and soft formats are attracting more investment in the US pet treats market, and why the category is no longer growing solely through dog-oriented innovation.
Online Autoship and Recurring Digital Purchasing
The US pet treats market is also gaining support from autoship and recurring online purchasing, which reduces friction in replenishment-heavy categories. Autoship, subscriptions, and online replenishment are reducing purchase friction for everyday categories, and that is improving repeat purchase behavior in the US pet treats market. In the US pet treats market, this channel shift matters because larger basket sizes, personalized recommendations, and preset delivery schedules all support higher purchasing frequency. The J.M. Smucker Company also reported that Milk-Bone e-commerce grew 14% in the latest 13-week period, confirming that even legacy brands are increasingly dependent on recurring digital demand.
Restraints Impact Analysis*
| Restraint | (~) % Impact on CAGR Forecast | Geographic Relevance | Impact Timeline |
|---|---|---|---|
| Inflation-driven trade down in discretionary treats | -1.0% | National, with the strongest effect in the South and Midwest where value-led buying is more common | Short term (≤ 2 years) |
| Association of American Feed Control Officials label modernization compliance burden | -0.4% | National, most acute for smaller manufacturers selling across multiple state registrations | Medium term (2-4 years) |
| Food and Drug Administration scrutiny of therapeutic and cannabidiol-style claims | -0.3% | National, especially in calming, functional, and natural treat niches | Short term (≤ 2 years) |
| Food safety and recall exposure in raw and freeze-dried formats | -0.5% | National, with the strongest operational effect in raw and freeze-dried subcategories | Medium term (2-4 years) |
| Source: Mordor Intelligence | |||
Association of American Feed Control Officials (AAFCO) Label Modernization Compliance Burden
The US pet treats market is also dealing with higher compliance costs as the Association of American Feed Control Officials (AAFCO) Pet Food Label Modernization rules move through implementation. The updated framework took effect on January 1, 2024, and requires changes such as a mandatory purpose statement at the bottom of the principal display panel and standardized formatting alongside net quantity language[2]Source: Association of American Feed Control Officials, “AAFCO to Host Labeling Workshop at Petfood Forum,” Association of American Feed Control Officials, aafco.org. Even with multi-year enforcement discretion in many states, manufacturers selling across several jurisdictions still face different timing and review conditions, which complicates packaging transitions. The Association of American Feed Control (AAFCO) held dedicated labeling workshops in 2025 to support manufacturers, indicating that the learning curve remains significant for the sector. In the US pet treats market, the result is higher label review expenses, slower product launch cycles, and greater strain on smaller players without large in-house regulatory teams.
Food and Drug Administration Scrutiny of Therapeutic and Cannabidiol-Style Claims
The US pet treats market is seeing tighter oversight around therapeutic and cannabidiol-style positioning, especially in calming and other functional subcategories. The Food and Drug Administration issued warning letters in April 2025 to companies marketing cannabidiol-containing pet products with disease-treatment claims, signaling that claim boundaries are being enforced more actively[3]Source: U.S. Food and Drug Administration, “Holista LLC dba HolistaPet Warning Letter 699082-04072025,” U.S. Food and Drug Administration, fda.gov. This matters because calming, stress support, joint support, and digestive benefits are among the faster-moving areas of the US pet treats market. Brands, therefore, need stronger substantiation and more careful language to avoid crossing from structure-function positioning into drug-like claims. The effect is likely to be a slower rollout for some functional products and higher legal and formulation review costs for companies that want to stay active in the most attractive benefit niches.
*Our forecasts treat driver/restraint impacts as directional, not additive. The impact forecasts reflect baseline growth, mix effects, and variable interactions.
Segment Analysis
By Product Type: Dental Treats Anchor Volume as Freeze-Dried Accelerates
Dental Treats captured 23.2% of the US pet treats market share in 2025, making them the largest product type by value. Their position is supported by growing owner awareness of oral health and by the role of recognized efficacy screens, such as the accepted products list maintained by the Veterinary Oral Health Council. This gives the segment a stronger daily-use case than purely indulgent formats because owners can justify repeat purchase as part of regular care. Crunchy Biscuits and Cookies still hold broad volume, especially in value and private-label assortments distributed through grocery and mass channels. Soft and Chewy Treats also remain important because they fit training, reward, and convenience-led use cases across both dog and cat households.
Freeze-Dried and Jerky Treats are the fastest-growing product type, and this segment of the US pet treats market is projected to expand at a 8.5% CAGR from 2026 to 2031. The category is being helped by capacity additions such as PetSource by Scoular’s 2024 Seward expansion and Muenster Milling’s 2024 Denton facility, both of which increased domestic production readiness for premium treat formats. That is lowering barriers for brands that want raw-adjacent positioning without carrying the same earlier supply constraints. Jerky and Meat Treats remain relevant because they fit high-protein and ingredient-forward demand. Rawhide and other long-lasting chew formats still matter in the US pet treats industry, but growth has moderated as consumers shift toward digestible alternatives with cleaner ingredient narratives.


By Pet Type: Dog Segment Dominates but Cat Growth Reshapes Category Investment
Dogs were the largest pet type in the US pet treats market, accounting for 55% of revenue in 2025. That position is supported by the American Pet Products Association figure of 71 million dog-owning households in 2025, which remains the broadest demand base in the category. Adult dogs still anchor volume across most treat formats because they account for the largest installed base and the widest range of routine use occasions. At the same time, age-based targeting within dog treats is becoming increasingly important, especially for senior dogs, who drive demand for mobility, weight management, and softer dental formats. This keeps dogs central to scale economics across the US pet treats industry, even as growth shifts toward more specialized formulas.
Cats are the fastest pet type in the US pet treats market, advancing at an 11.2% CAGR from 2026 to 2031. Growth is tied to rising cat household penetration, stronger multi-cat ownership, and a broader change in how owners interact with cats through training and bonding. This shift is widening the role of lickable, puree, and soft formats, which are better suited to routine cat engagement than traditional biscuit formats. Other pets, including small mammals, birds, reptiles, and amphibians, remain a small segment but are showing early momentum in household formation. The segment is still underdeveloped, but it gives the US pet treats market a small future white space for targeted product development beyond dogs and cats.
By Distribution Channel: Digital Autoship Reshapes the Specialty Store Lead
Specialty Pet Stores were the largest distribution channel, accounting for 37.8% of revenue in 2025, reflecting their role in curated assortments, staff guidance, and premium product discovery in the US pet treats market. These stores remain important for premium, natural, and functional lines because they can explain ingredient claims and encourage trial of newer formats. They also provide stronger support for attachment purchases around grooming, veterinary services, and broader pet care baskets. That keeps specialty retail relevant even as digital adoption rises. Supermarkets and Hypermarkets continue to drive scale in value and mid-tier formats, especially legacy dog biscuits, training treats, and private-label lines.
The Online Channel is the fastest-growing distribution segment, and this segment of the US pet treats market is projected to grow at an 8.8% CAGR from 2026 to 2031. Autoship, personalized recommendations, and larger home-delivery pack sizes are changing how repeat-purchase categories perform in the US pet treats industry. General Mills stated in 2026 that e-commerce drives the majority of category growth in its pet portfolio, which supports the view that digital is shaping product mix as much as channel mix. Veterinary Clinics remain small in volume but important for dental and therapeutic-adjacent positioning, while Farm and Feed Stores hold regional relevance in the South and Midwest. Convenience Stores and other smaller channels add impulse demand, but they have limited room to drive premiumization because their assortments are narrower.
Geography Analysis
The South was the largest region and held 29% of the US pet treats market share in 2025. Its scale reflects high pet ownership density, broad retail access, and strong distribution through grocery, mass, and value-led channels. Dog ownership is especially important in this region, which supports steady volume for dental chews, jerky treats, and long-lasting chew formats. Private-label products are also more established here, which helps total volume but limits premium mix expansion for some branded suppliers. Farm and Feed Stores still matter in parts of the South because they give regional suppliers access outside the pet specialty network.
The West is the fastest-growing region, and this part of the US pet treats market is projected to grow at a 5.6% CAGR from 2026 to 2031. States such as California, Washington, and Colorado have a stronger base of younger, higher-income owners who spend more on natural, functional, and freeze-dried formats. The region also has deeper penetration of direct-to-consumer and subscription purchasing, which aligns well with the broader digital shift in the category. This makes the West an important testing ground for premium formulas and new delivery formats. Functional ingredients such as postbiotics, adaptogens, and marine-derived omega products also appear earlier in Western assortments than in more value-led regions.
The Northeast combines dense urban demand with strong willingness to pay for clean-label and transparent-sourcing propositions, which supports premium specialty and e-commerce performance in the US pet treats market. Buyers in this region tend to respond well to ingredient detail, sourcing clarity, and wellness positioning, which create favorable conditions for premium brands to improve their mix. The Midwest sits closer to the middle of the national profile because dog ownership is solid, but spending behavior is more value-conscious than in the Northeast or West. That favors crunchy biscuits, mainstream dog treats, and private-label dental chews across large-format retail. The J.M. Smucker Company’s Milk-Bone manufacturing network in Buffalo, New York, Alabama, and Lawrence, Kansas, provides the company with strong supply access to both Midwest and Southern demand centers.
Competitive Landscape
The US pet treats market is highly consolidated, with the top 5 players accounting for a significant share in 2025, while the remaining share is spread across more than 200 active stock-keeping units, ranging from regional natural brands to direct-to-consumer specialists. Mars, Nestlé S.A. through Purina, and The J.M. Smucker Company form the core leadership group, and together they account for around 45% of the top 5 combined share across dog, cat, and dental formats. Their scale gives them an edge in distribution, portfolio breadth, and brand familiarity across both mainstream and premium-adjacent price tiers. At the same time, the category is not closed to challengers, as growth is accelerating in premium and functional segments more than in standard-value formats. That leaves room for smaller players to gain shelf space where they can show stronger ingredient credibility or more specialized benefit positioning.
Mars has continued to support its lead in the US pet treats market through brand and capacity investment. In 2025, the company launched GREENIES Canine Dental Check, an artificial intelligence-enabled monitoring tool tied to veterinary technician consultations, extending the brand beyond simple product use. In 2026, Mars also completed a CAD 180 million (USD 133 million) investment across its Ontario manufacturing network, which increased TEMPTATIONS cat treat output by 50% and expanded Royal Canin capacity. Nestlé Purina strengthened brand visibility in 2025 through its partnership with the U.S. Soccer Federation, which covered treats, pet food, supplements, and litter through 2030. The J.M. Smucker Company also announced a USD 52.6 million upgrade of its Milk-Bone facility in Buffalo in 2025, with a focus on new processing equipment for Soft 'N Chewy formats and cold storage expansion.
US Pet Treats Industry Leaders
Colgate-Palmolive Company (Hill's Pet Nutrition Inc.)
General Mills Inc.
Mars Incorporated
Nestle (Purina)
The J. M. Smucker Company
- *Disclaimer: Major Players sorted in no particular order

Recent Industry Developments
- February 2026: Pet Honesty launched Brush Buddies, a cellulose-free daily dental treat for dogs produced at an FDA-registered US manufacturing facility, incorporating a patent-pending shape and texture, clinically studied postbiotics, kelp, parsley, and mint to support plaque control, gum health, and oral microbiome balance.
- January 2026: Dinovite (Compana Pet Brands) launched Triple Action Dental Chews for dogs, featuring a clinically studied postbiotic demonstrating an average 85% reduction in odor-causing compounds and up to 98% disruption of plaque-forming biofilms in ingredient-level studies, expanding Compana's footprint in the functional dental segment.
- August 2025: Nestlé S.A. (Purina) became the first-ever Official Pet Care Partner of the US Soccer Federation in a multi-year deal through 2030, granting exclusive rights across pet food, treats, supplements, and litter. The partnership included retail promotions, co-branded merchandise, on-site adoption events, and a permanent pet presence at the new US Soccer National Training Center in Atlanta.


US Pet Treats Market Report Scope
Crunchy Treats, Dental Treats, Freeze-dried and Jerky Treats, Soft & Chewy Treats are covered as segments by Sub Product. Cats, Dogs are covered as segments by Pets. Convenience Stores, Online Channel, Specialty Stores, Supermarkets/Hypermarkets are covered as segments by Distribution Channel.| Dental Treats |
| Crunchy Treats |
| Soft & Chewy Treats |
| Freeze-dried and Jerky Treats |
| Other Treats |
| Dogs |
| Cats |
| Other Pets |
| Supermarkets/Hypermarkets |
| Specialty Stores |
| Convenience Stores |
| Online Channel |
| Other Channels |
| Product | Dental Treats |
| Crunchy Treats | |
| Soft & Chewy Treats | |
| Freeze-dried and Jerky Treats | |
| Other Treats | |
| Pet Type | Dogs |
| Cats | |
| Other Pets | |
| Distribution Channel | Supermarkets/Hypermarkets |
| Specialty Stores | |
| Convenience Stores | |
| Online Channel | |
| Other Channels |


Market Definition
- FUNCTIONS - Pet foods are usually intended to provide complete and balanced nutrition to the pet but are primarily used as functional products. The scope includes the food and supplements consumed by pets including veterinary diets. Supplements/nutraceuticals that are directly supplied to pets are considered within the scope.
- RESELLERS - Companies engaged in reselling of pet food without value addition have been excluded from the market scope, in order to avoid double counting.
- END CONSUMERS - Pet owners are considered to be the end-consumers in the market studied.
- DISTRIBUTION CHANNELS - Supermarkets/hypermarkets, specialty stores, convenience stores, online channels and other channels are considered within the scope. The stores which are exclusively providing pet related basic and custom products are considered within the scope of specialty stores.
| Keyword | Definition |
|---|---|
| Pet Food | The scope of pet food includes the food that is eatable by pets including food, treats, veterinary diets, and nutraceuticals/supplements. |
| Food | Food is animal feed intended for consumption by pets. It is formulated to provide essential nutrients and meet the dietary needs of various types of pets, including dogs, cats, and other animals. These are generally segmented into dry and wet pet foods. |
| Dry Pet Food | Dry pet foods may be extruded/baked (kibbles) or flaked. They have a lower moisture content, typically around 12-20%. |
| Wet Pet Food | Wet pet food, also known as canned pet food or moist pet food, generally has a higher moisture content compared to dry pet food, often ranging from 70-80%. |
| Kibbles | Kibbles are dry, processed pet food in small, bite-sized pieces or pellets. They are specifically formulated to provide balanced nutrition for various domestic animals, such as dogs, cats, and other animals. |
| Treats | Pet Treats are special food items or rewards given to pets, to show affection, and encourage good behavior. They are especially used during training. Pet treats are made from various combinations of meat or meat-derived materials with other ingredients. |
| Dental Treats | Pet dental treats are specialized treats that are formulated to promote good oral hygiene in pets. |
| Crunchy Treats | It is a type of pet treat that has a firm and crispy texture which can be a good source of nutrition for pets. |
| Soft and chewy treats | Soft and Chewy pet treats are a type of pet food product that is formulated to be easy to chewy and digest. They are usually made from soft and pliable ingredients, such as meat, poultry, or vegetables, that have been blended and formed into bite-sized pieces or strips. |
| Freeze-dried & Jerky Treats | Freeze-dried and jerky treats are snacks given to pets, that are prepared through a special preservation process, without damaging the nutritional content, resulting in long-lasting, nutrient-rich treats. |
| Urinary Tract Disease Diets | These are commercial diets that are specifically formulated to promote urinary health and reduce the risk of urinary tract infections and other urinary problems. |
| Renal Diets | These are specialized pet foods formulated to support the health of pets with kidney disease or renal insufficiency. |
| Digestive Sensitivity Diets | Digestive-sensitive diets are specially formulated to meet the nutritional needs of pets with digestive issues such as food intolerances, allergies, and sensitivities. These diets are designed to be easily digestible and to reduce the symptoms of digestive problems in pets. |
| Oral Care Diets | Oral care diets for pets are specially formulated diets produced to promote oral health and hygiene in pets. |
| Grain-Free Pet Food | Pet food that does not contain common grains like wheat, corn, or soy. Grain-free diets are often preferred by pet owners seeking alternative options or if their pets have specific dietary sensitivities. |
| Premium Pet Food | High-quality pet food formulated with superior ingredients often offers additional nutritional benefits compared to standard pet food. |
| Natural Pet Food | Pet food made from natural ingredients, with minimal processing and without artificial preservatives. |
| Organic Pet Food | Pet food is produced using organic ingredients, free from synthetic pesticides, hormones, and genetically modified organisms (GMOs). |
| Extrusion | A manufacturing process used to produce dry pet food, where ingredients are cooked, mixed, and shaped under high pressure and temperature. |
| Other Pets | Other pets include birds, fish, rabbits, hamsters, ferrets, and reptiles. |
| Palatability | The taste, texture, and aroma of pet food influence its appeal and acceptance by pets. |
| Complete and Balanced Pet Food | Pet food that provides all essential nutrients in appropriate proportions to meet the nutritional needs of pets without additional supplementation. |
| Preservatives | These are the substances that are added to pet food to extend its shelf life and prevent spoilage. |
| Nutraceuticals | Food products that offer health benefits beyond basic nutrition, often contain bioactive compounds with potential therapeutic effects. |
| Probiotics | Live beneficial bacteria that promote a healthy balance of gut flora, supporting digestive health and immune function in pets. |
| Antioxidants | Compounds that help neutralize harmful free radicals in the body, promoting cellular health and supporting the immune system in pets. |
| Shelf-Life | The duration of which pet food remains safe and nutritionally viable for consumption after its production date. |
| Prescription diet | Specialized pet food formulated to address specific medical conditions under veterinary supervision. |
| Allergen | A substance that can cause allergic reactions in some pets, leading to food allergies or sensitivities. |
| Canned food | Wet pet food that is packed in cans and contains higher moisture content than dry food. |
| Limited ingredient diet (LID) | Pet food formulated with a reduced number of ingredients to minimize potential allergens. |
| Guaranteed Analysis | The minimum or maximum levels of certain nutrients present in pet food. |
| Weight management | Pet food designed to help pets maintain a healthy weight or support weight loss efforts. |
| Other Nutraceuticals | It includes prebiotics, antioxidants, digestive fiber, enzymes, essential oils and herbs. |
| Other Veterinary Diets | It includes weight management diets, skin and coat health, cardiac care, and joint care. |
| Other Treats | It includes rawhides, mineral blocks, lickables, and catnips. |
| Other Dry Foods | It includes cereal flakes, mixers, meal toppers, freeze-dried foods, and air-dried foods. |
| Other Animals | It includes birds, fish, reptiles, and small animals (rabbits, ferrets, hamsters). |
| Other Distribution Channels | It includes veterinary clinics, local unregulated stores, and feed and farm stores. |
| Proteins and Peptides | Proteins are large molecules composed of basic units called amino acids which help in the growth and development of pets. Peptides are the short string of 2 to 50 amino acids. |
| Omega-3 fatty acids | Omega-3 fatty acids are essential polyunsaturated fats that play a crucial role in the overall health and well-being of Pets |
| Vitamins | Vitamins are the essential organic compounds that are essential for vital physiological functioning. |
| Minerals | Minerals are naturally occurring inorganic substances that are essential for various physiological functions in pets. |
| CKD | Chronic Kidney Disease |
| DHA | Docosahexaenoic Acid |
| EPA | Eicosapentaenoic Acid |
| ALA | Alpha-linolenic Acid |
| BHA | Butylated Hydroxyanisol |
| BHT | Butylated Hydroxytoluene |
| FLUTD | Feline Lower Urinary Tract Disease |


Research Methodology
Mordor Intelligence follows a four-step methodology in all our reports.
- Step-1: IDENTIFY KEY VARIABLES: In order to build a robust forecasting methodology, the variables and factors identified in Step-1 are tested against available historical market numbers. Through an iterative process, the variables required for market forecast are set and the model is built on the basis of these variables.
- Step-2: Build a Market Model: Market-size estimations for the forecast years are in nominal terms. Inflation is not a part of the pricing, and the average selling price (ASP) is kept constant throughout the forecast period.
- Step-3: Validate and Finalize: In this important step, all market numbers, variables and analyst calls are validated through an extensive network of primary research experts from the market studied. The respondents are selected across levels and functions to generate a holistic picture of the market studied.
- Step-4: Research Outputs: Syndicated Reports, Custom Consulting Assignments, Databases & Subscription Platforms


