Market Overview
| Study Period | 2021 - 2031 |
|---|---|
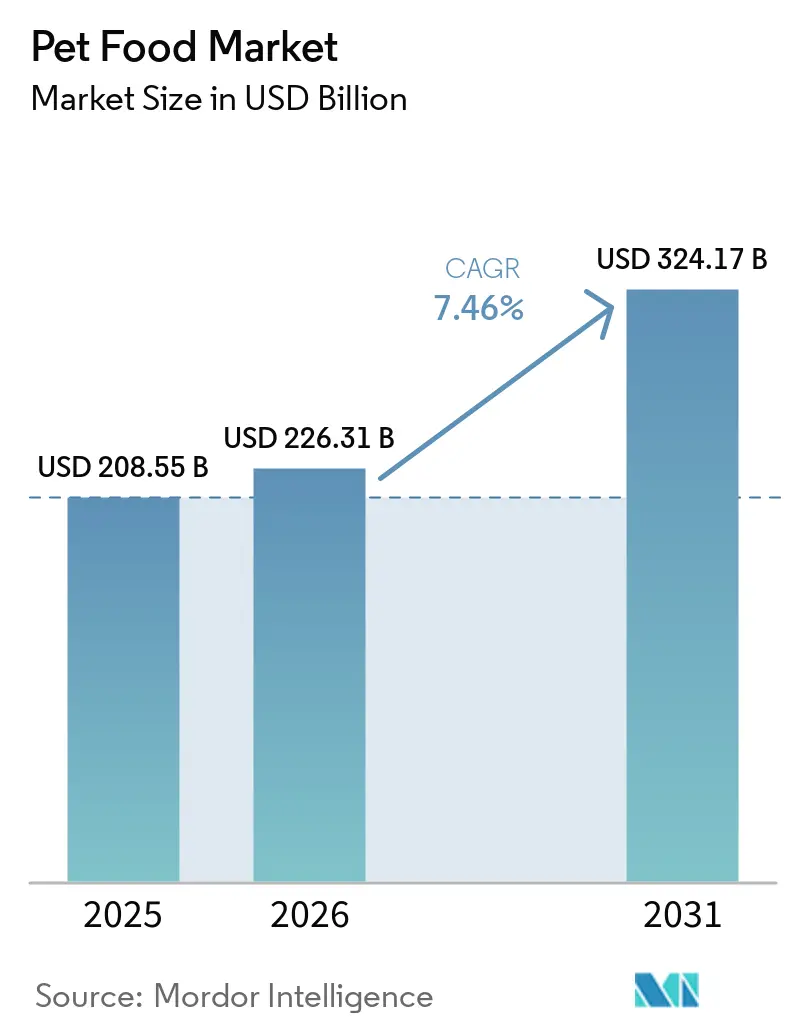
| Market Size (2026) | USD 226.31 Billion |
| Market Size (2031) | USD 324.17 Billion |
| Growth Rate (2026 - 2031) | 7.46% CAGR |
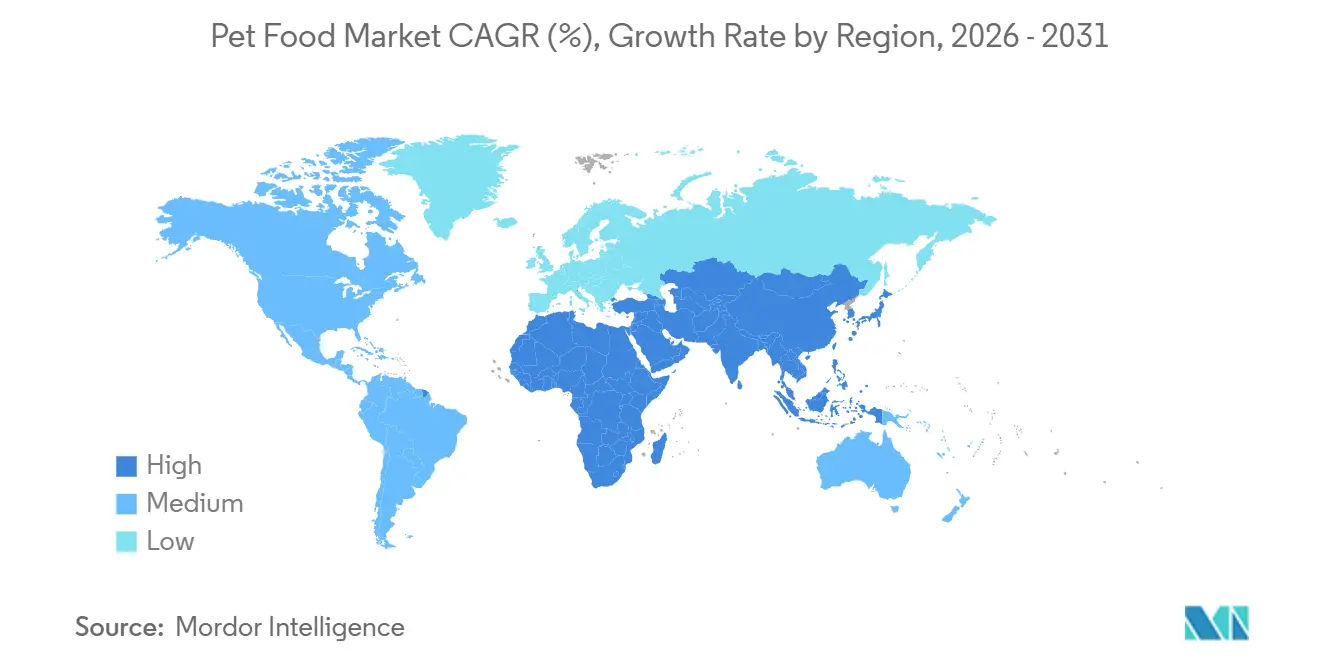
| Fastest Growing Market | Africa |
| Largest Market | North America |
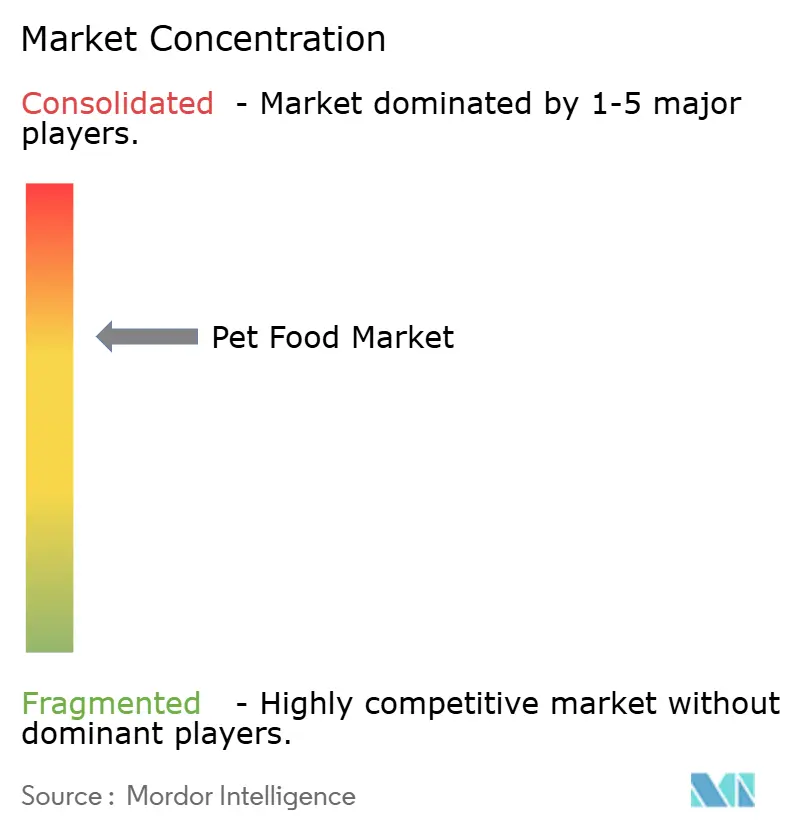
| Market Concentration | Medium |
Major Players *Disclaimer: Major Players sorted in no particular order Image © Mordor Intelligence. Reuse requires attribution under CC BY 4.0. | |
Pet Food Market Analysis by Mordor Intelligence
The pet food market size is anticipated to increase from USD 208.55 billion in 2025 to USD 226.31 billion in 2026 and reach USD 324.17 billion by 2031, growing at a CAGR of 7.46% over 2026-2031. The pet food market continues to expand as pet owners spend more on nutrition that mirrors choices made for household food, especially in premium, functional, and fresh formats. The category remained resilient amid inflationary pressures in 2024 and 2025 because demand from highly engaged pet owners remained firm even as other consumer packaged goods categories slowed. Urban living, delayed parenthood, and rising attention to pet health continue to lift spending per animal across major regions. Competition is also shifting as large manufacturers add capacity, expand fresh and condition-specific offerings, and improve digital access to protect their market share. These changes leave room for growth in premium nutrition, veterinary diets, and online replenishment, while also raising the bar on compliance, sourcing, and operating scale.
Key Report Takeaways
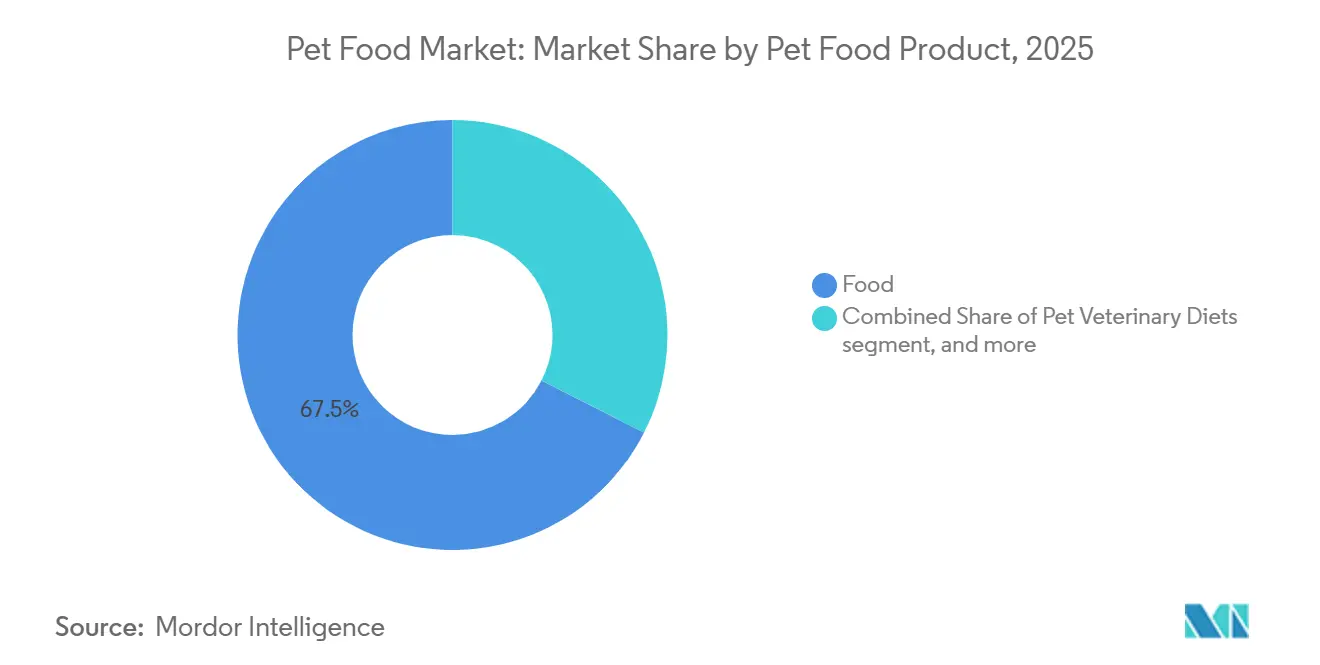
- By pet food product, food was the largest segment, with a 67.5% of the pet food market size in 2025, while pet veterinary diets will be the fastest-growing segment, with a CAGR of 8.7% for 2026-2031.
- By pet type, dogs were the largest segment, accounting for 49.2% of the pet food market share in 2025, while cats will be the fastest-growing segment, with a CAGR of 8.4% for 2026-2031.
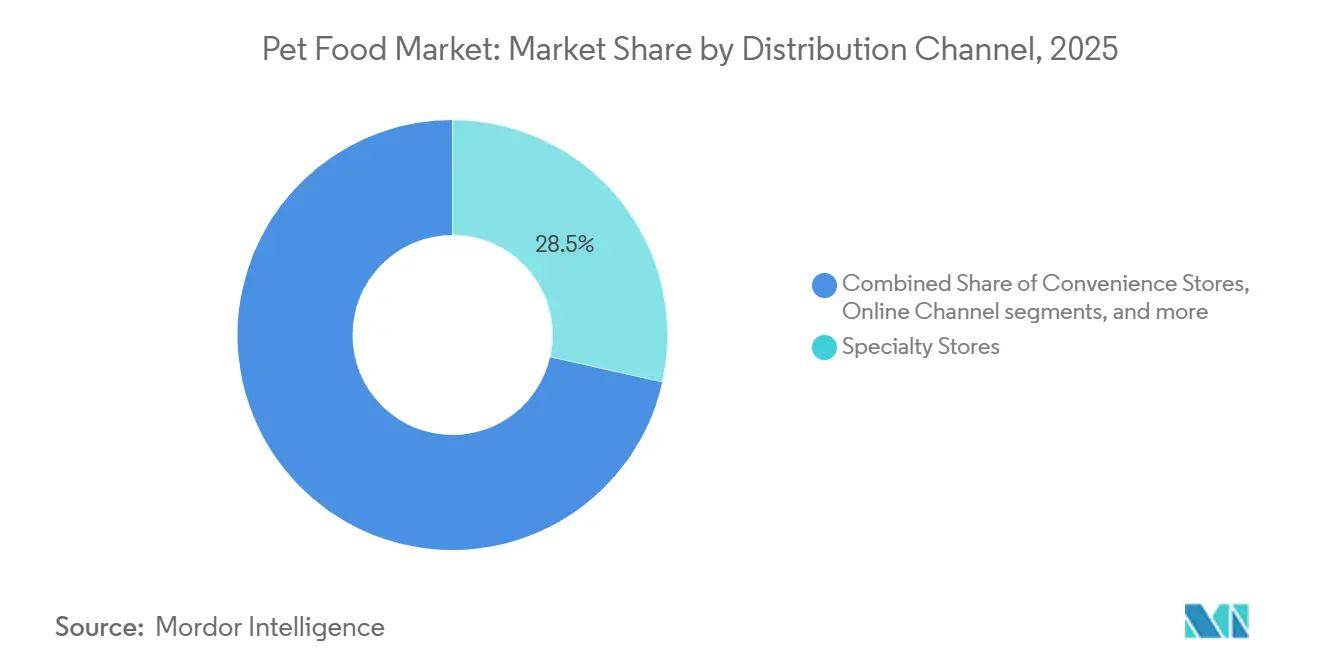
- By distribution channel, specialty stores were the largest segment, with a 28.5% share of the pet food market in 2025, while the online channel is anticipated to grow the fastest, with a CAGR of 9.2% for 2026-2031.
- By geography, North America was the largest regional segment, accounting for 44.1% of the pet food market share in 2025, while Africa is the fastest-growing regional segment, with a CAGR of 8.1% for 2026-2031.
Note: Market size and forecast figures in this report are generated using Mordor Intelligence’s proprietary estimation framework, updated with the latest available data and insights as of 2026.
Global Pet Food Market Trends and Insights
Drivers Impact Analysis*
| Driver | (~) % Impact on CAGR Forecast | Geographic Relevance | Impact Timeline |
|---|---|---|---|
| Pet Humanization Sustaining Premium and Functional Nutrition Demand | +2.00% | Strongest in North America and Europe, with growing pull in Asia-Pacific and Latin America | Long term (≥ 4 years) |
| Veterinary Health Focus Lifting Therapeutic and Condition-Specific Diets | +1.40% | Most visible in North America and Europe, with rising adoption in urban Asia-Pacific markets | Long term (≥ 4 years) |
| Online Auto-Ship and Omnichannel Access Widening Category Reach | +1.10% | Global, led by North America and digitally advanced Asia-Pacific markets | Medium term (2-4 years) |
| Fresh, Minimally Processed, and High-Protein Formats Upgrading Spending | +0.90% | Strongest in North America and Europe, with early expansion in selected Asia-Pacific markets | Medium term (2-4 years) |
| AI-Guided Personalization and Diagnostic-Linked Feeding Programs | +0.50% | Early-stage driver centered in North America, with selective uptake in Asia-Pacific | Long term (≥ 4 years) |
| Novel-Protein Approvals Expanding Formulation Innovation | +0.40% | North America and Europe first, with spillover potential into Asia-Pacific | Medium term (2-4 years) |
| Source: Mordor Intelligence | |||
Pet Humanization Sustaining Premium and Functional Nutrition Demand
Pet humanization remains a significant driver of demand in the pet food market across both mature and emerging regions. In mature markets, the trend has evolved beyond a shift from value to premium products, focusing instead on targeted nutrition with clearer ingredient and health positioning. General Mills reported in 2025 that the fresh pet food category was valued at USD 3 billion and projected to grow to USD 10 billion over the next decade, reflecting a shift in consumer spending toward products resembling household food choices. Similarly, Nestlé S.A. stated in 2026 that cat nutrition was its strongest growth driver within PetCare, with wet cat food contributing to market-share gains in Europe and growth in the Americas. As pet owners increasingly scrutinize product labels and demand greater ingredient transparency, the pet food market is aligning with higher standards for sourcing, transparency, and product claims.
Veterinary Health Focus Lifting Therapeutic and Condition-Specific Diets
Veterinary nutrition is emerging as a significant growth driver in the pet food market, driven by increasing owner concerns about obesity, mobility, digestive health, and age-related issues in pets. Hill's Pet Nutrition expanded its offerings in this segment in January 2025 by introducing new and improved Prescription Diet and Science Diet products, utilizing ActivBiome+ platforms developed through over a decade of microbiome research. In April 2026, Hill's launched Prescription Diet Metabolic + j/d for cats, a product designed to support both weight management and mobility. According to the company, 88% of cats experienced weight loss within two months when fed Metabolic Nutrition alone. This product is notable for addressing two distinct needs, weight management and mobility, in a single formula, potentially improving compliance and increasing basket value. As clinical nutrition products gain wider commercial visibility beyond veterinary channels, the pet food market is attracting a broader base of consumers willing to invest in targeted nutritional solutions.
Online Auto-Ship and Omnichannel Access Widening Category Reach
Digital access is driving repeat purchases and broadening the reach of premium pet food products. Freshpet reported a 43% growth in digital orders in Q1 2026, accounting for 16.1% of its total business, highlighting the increasing integration of online ordering into routine pet feeding. Smucker noted a 14% increase in Milk-Bone e-commerce sales during the 13 weeks ending in February 2026, with the channel accounting for one-third of total dog snack sales. Auto-ship models reduce the likelihood of brand switching, as pet owners typically remain loyal to products once a feeding routine is established. This trend enhances retention for established brands and facilitates the pet food market's shift toward premium and specialty products, which benefit from consistent replenishment.
Novel-Protein Approvals Expanding Formulation Innovation
New ingredient approvals are expanding the range of proteins that companies can use in the pet food market. The Association of American Feed Control Officials (AAFCO) approved a new ingredient review pathway in January 2025 after the end of the earlier Food and Drug Administration arrangement, which created a clearer route for animal food ingredient review[1]Source: Association of American Feed Control Officials, “AAFCO Votes Yes on New Regulatory Pathway for Animal Food Ingredients,” aafco.org. AAFCO also noted in February 2025 that dried mealworm meal, dried crickets, and black soldier fly larvae oil were among the new approved ingredients for adult dogs and cats. This matters because it widens formulation options in treats, specialty diets, and premium products where novel proteins can support differentiation. As ingredient approval pathways become more structured, the pet food market gains more room for product innovation without relying only on traditional meat inputs.
Restraints Impact Analysis*
| Restraint | (~) % Impact on CAGR Forecast | Geographic Relevance | Impact Timeline |
|---|---|---|---|
| Raw Material and Packaging Cost Volatility Constraining Margins | -1.60% | Global issue across protein, packaging, logistics, and energy inputs | Short term (≤ 2 years) |
| Price-Sensitive Trade-Down Limiting Premium Basket Expansion | -1.20% | Global, most visible where premium penetration is still developing | Medium term (2-4 years) |
| Ultra-Processed Food Scrutiny Pressuring Kibble-Centric Portfolios | -0.70% | North America and Europe first, with selective influence elsewhere | Medium term (2-4 years) |
| Mycotoxin and Contamination Recall Exposure Increasing Compliance Costs | -0.40% | Global issue with direct cost and reputation effects | Short term (≤ 2 years) |
| Source: Mordor Intelligence | |||
Raw Material and Packaging Cost Volatility Constraining Margins
Cost pressures remain a significant short-term constraint on profit growth in the pet food market. Freshpet reported in Q1 2026 that it was closely monitoring logistics, packaging, and input costs, highlighting increased fuel expenses and other cost-related impacts. Larger companies can address these challenges through pricing adjustments, formula modifications, and economies-of-scale leveraging. However, smaller manufacturers face limited options when costs rise rapidly. For instance, Purina's new Vargeão facility in Brazil incorporates automation and digital controls and operates entirely on renewable energy, showcasing how major companies are mitigating cost pressures through operational efficiencies. Despite such measures, fluctuations in raw material, packaging, and freight costs continue to hinder margin improvements across the pet food market.
Mycotoxin and Contamination Recall Exposure Increasing Compliance Costs
Food safety events continue to add cost and reputation risk to the pet food market. The Food and Drug Administration advisory page listed pet food contamination and nutrient deficiency alerts in both 2025 and 2026, including issues tied to bacterial contamination and low thiamine [2]Source: U.S. Food and Drug Administration, “Outbreaks and Advisories,”fda.gov . The American Pet Products Association also noted that manufacturers must respond to new regulatory expectations, including changes to ingredient oversight and additional food safety planning requirements [3]Source: American Pet Products Association, “2025 Regulatory Update Part 1, What We Are Watching in the Pet Food Sector,” americanpetproducts.org. Even when an incident affects a small product set, the resulting recall work, retailer response, and testing demands can raise costs across a wider portfolio. This leaves the pet food market with a steady compliance burden that favors larger companies with stronger quality systems and regulatory staff.
*Our forecasts treat driver/restraint impacts as directional, not additive. The impact forecasts reflect baseline growth, mix effects, and variable interactions.
Segment Analysis
By Pet Food Product: Therapeutic and Fresh Formats Reshape Value Distribution
Food was the largest segment, and accounted 67.5% of the pet food market size in 2025, reflecting its role as the daily nutritional base for most companion animals. Wet food is gaining ground in this segment as companies add capacity to meet demand for more premium, palatable formats. Purina invested USD 470 million (BRL 2.5 billion) in its Vargeão wet pet food facility in Brazil in 2026, adding 30,000 metric tons of annual wet capacity and doubling the company's production capacity in the country. Mars, Incorporated also invested USD 72.7 million (AUD 112.5 million) in its Wodonga site in Australia to build a new wet-pouch facility, scheduled to open in June 2026. These moves show that companies still see strong value in staple food formats, but they are shifting that value toward wet, premium, and more specialized nutrition within the pet food industry.
Pet veterinary diets is the fastest-growing product segment, with a 8.7% CAGR for 2026-2031, supported by rising clinical needs and greater owner willingness to pay for targeted outcomes. Hill's Pet Nutrition expanded this space in 2025 with ActivBiome+ product upgrades and the Prescription Diet Metabolic + j/d launch for cats in 2026, which linked mobility and weight support in one formula. Fresh and minimally processed products are also changing the mix, with Freshpet reaching USD 1.10 billion in net sales in 2025 and Royal Canin and ORIJEN entering or expanding in fresh formats in 2025 and 2026 respectively. Pet treats and supplements remain important add-on categories, and the Food and Drug Administration (FDA) and Association of American Feed Control Officials (AAFCO) introduced new animal food ingredient review pathways during 2025 following the expiration of their longstanding memorandum of understanding, creating a more structured route for companies developing novel-protein and functional pet food ingredients.


By Pets: Cat Segment Closing the Gap on Dogs
Dogs were the largest segment, and accounted for 49.2% of the pet food market share in 2025, supported by higher spending per animal and greater premium penetration across food, treats, and fresh formats. Freshpet reported that its United States dog food and treats market share increased to 4.20% in Q1 2026, demonstrating that a focused format strategy can create opportunities even in a competitive category. General Mills also highlighted growth in the dog feeding segment, with Blue Buffalo launching its national fresh entry in 2025 and expanding its broader pet portfolio in the United States. Dogs continue to represent the largest revenue base for the pet food market, particularly in North America, where premium dry, wet, and fresh offerings are well established. Additionally, the segment benefits from stronger consumer attachment to treats, supplements, and condition-specific diets, which contribute to higher household spending.
Cats were the fastest-growing segment, with a CAGR of 8.4% for 2026-2031, and that pace is supported by both company performance and household living patterns. In 2025, Nestlé's PetCare performance showed that cat nutrition outperformed dog nutrition, with wet and dry cat food driving growth across multiple regions. In 2026, J.M. Smucker reported that Meow Mix held an 8% dollar share in the cat food market and highlighted a USD 11 billion opportunity in wet cat food and cat treats, where its market presence remains underdeveloped. The trend is supported by urbanization, as cats are better suited to smaller homes and apartment living. While other pets account for a smaller share of the commercial market, they remain part of the broader pet food industry in countries with more diverse companion animal ownership.
By Distribution Channel: Online Disrupts, Specialty Holds Premium Anchor
Specialty stores were the largest distribution channel, with a 28.5% share in 2025, supported by strong premium merchandising, trained staff, and closer alignment with veterinary referral patterns. These stores play a critical role in introducing first-time buyers to premium, raw, freeze-dried, and therapeutic products, where detailed explanations are essential. In May 2025, Stella and Chewy's expanded its presence in PetSmart stores across the United States, followed by an entry into Canada in June 2025. This expansion included over 80 new items and dedicated in-store fixtures, underscoring the importance of specialty stores for brands that require education and visibility beyond shelf space. Specialty retail remains the cornerstone channel for high-value nutrition in the pet food market, even as digital sales gain momentum.
The online channel was the fastest-growing distribution segment, with a 9.2% CAGR for 2026-2031, as repeat purchase behavior aligns well with subscriptions and digital replenishment. Freshpet reported that digital orders accounted for 16.1% of its total business in Q1 2026, reflecting a 43% growth rate. Similarly, J.M. Smucker recorded a 14% e-commerce growth for Milk-Bone during the 13 weeks ending February 2026. In April 2026, Phillips Pet Food and Supplies and Central Garden & Pet announced a joint venture to establish a nationally scaled distribution platform. This platform aims to serve specialty, big box, e-commerce, farm and feed, and logistics channels across the United States. While supermarkets and hypermarkets continue to handle large volumes in mainstream formats, online channels are becoming the preferred option for premium replenishment and access to a broader assortment. Convenience stores and other channels are anticipated to remain secondary due to their limited depth compared to specialty stores and the convenience offered by digital platforms.
Geography Analysis
North America was the largest region, with a 44.1% share of the pet food market in 2025, and it remains the center of premium spending and large-scale manufacturing investment. Purina started operations at its USD 550 million Batavia, Ohio, facility in March 2026, and the site is designed to feed 8 million animals annually. Mars, Incorporated opened its USD 450 million Royal Canin facility in Lewisburg, Ohio, in May 2025, and the company stated that it was part of more than USD 6 billion in investment in United States manufacturing over the past 5 years. Mexico is also gaining weight in the regional supply base, with Nestlé committing USD 455 million to Mexican facilities through 2027, while South America continues to offer medium-term growth led by Brazil's lower commercial feeding penetration. Brazil remains the standout South American opportunity because only 45% of pets consume commercial food in 2025, leaving room for long-term conversion into the pet food market.
Europe remains a significant region in the pet food market, but growth is slower because the base is more mature and private-label capacity is already deep. The region still matters because it shapes ingredient rules and product quality expectations, and it continues to influence how novel proteins are reviewed and commercialized. Europe also remains active on consolidation and capability building, with The Nutriment Company completing 10 acquisitions in 2025 and Trouw Nutrition opening its second pet-dedicated premix plant in Europe, this time in Spain, in March 2026. The Asia-Pacific pet food market is expanding, supported by urbanization, first-generation pet ownership, and capacity investments such as Mars's USD 72.7 million (AUD 112.5 million) Wodonga expansion in Australia in 2026.
Africa was the fastest-growing region, with a CAGR of 8.1% for 2026-2031, although it is growing from a smaller base than North America or Europe. The main driver is low current penetration of commercial pet food, leaving room for long-term conversion as urban incomes and companion animal ownership rise. The Middle East also shows strong momentum, especially in Gulf Cooperation Council markets, where premium imported brands have a visible shelf presence and veterinary care is becoming more common in major cities. South Africa remains the most developed African market, and RCL FOODS agreed in March 2026 to acquire Martin & Martin for USD 36 million (ZAR 695 million) to expand beyond dry food and build a stronger position in wet food and pet care. Saudi Arabia, the United Arab Emirates, and Egypt are continuing to emerge as longer-term growth opportunities in the Middle East, supported by rising pet ownership, increasing demand for premium pet food, expanding modern retail distribution, and growing consumer awareness of specialized nutrition products.

Competitive Landscape
The pet food market is moderately consolidated, with Purina PetCare (Nestlé S.A.), Mars, Incorporated, and Hill's Pet Nutrition (Colgate-Palmolive Company) as the key global players, each combining large manufacturing systems, veterinary access, and broad product portfolios. This scale matters more as the category moves into fresh nutrition, clinical diets, and digitally supported replenishment, all of which require stronger operational control. The pet food market still allows room for niche competition, but the cost of building manufacturing depth and regulatory capability is rising. That keeps the largest companies in a stronger position even while premium subcategories remain open to challengers.
The biggest strategic pattern is capacity expansion tied to premium and specialized demand. Purina brought its USD 550 million Ohio plant, which will be fully operational by the end of 2026, and Mars opened its USD 450 million Royal Canin facility in Ohio in May 2025 as part of a broad United States investment cycle. Companies are also expanding into fresh and gently cooked pet food categories to capture the fastest-growing areas of consumer spending within the market. Royal Canin launched Fresh Health Nutrition in 2025, while ORIJEN launched FRESHPREY in 2026, and General Mills pushed Blue Buffalo into fresh products in 2025. This combination of scale and portfolio expansion is reshaping competition across the pet food market.
Another competitive pattern is targeted acquisition and cross-border consolidation. In February 2026, Agrolimen acquired Ollie for more than USD 600 million, strengthening its position in the United States as a provider of personalized fresh dog food. In Europe, The Nutriment Company completed 10 acquisitions in 2025, while Normandise expanded into North America in March 2026 through its Food4Pets Canada deal. Companies are also using science-based product extensions such as Hill's ActivBiome+ and Purina Pro Plan AdvantEDGE to defend premium positions with clearer health benefits. These moves show a pet food market where large brands are defending their scale, while regional and specialist players are pursuing focused growth through format innovation and selective deals.
Pet Food Industry Leaders
Mars Incorporated
The J. M. Smucker Company
Purina PetCare (Nestlé S.A.)
General Mills, Inc.
Hill's Pet Nutrition, Inc. (Colgate-Palmolive Company)
- *Disclaimer: Major Players sorted in no particular order

Recent Industry Developments
- May 2026: Mars, Incorporated announced a USD 72.7 million (AUD 112.5 million) investment in a new 7,800-square-meter wet pouch facility at its Wodonga, Australia, factory, with the site scheduled to open in June 2026.
- April 2026: Phillips Pet Food and Supplies and Central Garden & Pet announced a strategic distribution joint venture to build a nationally scaled platform serving specialty, big box, e-commerce, farm and feed, second-party fulfillment, and third-party logistics channels in the United States.
- April 2026: Drools (India) launched the first fresh pet food product in Asia using Tetra Pak's Tetra Recart retort packaging technology, backed by a USD 21 million (INR 180 crore) infrastructure investment with Tetra Pak. The product eliminates cold-chain requirements while preserving freshness, a significant barrier removal for emerging markets with limited refrigerated retail infrastructure.


Global Pet Food Market Report Scope
The pet food market covers commercially prepared food, treats, supplements, and veterinary diets made for cats, dogs, and other companion animals. The pet food market is segmented by pet food product (food, pet nutraceuticals/supplements, pet treats, and pet veterinary diets), by pets (cats, dogs, and other pets), by distribution channel (convenience stores, online channel, specialty stores, supermarkets/hypermarkets, and other channels), and by geography (North America, South America, Europe, Asia-Pacific, Middle East, and Africa). The market forecasts are provided in terms of value (USD) and volume (Metric Tons).
By Pet Food Product
| Food | Dry Pet Food | Kibbles |
| Other Dry Pet Food | ||
| Wet Pet Food | ||
| Pet Nutraceuticals/Supplements | Milk Bioactives | |
| Omega-3 Fatty Acids | ||
| Probiotics | ||
| Proteins and Peptides | ||
| Vitamins and Minerals | ||
| Other Nutraceuticals | ||
| Pet Treats | Crunchy Treats | |
| Dental Treats | ||
| Freeze-dried and Jerky Treats | ||
| Soft and Chewy Treats | ||
| Other Treats | ||
| Pet Veterinary Diets | Derma Diets | |
| Diabetes | ||
| Digestive Sensitivity | ||
| Obesity Diets | ||
| Oral Care Diets | ||
| Renal | ||
| Urinary Tract Disease | ||
| Other Veterinary Diets |
By Pets
| Cats |
| Dogs |
| Other Pets |
By Distribution Channel
| Convenience Stores |
| Online Channel |
| Specialty Stores |
| Supermarkets/Hypermarkets |
| Other Channels |
By Region
| North America | Canada |
| Mexico | |
| United States | |
| Rest of North America | |
| South America | Argentina |
| Brazil | |
| Rest of South America | |
| Europe | France |
| Germany | |
| Italy | |
| Netherlands | |
| Poland | |
| Russia | |
| Spain | |
| United Kingdom | |
| Rest of Europe | |
| Asia-Pacific | Australia |
| China | |
| India | |
| Indonesia | |
| Japan | |
| Malaysia | |
| Philippines | |
| Taiwan | |
| Thailand | |
| Vietnam | |
| Rest of Asia-Pacific | |
| Middle East | Saudi Arabia |
| United Arab Emirates | |
| Rest of Middle East | |
| Africa | Egypt |
| South Africa | |
| Rest of Africa |
| By Pet Food Product | Food | Dry Pet Food | Kibbles |
| Other Dry Pet Food | |||
| Wet Pet Food | |||
| Pet Nutraceuticals/Supplements | Milk Bioactives | ||
| Omega-3 Fatty Acids | |||
| Probiotics | |||
| Proteins and Peptides | |||
| Vitamins and Minerals | |||
| Other Nutraceuticals | |||
| Pet Treats | Crunchy Treats | ||
| Dental Treats | |||
| Freeze-dried and Jerky Treats | |||
| Soft and Chewy Treats | |||
| Other Treats | |||
| Pet Veterinary Diets | Derma Diets | ||
| Diabetes | |||
| Digestive Sensitivity | |||
| Obesity Diets | |||
| Oral Care Diets | |||
| Renal | |||
| Urinary Tract Disease | |||
| Other Veterinary Diets | |||
| By Pets | Cats | ||
| Dogs | |||
| Other Pets | |||
| By Distribution Channel | Convenience Stores | ||
| Online Channel | |||
| Specialty Stores | |||
| Supermarkets/Hypermarkets | |||
| Other Channels | |||
| By Region | North America | Canada | |
| Mexico | |||
| United States | |||
| Rest of North America | |||
| South America | Argentina | ||
| Brazil | |||
| Rest of South America | |||
| Europe | France | ||
| Germany | |||
| Italy | |||
| Netherlands | |||
| Poland | |||
| Russia | |||
| Spain | |||
| United Kingdom | |||
| Rest of Europe | |||
| Asia-Pacific | Australia | ||
| China | |||
| India | |||
| Indonesia | |||
| Japan | |||
| Malaysia | |||
| Philippines | |||
| Taiwan | |||
| Thailand | |||
| Vietnam | |||
| Rest of Asia-Pacific | |||
| Middle East | Saudi Arabia | ||
| United Arab Emirates | |||
| Rest of Middle East | |||
| Africa | Egypt | ||
| South Africa | |||
| Rest of Africa | |||


Market Definition
- FUNCTIONS - Pet foods are usually intended to provide complete and balanced nutrition to the pet but are primarily used as functional products. The scope includes the food and supplements consumed by pets including veterinary diets. Supplements/nutraceuticals that are directly supplied to pets are considered within the scope.
- RESELLERS - Companies engaged in reselling of pet food without value addition have been excluded from the market scope, in order to avoid double counting.
- END CONSUMERS - Pet owners are considered to be the end-consumers in the market studied.
- DISTRIBUTION CHANNELS - Supermarkets/hypermarkets, specialty stores, convenience stores, online channels and other channels are considered within the scope. The stores which are exclusively providing pet related basic and custom products are considered within the scope of specialty stores.
| Keyword | Definition |
|---|---|
| Pet Food | The scope of pet food includes the food that is eatable by pets including food, treats, veterinary diets, and nutraceuticals/supplements. |
| Food | Food is animal feed intended for consumption by pets. It is formulated to provide essential nutrients and meet the dietary needs of various types of pets, including dogs, cats, and other animals. These are generally segmented into dry and wet pet foods. |
| Dry Pet Food | Dry pet foods may be extruded/baked (kibbles) or flaked. They have a lower moisture content, typically around 12-20%. |
| Wet Pet Food | Wet pet food, also known as canned pet food or moist pet food, generally has a higher moisture content compared to dry pet food, often ranging from 70-80%. |
| Kibbles | Kibbles are dry, processed pet food in small, bite-sized pieces or pellets. They are specifically formulated to provide balanced nutrition for various domestic animals, such as dogs, cats, and other animals. |
| Treats | Pet Treats are special food items or rewards given to pets, to show affection, and encourage good behavior. They are especially used during training. Pet treats are made from various combinations of meat or meat-derived materials with other ingredients. |
| Dental Treats | Pet dental treats are specialized treats that are formulated to promote good oral hygiene in pets. |
| Crunchy Treats | It is a type of pet treat that has a firm and crispy texture which can be a good source of nutrition for pets. |
| Soft and chewy treats | Soft and Chewy pet treats are a type of pet food product that is formulated to be easy to chewy and digest. They are usually made from soft and pliable ingredients, such as meat, poultry, or vegetables, that have been blended and formed into bite-sized pieces or strips. |
| Freeze-dried & Jerky Treats | Freeze-dried and jerky treats are snacks given to pets, that are prepared through a special preservation process, without damaging the nutritional content, resulting in long-lasting, nutrient-rich treats. |
| Urinary Tract Disease Diets | These are commercial diets that are specifically formulated to promote urinary health and reduce the risk of urinary tract infections and other urinary problems. |
| Renal Diets | These are specialized pet foods formulated to support the health of pets with kidney disease or renal insufficiency. |
| Digestive Sensitivity Diets | Digestive-sensitive diets are specially formulated to meet the nutritional needs of pets with digestive issues such as food intolerances, allergies, and sensitivities. These diets are designed to be easily digestible and to reduce the symptoms of digestive problems in pets. |
| Oral Care Diets | Oral care diets for pets are specially formulated diets produced to promote oral health and hygiene in pets. |
| Grain-Free Pet Food | Pet food that does not contain common grains like wheat, corn, or soy. Grain-free diets are often preferred by pet owners seeking alternative options or if their pets have specific dietary sensitivities. |
| Premium Pet Food | High-quality pet food formulated with superior ingredients often offers additional nutritional benefits compared to standard pet food. |
| Natural Pet Food | Pet food made from natural ingredients, with minimal processing and without artificial preservatives. |
| Organic Pet Food | Pet food is produced using organic ingredients, free from synthetic pesticides, hormones, and genetically modified organisms (GMOs). |
| Extrusion | A manufacturing process used to produce dry pet food, where ingredients are cooked, mixed, and shaped under high pressure and temperature. |
| Other Pets | Other pets include birds, fish, rabbits, hamsters, ferrets, and reptiles. |
| Palatability | The taste, texture, and aroma of pet food influence its appeal and acceptance by pets. |
| Complete and Balanced Pet Food | Pet food that provides all essential nutrients in appropriate proportions to meet the nutritional needs of pets without additional supplementation. |
| Preservatives | These are the substances that are added to pet food to extend its shelf life and prevent spoilage. |
| Nutraceuticals | Food products that offer health benefits beyond basic nutrition, often contain bioactive compounds with potential therapeutic effects. |
| Probiotics | Live beneficial bacteria that promote a healthy balance of gut flora, supporting digestive health and immune function in pets. |
| Antioxidants | Compounds that help neutralize harmful free radicals in the body, promoting cellular health and supporting the immune system in pets. |
| Shelf-Life | The duration of which pet food remains safe and nutritionally viable for consumption after its production date. |
| Prescription diet | Specialized pet food formulated to address specific medical conditions under veterinary supervision. |
| Allergen | A substance that can cause allergic reactions in some pets, leading to food allergies or sensitivities. |
| Canned food | Wet pet food that is packed in cans and contains higher moisture content than dry food. |
| Limited ingredient diet (LID) | Pet food formulated with a reduced number of ingredients to minimize potential allergens. |
| Guaranteed Analysis | The minimum or maximum levels of certain nutrients present in pet food. |
| Weight management | Pet food designed to help pets maintain a healthy weight or support weight loss efforts. |
| Other Nutraceuticals | It includes prebiotics, antioxidants, digestive fiber, enzymes, essential oils and herbs. |
| Other Veterinary Diets | It includes weight management diets, skin and coat health, cardiac care, and joint care. |
| Other Treats | It includes rawhides, mineral blocks, lickables, and catnips. |
| Other Dry Foods | It includes cereal flakes, mixers, meal toppers, freeze-dried foods, and air-dried foods. |
| Other Animals | It includes birds, fish, reptiles, and small animals (rabbits, ferrets, hamsters). |
| Other Distribution Channels | It includes veterinary clinics, local unregulated stores, and feed and farm stores. |
| Proteins and Peptides | Proteins are large molecules composed of basic units called amino acids which help in the growth and development of pets. Peptides are the short string of 2 to 50 amino acids. |
| Omega-3 fatty acids | Omega-3 fatty acids are essential polyunsaturated fats that play a crucial role in the overall health and well-being of Pets |
| Vitamins | Vitamins are the essential organic compounds that are essential for vital physiological functioning. |
| Minerals | Minerals are naturally occurring inorganic substances that are essential for various physiological functions in pets. |
| CKD | Chronic Kidney Disease |
| DHA | Docosahexaenoic Acid |
| EPA | Eicosapentaenoic Acid |
| ALA | Alpha-linolenic Acid |
| BHA | Butylated Hydroxyanisol |
| BHT | Butylated Hydroxytoluene |
| FLUTD | Feline Lower Urinary Tract Disease |


Research Methodology
Mordor Intelligence follows a four-step methodology in all our reports.
- Step-1: IDENTIFY KEY VARIABLES: In order to build a robust forecasting methodology, the variables and factors identified in Step-1 are tested against available historical market numbers. Through an iterative process, the variables required for market forecast are set and the model is built on the basis of these variables.
- Step-2: Build a Market Model: Market-size estimations for the forecast years are in nominal terms. Inflation is not a part of the pricing, and the average selling price (ASP) is kept constant throughout the forecast period.
- Step-3: Validate and Finalize: In this important step, all market numbers, variables and analyst calls are validated through an extensive network of primary research experts from the market studied. The respondents are selected across levels and functions to generate a holistic picture of the market studied.
- Step-4: Research Outputs: Syndicated Reports, Custom Consulting Assignments, Databases & Subscription Platforms


