Pay Equity Analytics Platform Market Size and Share
Market Overview
| Study Period | 2020 - 2031 |
|---|---|
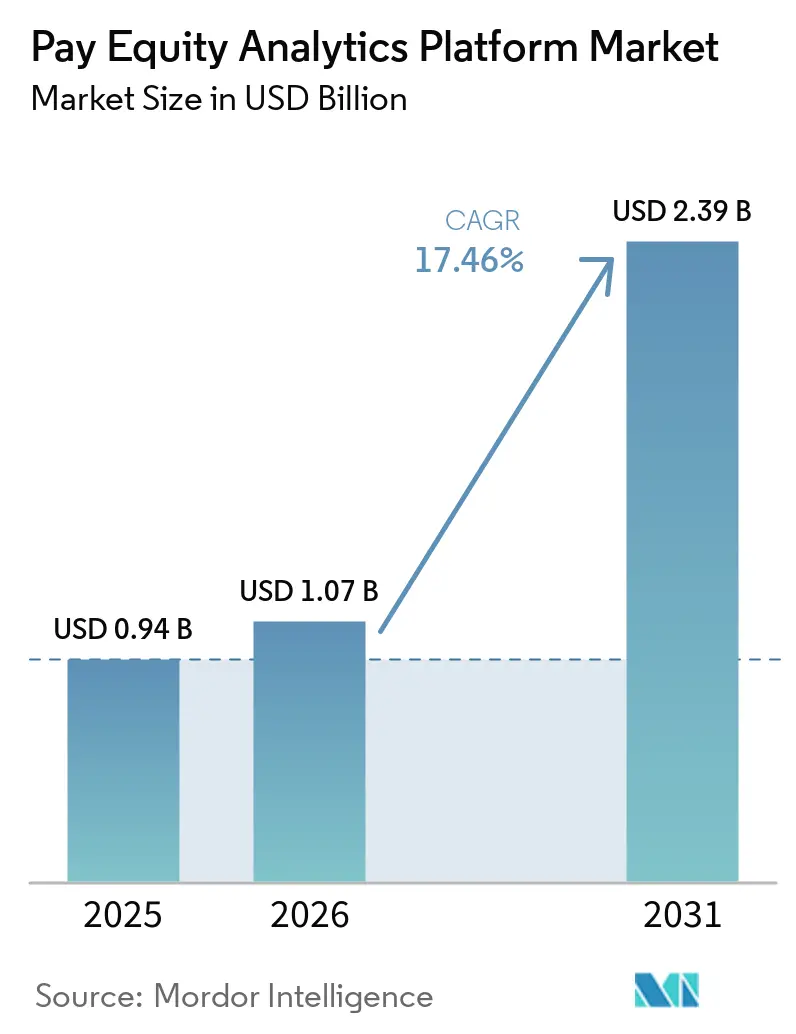
| Market Size (2026) | USD 1.07 Billion |
| Market Size (2031) | USD 2.39 Billion |
| Growth Rate (2026 - 2031) | 17.46% CAGR |
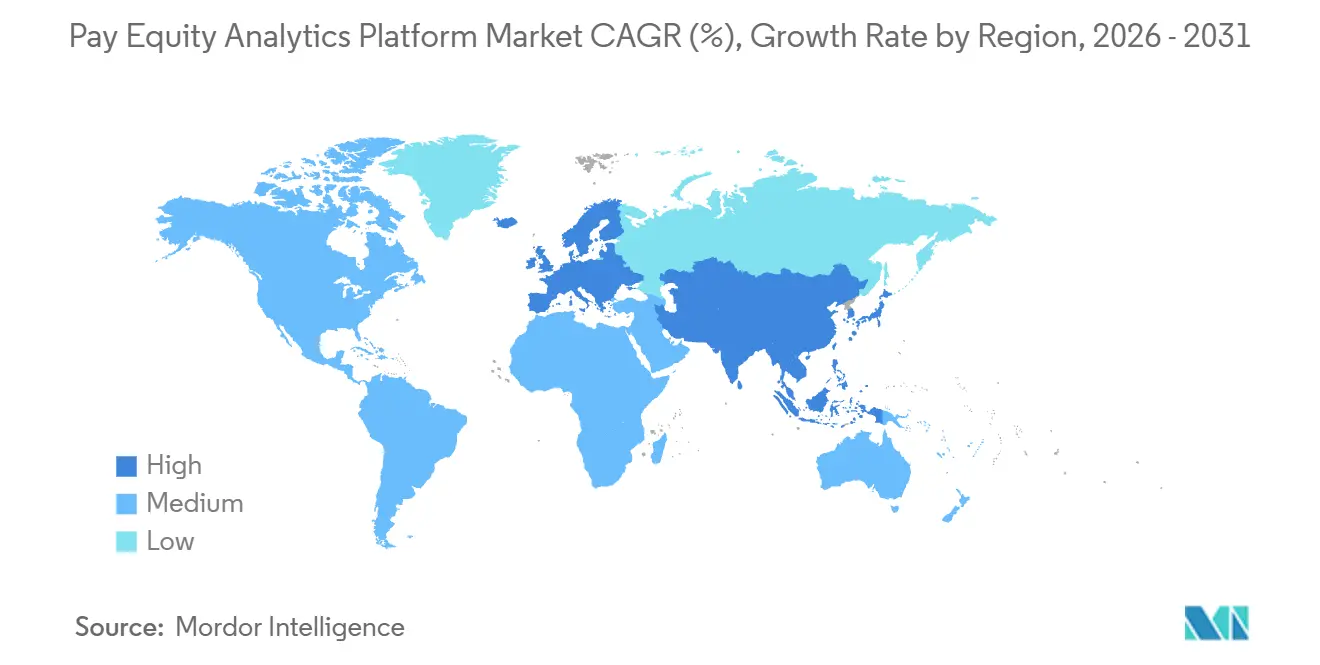
| Fastest Growing Market | Asia-Pacific |
| Largest Market | North America |
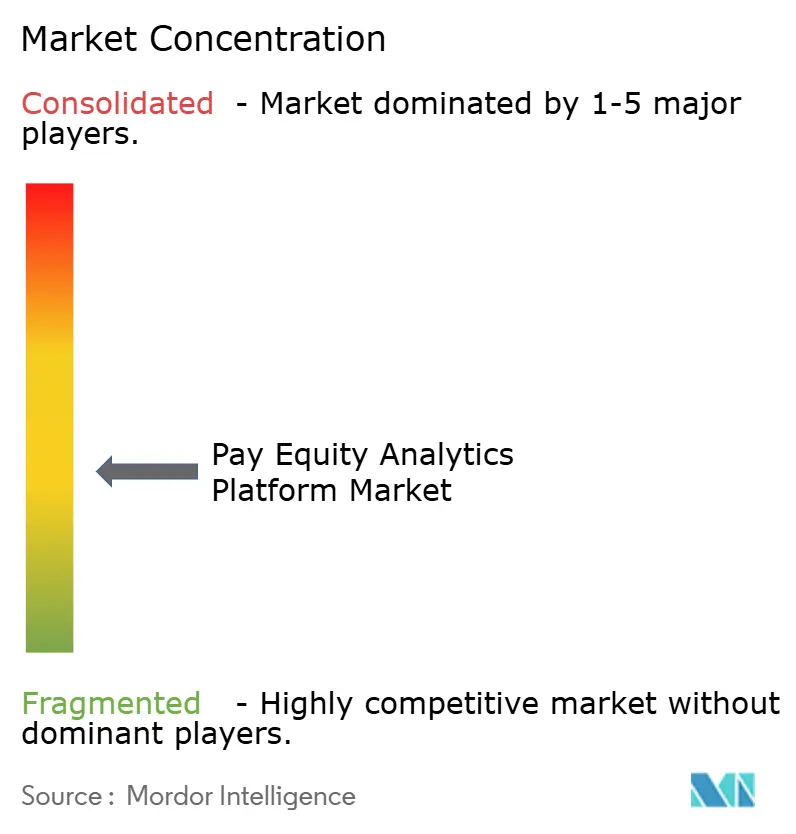
| Market Concentration | Medium |
Major Players *Disclaimer: Major Players sorted in no particular order Image © Mordor Intelligence. Reuse requires attribution under CC BY 4.0. | |
Pay Equity Analytics Platform Market Analysis by Mordor Intelligence
The pay equity analytics platform market size is projected to expand from USD 0.94 billion in 2025 and USD 1.07 billion in 2026 to USD 2.39 billion by 2031, registering a CAGR of 17.46% between 2026 and 2031. The pay equity analytics platform market is moving from a periodic HR review toward an always-on compliance and governance workflow as employers face tighter disclosure rules in Europe and a growing set of state-level obligations in the United States. Demand is also rising because compensation data now sits across payroll, HRIS, recruiting, and performance systems, and employers need one controlled environment to connect these records without relying on manual spreadsheets. Vendor competition is sharpening at the enterprise end of the pay equity analytics platform market, where buyers prefer platforms with strong integrations, audit trails, and multi-country reporting. The next layer of opportunity is opening in the mid-market, where firms with 100 or more employees are being pulled into formal reporting and remediation requirements for the first time. The result is a pay equity analytics platform market where compliance triggers the first purchase, but workflow automation, governance, and recurring monitoring are likely to drive long-term account expansion.
Key Report Takeaways
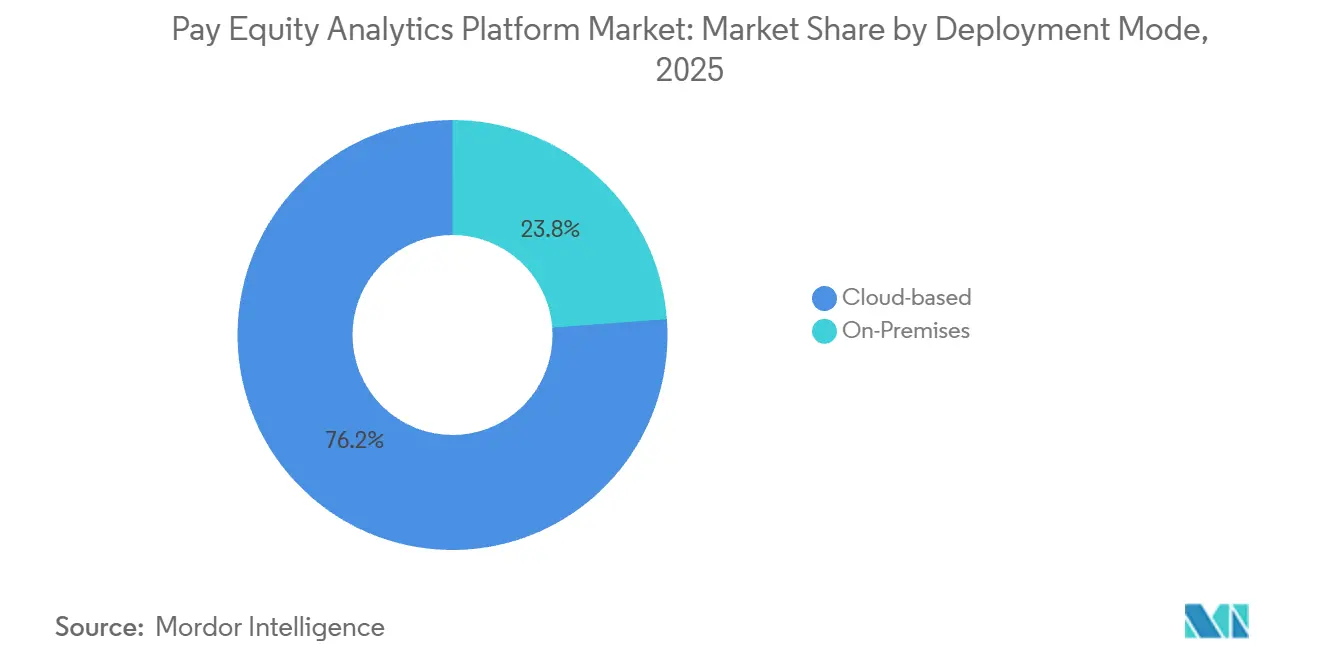
- By deployment mode, cloud-based platforms led with 76.18% share in 2025 of the pay equity analytics platform market, and cloud-based deployment is also projected to record the fastest 18.94% CAGR through 2031.
- By organization size, large enterprises held 66.42% share in 2025, while SMEs are forecast to expand at a 20.87% CAGR through 2031.
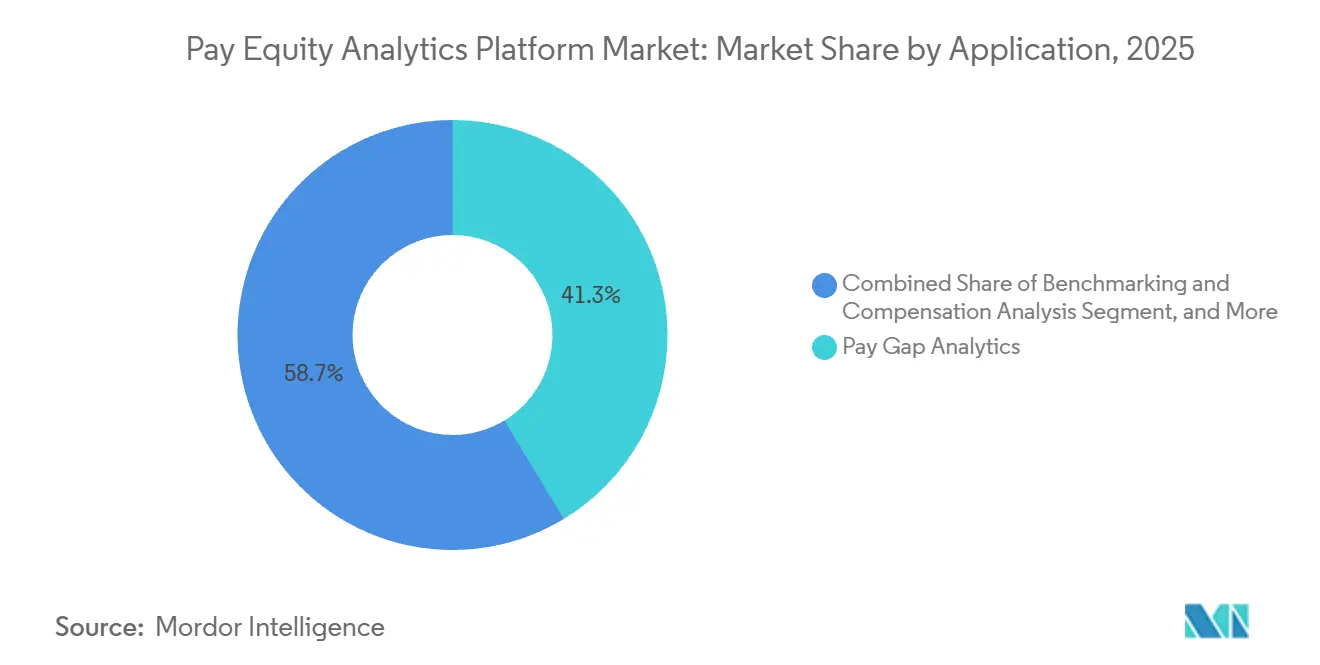
- By application, pay gap analytics accounted for 41.33% of the pay equity analytics platform market in 2025, while compliance and regulatory reporting is advancing at a 21.74% CAGR through 2031.
- By end-user industry, BFSI held 22.48% share in 2025, while healthcare and life sciences is projected to grow at a 21.11% CAGR through 2031.
- By geography, North America held 44.26% share in 2025, while Asia-Pacific is projected to expand at a 22.41% CAGR through 2031.
Note: Market size and forecast figures in this report are generated using Mordor Intelligence’s proprietary estimation framework, updated with the latest available data and insights as of January 2026.
Global Pay Equity Analytics Platform Market Trends and Insights
Drivers Impact Analysis*
| Driver | (~) % Impact on CAGR Forecast | Geographic Relevance | Impact Timeline |
|---|---|---|---|
| EU Pay Transparency Directive Deadline In 2026 | +4.2% | EU core, especially Germany, France, Italy, Spain, and Poland, with spillover to MENA and Asia-Pacific multinationals with EU headcount | Short term (≤ 2 years) |
| Expansion Of U.S. State Pay Transparency And Pay Data Reporting Laws | +3.5% | North America core, especially California, New York, Illinois, Massachusetts, Washington, and Colorado, with remote-work compliance across multi-state employers | Short term (≤ 2 years) |
| Shift Toward Continuous Pay Equity Audits And Board-Level Accountability | +2.8% | Global, strongest in North America and Western Europe | Medium term (2-4 years) |
| Cloud HR Stack Integration And Workflow Automation | +2.1% | Global, with faster acceleration in Asia-Pacific and South America from a lower cloud-HR base | Medium term (2-4 years) |
| Embedding Fair-Pay Guardrails Into Hiring, Promotion, And Merit Decisions | +1.5% | Global, highest intensity in large enterprises in North America and Europe | Long term (≥ 4 years) |
| Rising Need For Job Architecture And Work-Of-Equal-Value Classification | +1.2% | Europe and North America, with early influence in Australia and South Africa | Long term (≥ 4 years) |
| Source: Mordor Intelligence | |||
EU Pay Transparency Directive Creates Immediate Compliance Demand
The June 7, 2026, transposition deadline has become the clearest near-term trigger for the pay equity analytics platform market. The directive requires salary-range transparency for candidates, gives employees access to pay-level information, restricts salary history practices, and bars pay secrecy clauses, which turns compensation data into a regulated operating process rather than a one-time review. Employers with 150 or more employees must publish their first gender pay gap reports by June 7, 2027, and employers with 100 or more employees must follow by 2031. The directive also sets a 5% threshold for unjustified pay gaps, and if the gap is not corrected within 6 months, the employer must carry out a joint pay assessment with worker representatives. That combination is pushing the pay equity analytics platform market toward audit-grade systems capable of classifying workers, tracking remediation windows, and preserving defensible records across multiple jurisdictions. The same rule set is also expanding the buyer base in the pay equity analytics platform market, as mid-sized employers that were previously outside formal reporting cycles are now moving toward compliance.
U.S. State Pay Transparency Laws Drive A Patchwork Compliance Market
State-level rulemaking is creating a second major demand engine for the pay equity analytics platform market. Colorado continues to enforce its Equal Pay for Equal Work Act and reported USD 841,500 in total citation fines, which shows that noncompliance now carries visible financial consequences rather than only reputational risk.[1]Colorado Department of Labor and Employment, “Equal Pay for Equal Work Act,” Colorado Department of Labor and Employment, cdle.colorado.gov Massachusetts now requires salary range disclosure in defined circumstances, and the law applies to employers with 25 or more employees, which lowers the practical entry point for formal pay transparency controls. For employers operating across remote and distributed teams, the issue is less about one statute and more about coordinating several state-specific posting, recordkeeping, and reporting rules at the same time. That is why the pay equity analytics platform market is benefiting from demand for centralized policy logic, reusable job structures, and standardized disclosure workflows. The patchwork model also favors vendors that can update rule libraries quickly and present state-specific outputs through a single reporting layer.
Continuous Audits And Board-Level Accountability Reshape Procurement Cycles
The pay equity analytics platform market is also being reshaped by a move from periodic studies toward recurring monitoring. The core buying pattern used to center on consultant-led projects, but the need for annual reporting and faster remediation is making live dashboards and repeatable workflows more important. Trusaic reported that 67% of financial services firms conducted annual pay equity audits in 2025, compared with 47% in healthcare, which shows that more mature sectors are already operating on a more continuous review cycle.[2]Trusaic, “Pay Equity Study Shows Financial Services Lead, Healthcare Lag,” Trusaic, trusaic.com In the pay equity analytics platform market, this shift changes what buyers want from software because a static model is less useful than an environment that can monitor new hires, promotions, and merit changes as they happen. Public reporting obligations also increase executive exposure because compensation gaps are no longer handled only within HR and legal teams. That is making the pay equity analytics platform market more closely aligned with board oversight, risk management, and enterprise governance budgets.
Cloud HR Stack Integration Lowers Deployment Friction
Cloud connectivity is becoming one of the strongest commercial advantages in the pay equity analytics platform market. Buyers increasingly expect pay equity tools to sit within existing HR workflows rather than requiring manual file preparation outside payroll, recruiting, and HCM systems. Trusaic launched PayParity on the Workday Marketplace in November 2025, with bi-directional integration between Workday HCM and Workday Recruiting, enabling equity insights to appear in recruiter workflows. Evenpay states that it integrates with Workday, SAP SuccessFactors, HiBob, BambooHR, Personio, Deel, and Remote, and supports GDPR-compliant EU data residency. Payscale expanded its integration footprint in early 2025, adding 10 new HRIS integrations and bringing the total to 14. As a result, the pay equity analytics platform market is rewarding vendors that shorten data onboarding, reduce IT involvement, and fit naturally into the daily systems that compensation teams already use.
Restraints Impact Analysis*
| Restraint | (~) % Impact on CAGR Forecast | Geographic Relevance | Impact Timeline |
|---|---|---|---|
| Sensitive Compensation Data Privacy And Security Exposure | -3.1% | Global, with the highest sensitivity in Europe under GDPR, in California under CCPA, and in markets with strict localization rules | Medium term (2-4 years) |
| Weak Job Architecture And Fragmented HR Data | -2.4% | Global, especially acute in Asia-Pacific and South America where HR digitization remains uneven | Long term (≥ 4 years) |
| Legal Discoverability Risk From Unremediated Audit Findings | -1.8% | North America and Europe, highest in litigation-heavy jurisdictions | Medium term (2-4 years) |
| Salary Benchmarking Data Licensing And Localization Cost Burden | -1.2% | Emerging markets in Asia-Pacific, South America, and Africa, especially where local survey coverage is thin | Long term (≥ 4 years) |
| Source: Mordor Intelligence | |||
Compensation Data Privacy Exposure Constrains Enterprise Adoption
Data sensitivity remains one of the clearest brakes on the pay equity analytics platform market. These platforms must process compensation, demographic attributes, performance information, and career histories, which means buyers are often evaluating them against the strictest standards used anywhere in the HR stack. Evenpay positions GDPR-compliant EU data residency and security controls as part of its product value, which shows how closely adoption is tied to privacy expectations in regulated markets. PayAnalytics by beqom also emphasizes pay equity and workforce analytics in a framework built for enterprise use, reflecting how certification and governance have become baseline purchase conditions. In the pay equity analytics platform market, this raises the bar for smaller vendors because buyers want clear evidence of data handling discipline before they will connect payroll and employee records. Privacy rules, therefore, slow some deals even while they make specialized platforms more necessary.
Fragmented HR Data And Weak Job Architectures Slow Time-To-Value
Poor data readiness is another structural limit on how fast the pay equity analytics platform market can convert interest into live deployments. Many employers still manage compensation records across acquired entities, disconnected payroll systems, and inconsistent job titles, which makes clean comparisons difficult even when the software itself is strong. Trusaic partnered with gradar in March 2026 to combine factor-based job grading with pay analytics, directly addressing the need to define work of equal value under the European rules. Ravio introduced job architecture mapping tools in September 2024 to align internal job levels with its framework for cleaner compensation comparisons. This pattern shows that the pay equity analytics platform market is no longer selling analytics alone, because many accounts first need job leveling, normalization, and governance work before output becomes trusted. It also means vendors that package services and prebuilt classification logic can shorten adoption cycles and widen their revenue per customer over time.
*Our forecasts treat driver/restraint impacts as directional, not additive. The impact forecasts reflect baseline growth, mix effects, and variable interactions.
Segment Analysis
By Deployment Mode: Cloud Leadership Strengthens As Compliance Workflows Become More Continuous
Cloud-based deployment accounted for 76.18% share of the pay equity analytics platform market size in 2025, and cloud-based deployment is also forecast to expand at an 18.94% CAGR through 2031. In the pay equity analytics platform market, that lead reflects the practical need to connect payroll, HRIS, ATS, and compensation planning data without relying on repeated file transfers. The cloud model also supports multi-country policy changes more efficiently because vendors can update reporting logic across all clients from one governed environment. This matters more as employers face overlapping rules in Europe and North America and need a system that can absorb frequent legal changes without a fresh IT project each time.
On-premises tools still retain a place in some financial institutions, public bodies, and organizations with strict hosting requirements. Even so, the balance of demand in the pay equity analytics platform market is moving toward hosted environments because faster implementation, centralized controls, and stronger integration paths now outweigh earlier cloud hesitations for many buyers. Payscale’s integration expansion in early 2025 underscored how the competitive center of gravity has shifted toward connected deployment rather than isolated analysis. The same pattern is visible in enterprise procurement, where buyers increasingly ask whether a platform can plug into existing HCM workflows on day 1. Within the pay equity analytics platform industry, deployment choice is therefore becoming less about infrastructure preference and more about how quickly a client can move from raw data to defensible decisions.


By Organization Size: Enterprise Scale Still Leads, But SME Demand Is Rising Faster
Large enterprises held 66.42% share in 2025, while SMEs are projected to grow at a 20.87% CAGR through 2031. The pay equity analytics platform market still leans toward large employers because they operate across more legal entities, more geographies, and more compensation structures, which increases both reporting complexity and remediation risk. Syndio reported that its platform governs pay for more than 10 million employees across 100 countries and serves nearly 400 global enterprises, including more than 50% of the Fortune 100.[3]Syndio, “Syndio Expands Workplace Equity Platform for the Transparency Era,” Syndio, synd.io That level of adoption shows why enterprise accounts remain the commercial anchor of the pay equity analytics platform market.
The faster growth, however, is moving into smaller employers that are entering formal disclosure and reporting obligations for the first time. In Europe, the reporting threshold of 100 or more employees broadens the addressable buyer pool materially over the forecast period, and in the United States, several state rules already apply to employers of smaller size. Massachusetts, for example, applies salary range requirements to employers with 25 or more employees in covered situations. Ravio’s USD 12 million Series A raise in May 2025 was tied to international expansion and reflects investor interest in tools that can serve growing companies rather than only global enterprises. The pay equity analytics platform market is therefore likely to see simpler packaging, faster setup, and more modular pricing as vendors pursue this emerging mid-market demand pool.
By Application: Pay Gap Analysis Holds The Base, While Reporting Modules Expand Fast
Pay gap analytics accounted for 41.33% of the market in 2025, making it the largest application in the pay equity analytics platform market. That position makes sense because employers usually begin by identifying statistical gaps before adding modules for disclosure, workflow controls, and market benchmarking. The European directive makes pay gap analysis the unavoidable entry point for many organizations, as reporting depends on a defensible view of compensation differences across comparable employee groups. In practical terms, this means the pay equity analytics platform market still starts with core analytics, even as the broader commercial story shifts toward governance and ongoing reporting.
Compliance and regulatory reporting is the fastest-growing application, and the pay equity analytics platform market size for this application is projected to expand at a 21.74% CAGR through 2031. As reporting templates become more detailed and more frequent, manual methods lose credibility because they are harder to reconcile, update, and defend. Dayforce highlighted in its 2026 pay gap report that Black women and Latinas earned 58 cents on the dollar compared with white men in 2025, which shows how employer analysis is widening beyond a single gender comparison. Benchmarking and compensation analysis remain relevant, but it faces more pressure because data access is improving, and some buyers may view them as easier to substitute than compliance modules. Within the pay equity analytics platform industry, the stronger long-term value is likely to lie with applications that combine statistical analysis, regulated outputs, and workflow actions within a single product.

By End-User Industry: BFSI Leads On Adoption Depth, While Healthcare Has The Strongest Growth Runway
BFSI held 22.48% share in 2025, which made it the leading end-user segment in the pay equity analytics platform market. Financial institutions tend to approach compensation issues through a risk lens, which fits well with structured analytics, repeatable controls, and documented remediation. Trusaic found that 67% of financial services firms conducted annual pay equity audits in 2025, the highest rate among the sectors it measured. That audit maturity helps explain why BFSI remains one of the most established spending pools in the pay equity analytics platform market.
Healthcare and life sciences is forecast to grow at a 21.11% CAGR through 2031, making it the fastest-expanding end-user category. The sector still starts from a lower level of software adoption, which leaves more room for first-time platform purchases as providers and life sciences employers face tighter documentation standards. Trusaic reported that only 10% of healthcare organizations used dedicated software for pay equity analysis in 2025, and only 47% conducted annual audits. Silae also noted that the French financial and insurance sector showed an executive-level gender pay gap above 45%, which suggests that leading audit frequency does not eliminate remediation needs in high-pay sectors. Across the pay equity analytics platform market, this mix of mature BFSI demand and underpenetrated healthcare demand creates a useful balance between near-term spend and future expansion.
Geography Analysis
North America held 44.26% of the pay equity analytics platform market share in 2025, giving it the largest regional position. The region benefits from an unusual mix of legal enforceability, employer awareness, and high software readiness, particularly in the United States and Canada. In the United States, the pay equity analytics platform market is supported by a growing web of state-level salary disclosure and reporting obligations that employers must manage across distributed workforces. Colorado’s enforcement record shows the seriousness of this environment, with the state reporting USD 841,500 in total citation fines under the Equal Pay for Equal Work Act.
The pay equity analytics platform market in Europe holds the second-largest regional position, but it is going through the deepest regulatory reset. The European Union’s pay transparency rules apply across all 27 member states, giving the region an unusually broad compliance footprint across both private and public employment.[4]Council of the European Union, “Pay Transparency in the EU,” Council of the European Union, consilium.europa.eu The June 2026 transposition deadline, followed by staged reporting obligations for employers with 150 or more employees and then 100 or more employees, creates a multi-year implementation cycle rather than a one-time rush. The 5% unjustified gap threshold also raises the operating stakes because unresolved findings can move employers into a joint pay assessment process.
Asia-Pacific is the fastest-growing regional segment in the pay equity analytics platform market, projected to expand at a 22.41% CAGR through 2031. Growth there is being supported by multinational employers that want consistent reporting frameworks across global operations and by local employers that are starting to formalize pay transparency practices. The current pattern remains more reactive than in North America or Western Europe, which means adoption still tends to accelerate when legal obligations become clearer. That gap leaves room for further expansion as regional employers improve their HR data foundations and seek closer integration between payroll and compensation governance. South America, the Middle East, and Africa remain earlier-stage territories for the pay equity analytics platform market, although local reporting expectations are beginning to create openings for vendors that can localize job structures and compliance workflows. PayAnalytics by beqom has already published guidance for South African employers on annual Employment Equity Act reporting and pending transparency requirements, which points to a developing commercial path in the region.

Competitive Landscape
The pay equity analytics platform market remains moderately fragmented, even though a small group of specialist vendors has built a clear scale advantage. Syndio, Trusaic, beqom, including PayAnalytics, and Payscale stand out because they combine enterprise relationships, compensation logic, and integration depth in ways that smaller providers often cannot match. At the same time, the long tail of regional specialists and focused point solutions keeps pricing pressure and feature differentiation active across the pay equity analytics platform market. This balance explains why the market does not behave like a winner-takes-most software segment even though leading vendors have become more visible.
A major competitive pattern in the pay equity analytics platform market is the move toward embedded workflow distribution. Syndio launched Syndi in October 2025 as an AI-native decision intelligence tool for pay that works inside Microsoft Teams, Slack, and applicant tracking systems. Payscale launched Payscale Verse and Payfactors Explore in May 2025 to deepen AI-supported compensation analysis and query workflows.[5]Payscale Inc., “Payscale Leads the Way with New Innovative Compensation Solutions That Solve Critical Data Gaps,” Payscale, payscale.com Trusaic has also been pushing decision support and pay equity automation more directly into compensation workflows, which reinforces the wider shift from static analysis toward real-time guidance. In the pay equity analytics platform market, that shift matters because vendors that sit closer to daily hiring and pay decisions are harder to displace than tools used only for annual reporting.
Another point of competition is data readiness support, not just analytics accuracy. Ravio has been expanding its compensation benchmarking footprint and raised USD 12 million in May 2025 to support geographic growth, which signals continued interest in newer models for compensation data collection and delivery. Evenpay differentiates through multi-HRIS integrations and EU data residency, which directly addresses buyer concerns in regulated European deployments. The pay equity analytics platform market is also putting more weight on trust markers such as ISO 27001, SOC 2, and explainable AI controls because enterprise buyers increasingly view them as entry conditions rather than premium extras. That makes the competitive field broader than feature checklists alone, since credibility in security, workflow fit, and implementation support now plays a central role in vendor selection.
Pay Equity Analytics Platform Industry Leaders
Payscale, Inc.
Salary.com, LLC
beqom SA
Syndio Solutions, Inc.
Trusaic
- *Disclaimer: Major Players sorted in no particular order

Recent Industry Developments
- May 2026: Mercer and Syndio announced a formal strategic alliance, combining Mercer's compensation advisory expertise and market data with Syndio's AI-powered pay governance platform. The partnership gives Syndio access to Mercer's advisory client base while positioning the combined offering as a full-spectrum compensation strategy-to-execution solution for enterprise buyers.
- May 2026: beqom published EU Pay Transparency Directive compliance guides covering pay gap definition, worker category classification, and mandatory reporting formats, as member states complete final transposition of the June 2026 deadline obligations.
- February 2026: Ravio launched methodology transparency features showing the specific build methodology for every compensation benchmark, enabling HR teams to validate data quality and explain pay ranges to employees and candidates with full analytical traceability.
- December 2025: PayAnalytics by beqom published guidance for South African employers on Employment Equity Act annual reporting requirements and pending pay transparency legislation, extending the platform's compliance coverage into sub-Saharan Africa.


Global Pay Equity Analytics Platform Market Report Scope
Pay equity analytics platforms are software-led solutions used by employers to identify, explain, remediate, monitor, and report compensation disparities across protected characteristics and comparable work categories. Core functions include pay equity analysis, pay transparency reporting, job architecture (work of equal value) analysis, remediation planning, compensation decision support, and regulatory reporting.
The Pay Equity Analytics Platform Market Report is Segmented by Deployment Mode (Cloud-Based, and On-Premises), Organization Size (Large Enterprises, and SMEs), Application (Pay Gap Analytics, Benchmarking and Compensation Analysis, Compliance and Regulatory Reporting, and Other Applications), End-User Industry (BFSI, IT and Telecommunications, Healthcare and Lifesciences, Retail and E-commerce, Industrial Manufacturing, Government and Public Sector, and Other End-user Industries), and Geography (North America, South America, Europe, Asia-Pacific, Middle East, and Africa). The Market Forecasts are Provided in Terms of Value (USD).
| Cloud-based |
| On-premises |
| Large Enterprises |
| SMEs |
| Pay Gap Analytics |
| Benchmarking and Compensation Analysis |
| Compliance and Regulatory Reporting |
| Other Applications |
| BFSI |
| IT and Telecommunications |
| Healthcare and Lifesciences |
| Retail and E-commerce |
| Industrial Manufacturing |
| Government and Public Sector |
| Other End-user Industries |
| North America | United States |
| Canada | |
| Mexico | |
| South America | Brazil |
| Argentina | |
| Rest of South America | |
| Europe | Germany |
| United Kingdom | |
| France | |
| Italy | |
| Spain | |
| Russia | |
| Rest of Europe | |
| Asia-Pacific | China |
| Japan | |
| India | |
| South Korea | |
| Australia and New Zealand | |
| Rest of Asia-Pacific | |
| Middle East | Saudi Arabia |
| United Arab Emirates | |
| Turkey | |
| Rest of Middle East | |
| Africa | South Africa |
| Egypt | |
| Nigeria | |
| Rest of Africa |
| By Deployment Mode | Cloud-based | |
| On-premises | ||
| By Organization Size | Large Enterprises | |
| SMEs | ||
| By Application | Pay Gap Analytics | |
| Benchmarking and Compensation Analysis | ||
| Compliance and Regulatory Reporting | ||
| Other Applications | ||
| By End-User Industry | BFSI | |
| IT and Telecommunications | ||
| Healthcare and Lifesciences | ||
| Retail and E-commerce | ||
| Industrial Manufacturing | ||
| Government and Public Sector | ||
| Other End-user Industries | ||
| By Geography | North America | United States |
| Canada | ||
| Mexico | ||
| South America | Brazil | |
| Argentina | ||
| Rest of South America | ||
| Europe | Germany | |
| United Kingdom | ||
| France | ||
| Italy | ||
| Spain | ||
| Russia | ||
| Rest of Europe | ||
| Asia-Pacific | China | |
| Japan | ||
| India | ||
| South Korea | ||
| Australia and New Zealand | ||
| Rest of Asia-Pacific | ||
| Middle East | Saudi Arabia | |
| United Arab Emirates | ||
| Turkey | ||
| Rest of Middle East | ||
| Africa | South Africa | |
| Egypt | ||
| Nigeria | ||
| Rest of Africa | ||


Key Questions Answered in the Report
What is driving growth in pay equity analytics platforms through 2031?
The biggest growth drivers are the June 2026 EU pay transparency deadline, expanding U.S. state disclosure rules, and the shift from periodic audits to continuous monitoring. The category is forecast to grow at a 17.46% CAGR and reach USD 2.39 billion by 2031.
Which deployment model is leading adoption?
Cloud-based deployment led with 76.18% share in 2025 and is also the fastest-growing model with an 18.94% CAGR through 2031 because employers want real-time integrations across payroll, HRIS, and ATS systems.
Why are large employers still the main buyers?
Large enterprises held 66.42% share in 2025 because they face the highest complexity across countries, legal entities, and compensation structures. They usually need stronger audit trails and more advanced compliance workflows.
Where is the fastest regional expansion expected?
Asia-Pacific is projected to grow at a 22.41% CAGR through 2031, even though North America remained the largest region in 2025 with 44.26% share. The regional gap suggests meaningful headroom for future adoption.
Which application area is growing the fastest?
Compliance and regulatory reporting is the fastest-growing application at a 21.74% CAGR through 2031. Employers need these modules as reporting frameworks become more frequent, more detailed, and harder to manage manually.
Page last updated on:


