Web Analytics Market Size and Share
Market Overview
| Study Period | 2020 - 2031 |
|---|---|
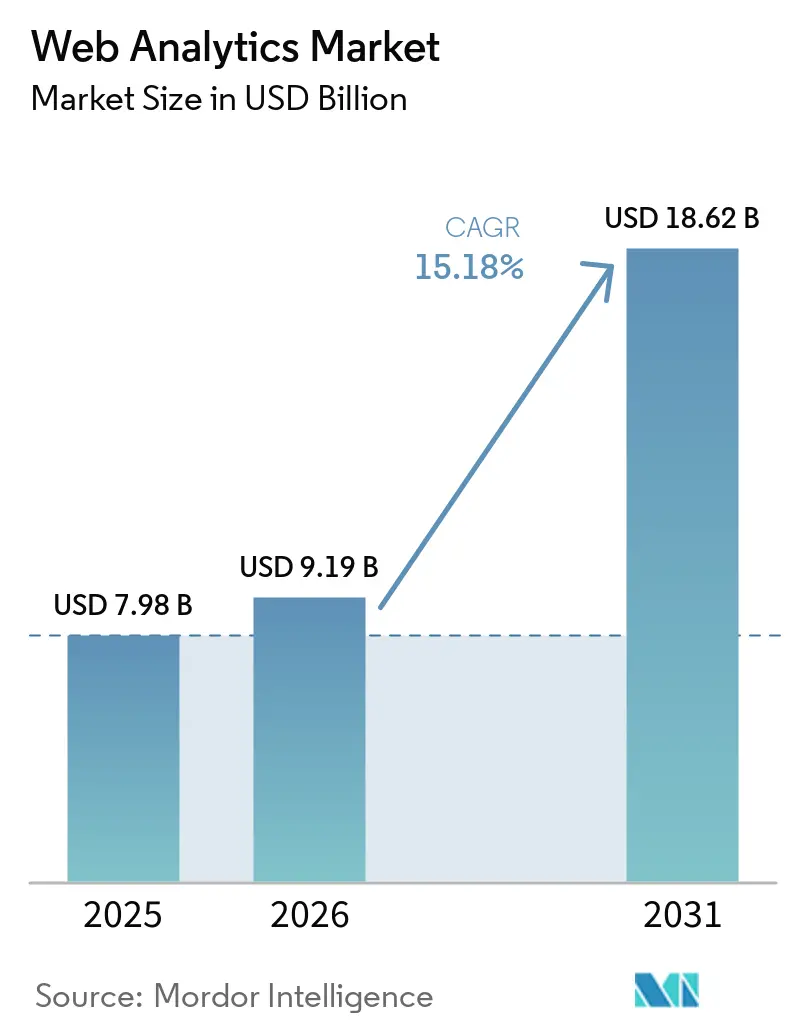
| Market Size (2026) | USD 9.19 Billion |
| Market Size (2031) | USD 18.62 Billion |
| Growth Rate (2026 - 2031) | 15.18% CAGR |
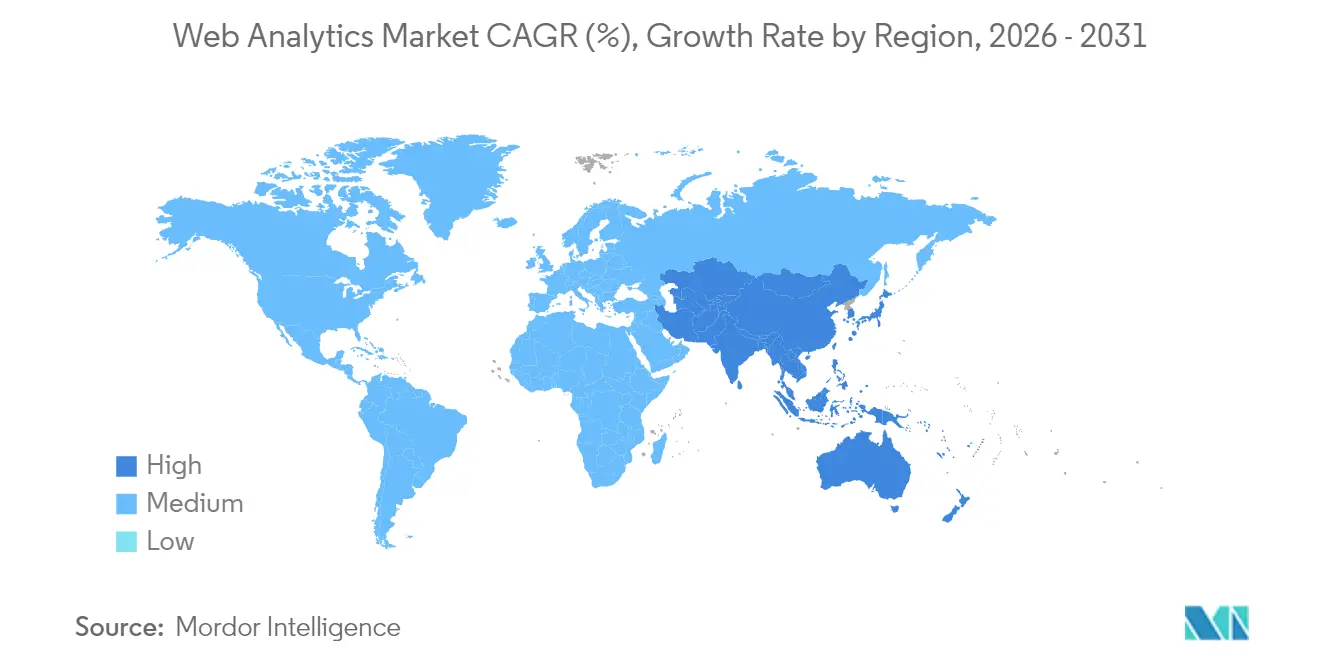
| Fastest Growing Market | Asia Pacific |
| Largest Market | North America |
| Market Concentration | Medium |
Major Players *Disclaimer: Major Players sorted in no particular order Image © Mordor Intelligence. Reuse requires attribution under CC BY 4.0. | |
Web Analytics Market Analysis by Mordor Intelligence
The web analytics market size is expected to grow from USD 7.98 billion in 2025 to USD 9.19 billion in 2026 and is forecast to reach USD 18.62 billion by 2031 at 15.18% CAGR over 2026-2031. Demand surges as organizations migrate customer engagement, commerce, and service touchpoints online, forcing measurement strategies to evolve from page-view reporting to real-time journey intelligence. Mobile-first consumer behavior, server-side tagging, and first-party data activation elevate web analytics from a marketing dashboard to a revenue-critical operating system. Cloud scalability, integrated AI, and privacy-preserving data collection are now buying criteria, shifting competitive advantage toward vendors that combine secure infrastructure with predictive insight. Investors view the web analytics market as a strategic pillar of digital transformation, a position reinforced by the regulatory push for compliant data architectures.
Key Report Takeaways
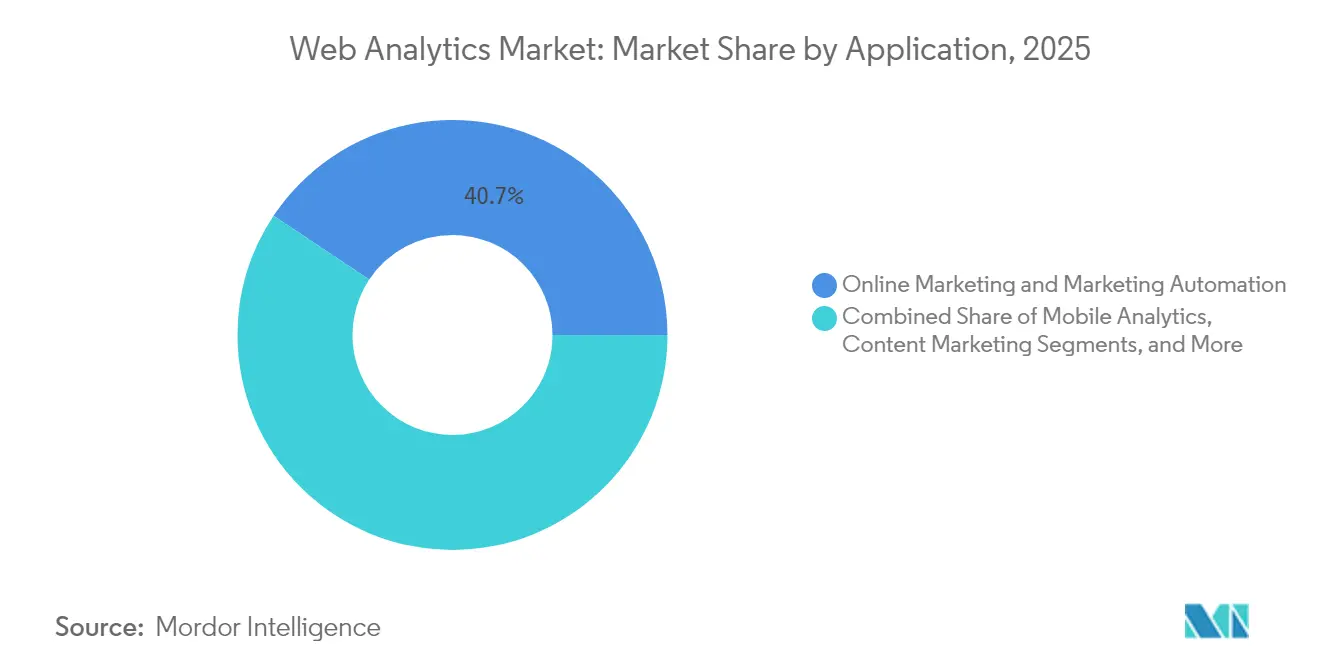
- By application, Online Marketing and Marketing Automation led with 40.65% revenue share in 2025, while Customer Journey Mapping is projected to grow at a 15.95% CAGR through 2031.
- By offering, Solutions held 63.85% share of the web analytics market size in 2025; Services are set to expand at a 16.05% CAGR between 2026-2031.
- By deployment model, Cloud-Based platforms controlled 77.65% of the web analytics market share in 2025 and show the fastest projected CAGR of 16.10% to 2031.
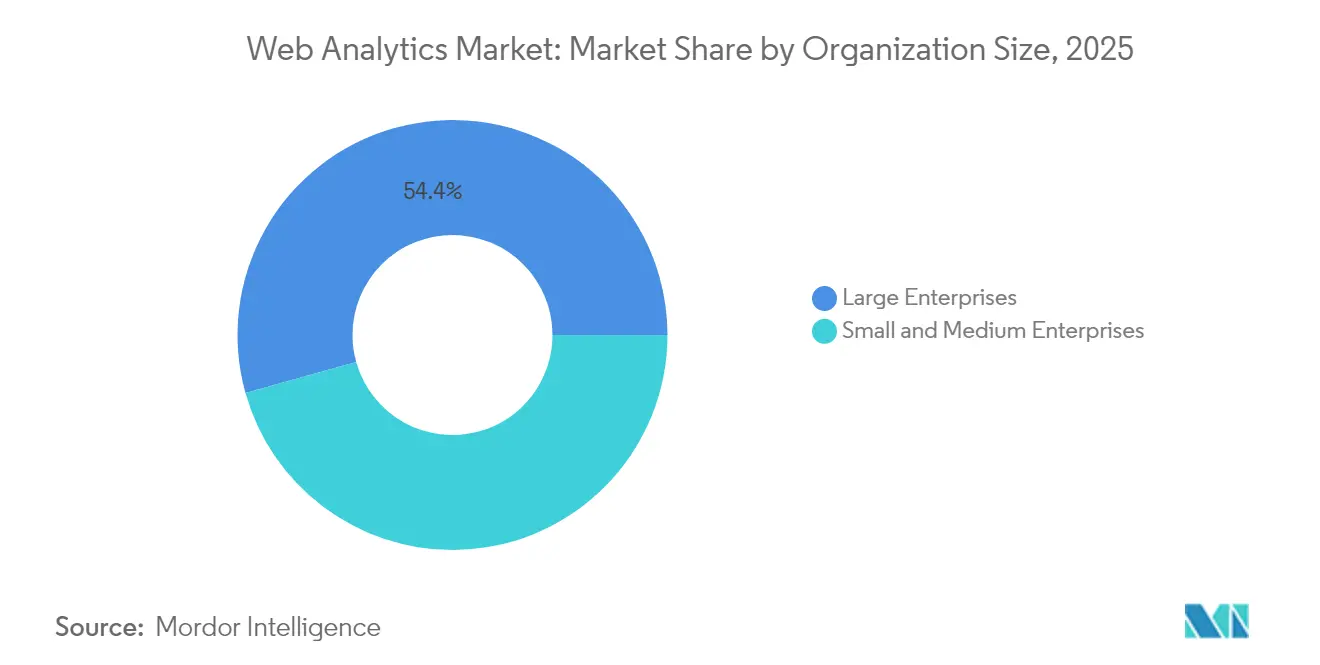
- By organization size, Large Enterprises commanded 54.35% share in 2025, while Small and Medium Enterprises are advancing at a 15.50% CAGR through 2031.
- By end-user vertical, Retail and E-commerce captured 28.10% share in 2025; Healthcare and Life Sciences is forecast to register a 16.00% CAGR through 2031.
- By geography, North America led with 37.75% share in 2025, whereas Asia Pacific is poised for the highest 15.70% CAGR to 2031.
Note: Market size and forecast figures in this report are generated using Mordor Intelligence’s proprietary estimation framework, updated with the latest available data and insights as of 2026.
Global Web Analytics Market Trends and Insights
Drivers Impact Analysis*
| Driver | (~) % Impact on CAGR Forecast | Geographic Relevance | Impact Timeline |
|---|---|---|---|
| Explosion of E-commerce Transaction Volumes | +3.2% | Global – North America and Asia Pacific | Medium term (2–4 years) |
| Rapid Adoption of Mobile and App-Based Analytics | +2.8% | Global – mobile-first Asia Pacific markets | Short term (≤ 2 years) |
| Shift Toward Data-Driven Marketing Automation | +2.5% | North America and Europe; expanding Asia Pacific | Medium term (2–4 years) |
| Rising Investment in Customer Experience Optimization | +2.1% | Global – enterprise focus in developed regions | Long term (≥ 4 years) |
| Emergence of Server-Side Tagging to Preserve First-Party Data | +1.9% | Europe and North America | Short term (≤ 2 years) |
| Integration of Privacy-Preserving Differential Privacy Techniques | +1.4% | Europe and North America; spillover Asia Pacific | Long term (≥ 4 years) |
| Source: Mordor Intelligence | |||
Explosion of E-commerce Transaction Volumes
Online retail volumes have soared, pushing analytics requirements beyond page views toward event-level capture of every product interaction and checkout micro-step.[1]CookieScript, “Is Your Cookie Consent Still Valid in 2025?,” cookie-script.com Retailers now deploy elastic cloud data pipelines that ingest millions of events per minute and return sub-second personalization responses. Granular data feeds empower sophisticated attribution models that link marketing touchpoints to lifetime value, a capability mid-market merchants previously lacked. As a result, Software-as-a-Service platforms that auto-scale during holiday peaks command increased share of new deployments. Real-time revenue dashboards using web analytics market data have become board-level KPIs for merchandising and supply-chain teams alike.
Rapid Adoption of Mobile and App-Based Analytics
Mobile analytics has shifted from crash logs to unified journey orchestration that stitches in-app events with web sessions. Brands trigger personalized browser offers the moment app users abandon carts, dissolving channel silos. Identity resolution across device IDs and cookies relies on consented first-party data, prompting investment in Customer Data Platforms that reconcile profiles while honoring platform privacy rules. Asia Pacific’s mobile-first economies showcase highest conversion uplifts, validating omnichannel budgeting models now rolling into North America and Europe. Enterprises prioritize SDK flexibility that lets them embed privacy prompts tailored to regional regulation without code rewrites.
Shift Toward Data-Driven Marketing Automation
Marketing automation is evolving into a closed-loop AI engine where web analytics signals feed predictive bidding, dynamic content, and lead scoring in real time.[2]Splunk, “2025 Predictions: Driving Digital Resilience Forward,” splunk.com Budget reallocation occurs automatically as campaigns underperform, slashing wasted ad spend. Open APIs and streaming connectors are vendor differentiators because integration latency now directly affects revenue. Enterprise buyers also insist on role-based access controls that let data governance teams enforce consent boundaries even as algorithms optimize thousands of micro-campaigns per hour. This convergence blurs the line between analytics and activation, accelerating platform consolidation.
Rising Investment in Customer Experience Optimization
Customer experience leaders correlate page load, form friction, and sentiment data to pre-empt churn.[3]MicroStrategy, “MicroStrategy Cloud Enables University of Auckland to Revolutionize Data Accessibility,” microstrategy.com Predictive alerts surface when behavior deviates from loyalty norms, enabling service teams to intervene before subscription downgrades occur. Telcos and SaaS providers embed real-time dashboards in frontline CRM screens, democratizing insights once limited to analyst teams. The shift from retrospective reporting to proactive experience engineering raises baseline data-quality expectations, further propelling cloud-based governance and lineage tooling. With lifetime value now the dominant metric, investment in advanced analytics migrates from discretionary marketing budgets to core operating expenses.
Restraints Impact Analysis*
| Restraint | (~) % Impact on CAGR Forecast | Geographic Relevance | Impact Timeline |
|---|---|---|---|
| Stringent Data Protection and Privacy Regulations | -1.8% | Europe (GDPR) and California; spreading worldwide | Medium term (2–4 years) |
| Cookie Deprecation Reducing Third-Party Tracking | -1.5% | Global – driven by Chrome browser changes | Short term (≤ 2 years) |
| Growing Popularity of Walled-Garden Ecosystems | -1.2% | Global digital advertising hubs | Medium term (2–4 years) |
| Shortage of Skilled Digital Analytics Professionals | -0.9% | Global – acute in North America and Europe | Long term (≥ 4 years) |
| Source: Mordor Intelligence | |||
Stringent Data Protection and Privacy Regulations
Regulators fine companies for misconfigured consent banners and illegal data transfers, turning compliance lapses into material risk. Enterprises respond by deploying server-side gateways that strip personal identifiers before analytics ingestion, yet architecture complexity inflates project timelines and services spend. Smaller firms gravitate toward turnkey privacy-centric vendors, while multinationals create internal privacy engineering teams. The uneven maturity widens performance gaps, with compliant first-party data strategies emerging as competitive moats in the web analytics market.
Cookie Deprecation Reducing Third-Party Tracking Capabilities
Chrome’s staged elimination of third-party cookies forces marketers to rebuild measurement on first-party identifiers and contextual signals. Legacy attribution models relying on cross-site tracking collapse, squeezing retargeting ROI. Analytics platforms innovate with browser APIs, cohort analysis, and differential privacy to preserve insight without violating user choice. Implementation costs rise, yet organizations that modernize early report stronger data accuracy and faster page loads, showcasing long-term upside despite short-term disruption.
*Our forecasts treat driver/restraint impacts as directional, not additive. The impact forecasts reflect baseline growth, mix effects, and variable interactions.
Segment Analysis
By Application: Customer Journey Orchestration Surges
Online Marketing and Marketing Automation accounted for 40.65% of 2025 revenue, underscoring its role as the baseline use case for the web analytics market. The segment benefits from direct budget linkage to revenue outcomes, driving enterprise retention rates. Customer Journey Mapping, on the other hand, posts the highest 15.95% CAGR as brands seek multi-touch attribution that lowers acquisition costs. This transition elevates demand for path analysis, session replay, and identity stitching.
The shift also unlocks upsell for AI-driven experimentation tools that personalize flows across devices. Customer Data Platforms integrate email, social, and call-center events, feeding unified dashboards consumed by growth and retention teams. As privacy rules tighten, vendors differentiate by embedding consent status flags into every journey visualization, an approach resonating with compliance-heavy sectors.


By Offering: Services Reflect Implementation Complexity
Solutions represented 63.85% of 2025 spending, anchored by licensing of data collection, visualization, and predictive modules. However, services display a 16.05% CAGR as enterprises engage consultants for server-side tagging, schema design, and consent workflow engineering. Advanced projects pair data scientists with privacy attorneys to validate model features before deployment, a multidisciplinary demand driving premium bill rates.
Managed services appeal to mid-market firms lacking internal skills, bundling infrastructure, monitoring, and regulatory updates into fixed monthly fees. Training engagements spike as marketing teams upskill on AI-assisted insight generation. Collectively, these trends elevate partner ecosystems as core components of vendor go-to-market strategies.
By Deployment Model: Cloud Becomes Default
Cloud-Based platforms captured a dominant 77.65% share in 2025 and exhibit the fastest 16.10% CAGR, affirming elasticity, high availability, and continuous feature delivery as decisive advantages. Multi-tenant architectures let vendors push privacy updates globally within hours, a pace impossible for on-premises stacks. For buyers, subscription pricing converts capital expenses into operating costs, aligning spend with traffic seasonality.
Highly regulated sectors still deploy on-premises collectors for sensitive data zones, yet hybrid schemes increasingly offload aggregated metrics to cloud visualization layers. Migration roadmaps now include latency SLAs as personalization moves nearer to edge locations. Vendor neutrality emerges as a procurement theme, prompting support for multi-cloud ingest pipelines that prevent lock-in while optimizing regional performance.
By Organization Size: SMEs Democratize Analytics
Large Enterprises held 54.35% share in 2025, driven by global websites, omnichannel complexity, and sizable experimentation budgets. Their roadmaps emphasize predictive churn scoring and algorithmic content recommendations that require deep data science integration. Small and Medium Enterprises, advancing at a 15.50% CAGR, benefit from template-based workspaces that hide schema complexity behind guided setup wizards.
Affordability and time-to-value steer SME selection toward no-code dashboards with automated insight summaries. As freemium tiers sunset under privacy cost pressures, vendors introduce usage-based pricing that scales from startup to scale-up. Community forums and marketplace connectors further reduce onboarding friction, closing capability gaps between resource-constrained firms and enterprise peers.
By End-User Vertical: Healthcare Digitalization Accelerates
Retail and E-commerce led 2025 adoption at 28.10%, capitalizing on direct revenue correlation between site performance and sales. Feature priorities include funnel visualization, inventory-aware personalization, and fraud detection. Healthcare and Life Sciences, forecast at a 16.00% CAGR, invest in patient portal analytics to enhance telehealth engagement and adherence tracking.
Manufacturers deploy dealer portal dashboards, while IT and Telecom operators optimize onboarding flows for new services. Financial institutions integrate consent-audited analytics into secure web banking, balancing CX innovation with strict regulatory mandates. Transportation and logistics firms gauge self-service shipment-tracking usage, improving call-center efficiency. Media companies tie cross-device viewership to ad inventory pricing, highlighting analytics’ revenue influence beyond marketing.
Geography Analysis
North America generated 37.75% of 2025 revenue, supported by mature ad ecosystems, high cloud adoption, and a deep bench of analytics talent. Enterprises exploit integrated suites that synchronize analytics with CRM, commerce, and workflow tools. Compliance investment remains high as enforcement around California’s CPRA intensifies, prompting upgrades to consent governance modules.
Europe experiences mid-teen growth as GDPR scrutiny pushes organizations toward first-party data strategies. Server-side tagging gains traction, and analytics spending shifts from marketing to privacy and IT budgets. Countries such as Germany and France favor domestic data centers, steering demand to vendors that offer local hosting options sanctioned for cross-border transfers. The web analytics market size for EU-hosted deployments is set to rise steadily through 2030.
Asia Pacific is the fastest-growing territory, clocking a 15.70% CAGR. Mobile-first economies in Southeast Asia and India spur adoption of lightweight SDKs that capture app events despite bandwidth constraints. Social commerce integration fuels path-to-purchase analysis, and regional super-app ecosystems require analytics engines capable of handling embedded payments, ride-sharing, and messaging in one funnel. Government digital-nation initiatives across Indonesia and Thailand further uplift adoption among public-sector portals.
The Middle East and Africa sees emerging momentum as broadband penetration widens. Investments cluster in Gulf Cooperation Council states, where financial services and travel operators modernize engagement tracking. South America posts steady gains, led by Brazil’s e-commerce boom and Argentina’s fintech expansion, fostering demand for cost-effective cloud analytics that circumvent legacy infrastructure.

Competitive Landscape
The web analytics market features moderate concentration. Google, Adobe, Microsoft, and Meta lean on platform lock-in, embedding analytics into ad networks, productivity suites, and content management systems. Seamless identity sync between ads, cloud storage, and BI dashboards drives stickiness. Meanwhile, focused vendors build privacy-first architectures that collect only consented events, winning deals in highly regulated sectors.
Competition pivots on three capabilities: compliant data capture, real-time personalization, and machine-learning extensibility. Vendors pursue strategic M&A to acquire point solutions-evidenced by Semrush integrating Ryte’s SEO analytics and Contentsquare merging with Hotjar to fuse UX heatmaps with behavioral data. AI infusion distinguishes offerings, with anomaly detection, natural-language query, and auto-generated insights becoming table stakes.
Customer Data Platform convergence reshapes product roadmaps. Providers embed CDP modules to unify multi-touch identifiers, reducing the integration tax for buyers. Open ecosystem strategies gain favor, exposing APIs that let partners build consent orchestration, A/B testing, and attribution apps atop core data stores. Services alliances flourish, as consultancies certify teams on vendor stacks to meet soaring implementation demand.
Regulation turns compliance into a sales lever. Vendors that secure ISO-certified regional hosting, on-premises collectors, and encryption-in-use options shorten procurement cycles. Conversely, providers slow to release cookieless measurement or differential privacy fall out of shortlists. The cumulative effect produces a landscape where scale and innovation must coexist, keeping barriers to entry high but not insurmountable.
Web Analytics Industry Leaders
Google LLC
Webtrends Inc.
Adobe Systems Incorporated.
Meta Platforms Inc.
Tableau Software LLC
- *Disclaimer: Major Players sorted in no particular order


Recent Industry Developments
- January 2025: MicroStrategy and STACKIT launched the MicroStrategy Sovereign European Cloud, enabling EU-regulated enterprises to adopt AI-powered analytics within German and Austrian data centers.
- January 2025: MicroStrategy was named a Customers’ Choice in Gartner Peer Insights’ 2024 “Voice of the Customer” for Analytics and Business Intelligence Platforms.
- December 2024: Splunk released its “2025 Predictions” report, forecasting a shift from generative AI experimentation to ROI-driven analytics.
- November 2024: Microsoft updated Power BI pricing to align platform cost with enterprise value delivery.


Global Web Analytics Market Report Scope
Web analytics is the process of analyzing the behavior of visitors to a website. This process includes the collection, assessment, and coverage of web data created from these interfaces that deliver perceptions of the demand and interest of customers. Further, web analytics also help to improve marketing strategies through the data collected to interpret the customer's geographic distribution. With web analytics, businesses across the globe can attract more visitors, retain their customers and attract new customers for goods or services, and most importantly, increase the dollar amount each customer spends. The report offers a comprehensive view of the market based on geography, market segmentation, and key players' performance.
The web analytics market is segmented by application (online marketing & marketing automation, mobile analytics, content marketing, social media management, e-mail marketing, and other applications), offering (solution and services), end-user vertical (retail, manufacturing, information technology, BFSI, healthcare, transportation & logistics, and other end-user verticals), and geography (North America, Europe, Asia Pacific, Latin America, and Middle East and Africa). The report offers market forecasts and size in value (USD) for all the above segments.
| Online Marketing and Marketing Automation |
| Mobile Analytics |
| Content Marketing |
| Social Media Management |
| Email Marketing |
| Multichannel Campaign Analysis |
| Personalization and A/B Testing |
| Customer Journey Mapping and Other Applications |
| Solutions |
| Services |
| Cloud-Based |
| On-Premises |
| Large Enterprises |
| Small and Medium Enterprises |
| Retail and E-commerce |
| Manufacturing |
| Information Technology and Telecom |
| Banking Financial Services and Insurance |
| Healthcare and Life Sciences |
| Transportation and Logistics |
| Media and Entertainment and Other End-User Verticals |
| North America | United States |
| Canada | |
| Mexico | |
| South America | Brazil |
| Argentina | |
| Rest of South America | |
| Europe | Germany |
| United Kingdom | |
| France | |
| Italy | |
| Spain | |
| Rest of Europe | |
| Asia Pacific | China |
| Japan | |
| India | |
| South Korea | |
| Australia and New Zealand | |
| Rest of Asia Pacific | |
| Middle East | United Arab Emirates |
| Saudi Arabia | |
| Turkey | |
| Rest of Middle East | |
| Africa | South Africa |
| Egypt | |
| Nigeria | |
| Rest of Africa |
| By Application | Online Marketing and Marketing Automation | |
| Mobile Analytics | ||
| Content Marketing | ||
| Social Media Management | ||
| Email Marketing | ||
| Multichannel Campaign Analysis | ||
| Personalization and A/B Testing | ||
| Customer Journey Mapping and Other Applications | ||
| By Offering | Solutions | |
| Services | ||
| By Deployment Model | Cloud-Based | |
| On-Premises | ||
| By Organization Size | Large Enterprises | |
| Small and Medium Enterprises | ||
| By End-User Vertical | Retail and E-commerce | |
| Manufacturing | ||
| Information Technology and Telecom | ||
| Banking Financial Services and Insurance | ||
| Healthcare and Life Sciences | ||
| Transportation and Logistics | ||
| Media and Entertainment and Other End-User Verticals | ||
| By Geography | North America | United States |
| Canada | ||
| Mexico | ||
| South America | Brazil | |
| Argentina | ||
| Rest of South America | ||
| Europe | Germany | |
| United Kingdom | ||
| France | ||
| Italy | ||
| Spain | ||
| Rest of Europe | ||
| Asia Pacific | China | |
| Japan | ||
| India | ||
| South Korea | ||
| Australia and New Zealand | ||
| Rest of Asia Pacific | ||
| Middle East | United Arab Emirates | |
| Saudi Arabia | ||
| Turkey | ||
| Rest of Middle East | ||
| Africa | South Africa | |
| Egypt | ||
| Nigeria | ||
| Rest of Africa | ||


Key Questions Answered in the Report
How large is the web analytics market in 2026?
The web analytics market size is USD 9.19 billion in 2026 with a projected 15.18% CAGR to 2031.
Which deployment model is growing fastest?
Cloud-Based platforms show the highest 16.10% CAGR, reflecting enterprise demand for elastic scale and rapid feature delivery.
What application segment is expanding most quickly?
Customer Journey Mapping leads growth with a 15.95% CAGR as companies focus on multi-touch attribution.
Which region offers the highest growth potential?
Asia Pacific registers the fastest 15.70% CAGR thanks to mobile-first consumers and e-commerce expansion.
How are privacy regulations affecting adoption?
GDPR and CPRA enforcement push enterprises toward server-side tagging and first-party data strategies, influencing vendor selection and services demand.
What drives services spending in this space?
Complex implementations involving consent governance, server-side tagging, and AI integration fuel a 16.05% CAGR in services revenue.
Page last updated on:


