Content Analytics Market Size and Share
Market Overview
| Study Period | 2020 - 2031 |
|---|---|
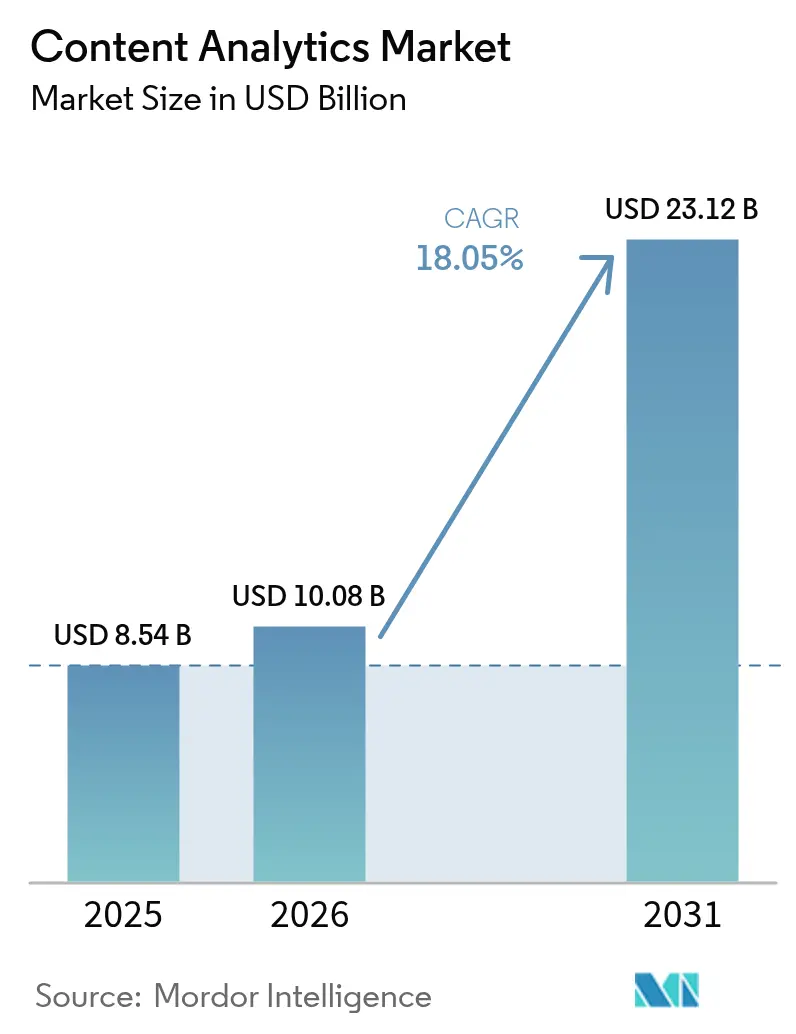
| Market Size (2026) | USD 10.08 Billion |
| Market Size (2031) | USD 23.12 Billion |
| Growth Rate (2026 - 2031) | 18.05% CAGR |
| Fastest Growing Market | Asia Pacific |
| Largest Market | North America |
| Market Concentration | Medium |
Major Players *Disclaimer: Major Players sorted in no particular order Image © Mordor Intelligence. Reuse requires attribution under CC BY 4.0. | |
Content Analytics Market Analysis by Mordor Intelligence
The Content Analytics Market size was valued at USD 8.54 billion in 2025 and estimated to grow from USD 10.08 billion in 2026 to reach USD 23.12 billion by 2031, at a CAGR of 18.05% during the forecast period (2026-2031). Accelerating cloud migration, rapid adoption of multimodal AI, and the convergence of vector search with semantic embedding technologies are reshaping how enterprises extract value from unstructured information. Public cloud deployments, real-time social listening, and large-language-model-powered “knowledge mining” pipelines are lowering entry barriers and encouraging experimentation. At the same time, demand is rising for hybrid architectures that balance data-sovereignty mandates with the scale advantages of hyperscale AI platforms. Intensifying competition among retail, media, and BFSI incumbents is pushing vendors toward verticalized solutions that promise faster time-to-value and measurable productivity gains. Together, these factors suggest that the content analytics market will keep outpacing broader enterprise-software spending through the forecast window.
Key Report Takeaways
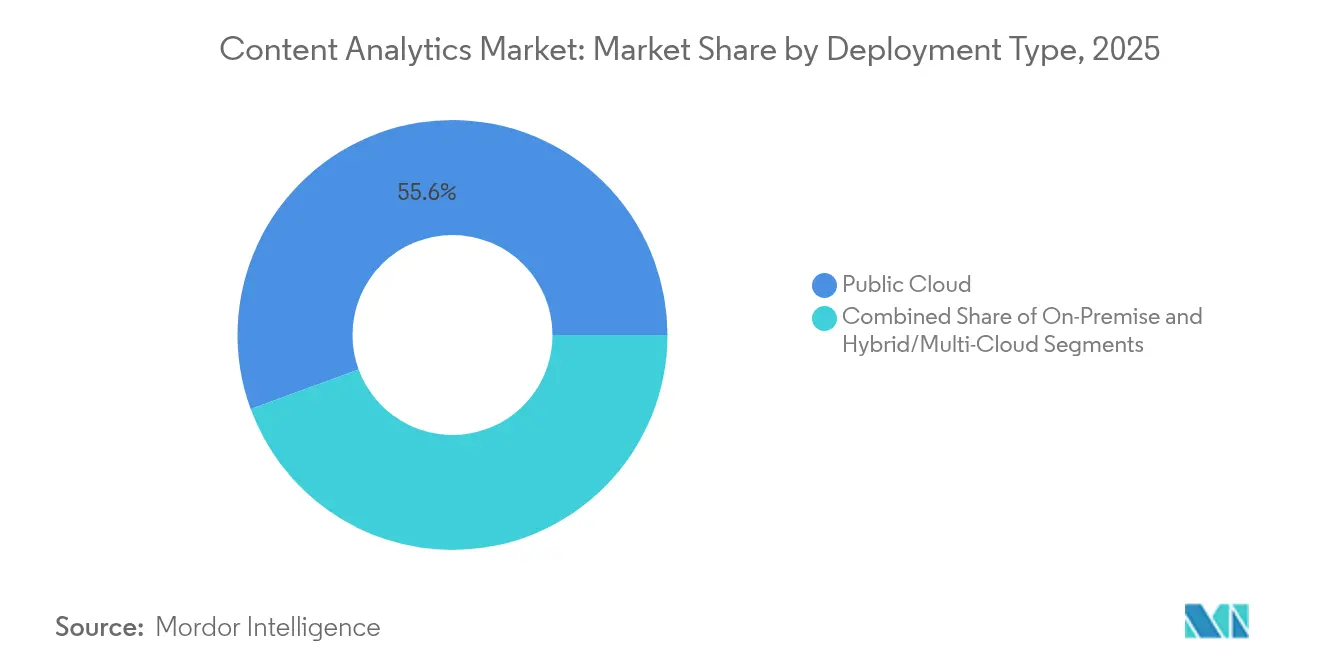
- By deployment type, public cloud led with 55.60% revenue share in 2025, while hybrid and multi-cloud posted the highest projected CAGR at 20.7% through 2031.
- By application, social media analytics accounted for 33.10% of the content analytics market share in 2025, whereas speech and audio analytics are set to expand at a 19.9% CAGR to 2031.
- By end-user industry, retail and consumer goods held 26.00% of 2025 revenue, while media and entertainment is on track for the fastest 19.8% CAGR.
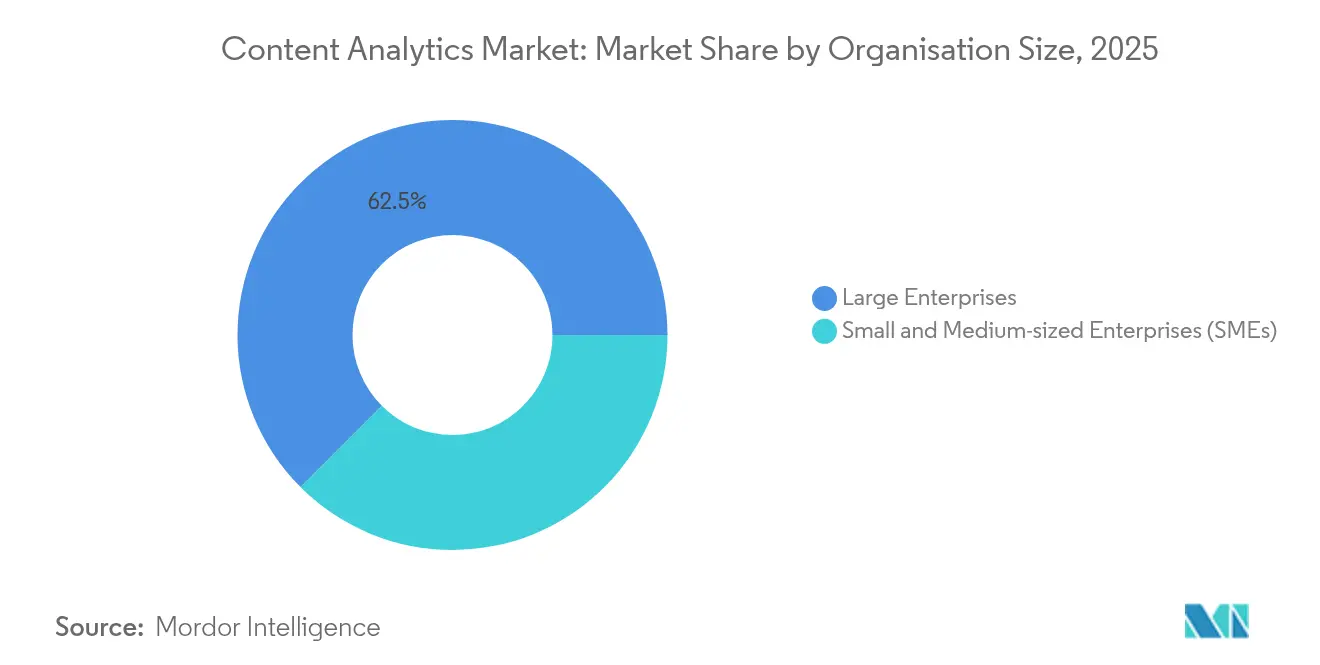
- By organisation size, large enterprises commanded 62.50% of 2025 spending, yet small and medium enterprises are forecast to grow at 21.6% CAGR as cloud-native offerings mature.
- By content type, text maintained 40.70% processing volume in 2025, but multimodal analytics is accelerating at 20.1% CAGR.
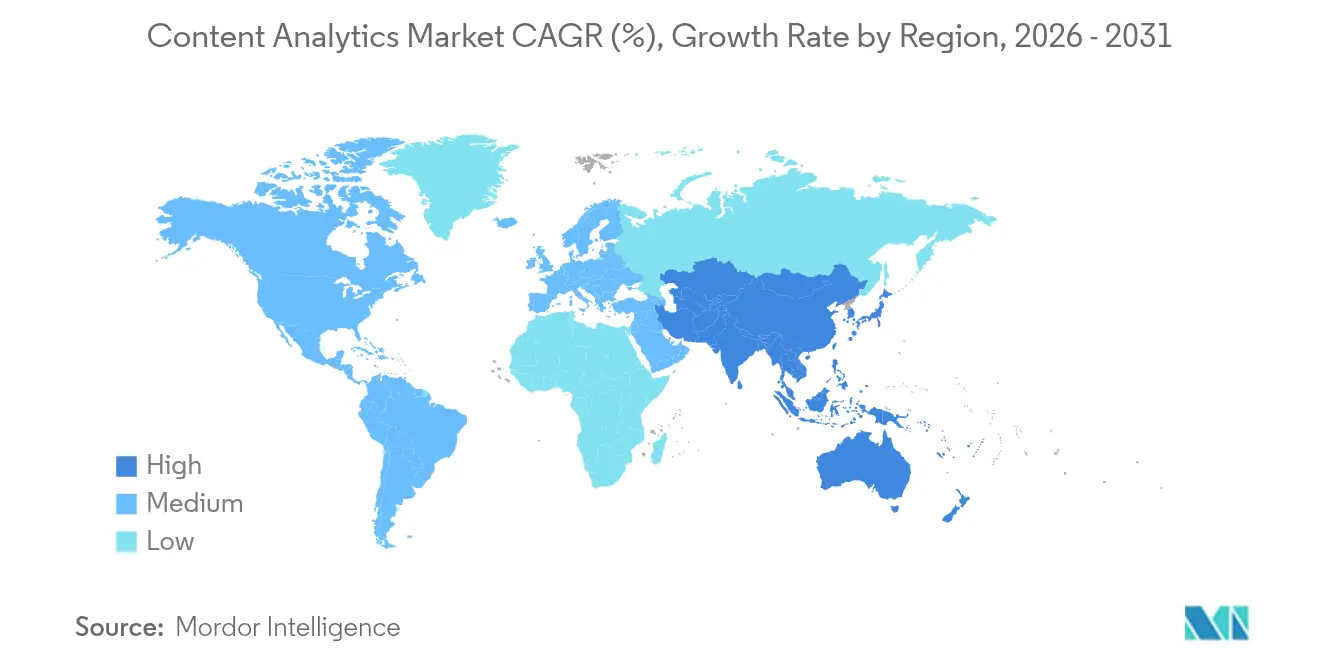
- By geography, North America retained a 37.70% share in 2025; Asia-Pacific is the fastest-growing region with a 21.0% CAGR.
Note: Market size and forecast figures in this report are generated using Mordor Intelligence’s proprietary estimation framework, updated with the latest available data and insights as of 2026.
Global Content Analytics Market Trends and Insights
Drivers Impact Analysis*
| Driver | (~) % Impact on CAGR Forecast | Geographic Relevance | Impact Timeline |
|---|---|---|---|
| Exponential growth of unstructured enterprise data | +3.2% | Global, APAC leading volume growth | Medium term (2-4 years) |
| Surging adoption of cloud-based analytics platforms | +2.8% | North America and EU early adoption, APAC rapid scaling | Short term (≤ 2 years) |
| Real-time social media listening for brand reputation | +2.1% | Global, concentrated in consumer-facing industries | Short term (≤ 2 years) |
| Vector search and semantic embedding unlock deeper insights | +1.9% | Technology hubs in US, China, EU | Medium term (2-4 years) |
| Multimodal (text-image-video) analytics in GenAI workflows | +1.7% | Global, led by media and retail sectors | Long term (≥ 4 years) |
| e-Discovery compliance pressures in regulated industries | +1.5% | North America, EU, with regulatory spillover globally | Medium term (2-4 years) |
| Source: Mordor Intelligence | |||
Exponential Growth of Unstructured Enterprise Data
Unstructured information already represents the majority of corporate memory, with 80% of the 175 zettabytes expected in 2025 originating outside relational systems. [1]Ran Zhou, “Vector Search in the Lakehouse: Unlocking Unstructured Data,” e6data, e6data.com Health-care providers, for example, digitized millions of images and charts to unlock real-time clinical insight while eliminating physical storage costs. [2]Iron Mountain Case Study Team, “Digitization Cures Medical Records to Optimize Patient Care,” Iron Mountain, ironmountain.com These volumes are pushing enterprises toward lakehouse architectures that embed vector functions inside familiar SQL engines, allowing knowledge workers to ask semantic questions against documents, chat logs, and medical scans in the same query.
Surging Adoption of Cloud-Based Analytics Platforms
Public-cloud AI services let enterprises rent transformer-scale models on demand, avoiding capital expenditure on specialized hardware. Amazon Web Services recorded USD 33.5 billion in Q1 2025 sales, up 17% year on year, driven largely by analytics workloads. Hybrid patterns are now mainstream as firms split workloads across providers to optimize for latency, cost, and jurisdictional compliance. Google BigQuery and Microsoft Knowledge Mining pipelines are anchoring this shift by abstracting infrastructure while exposing vector search APIs.
Real-Time Social Media Listening for Brand Reputation
Sixty percent of global social-media users reside in Asia-Pacific, creating vast, fast-moving data streams. Enterprises pipe live posts, images, and short-form videos into sentiment models that trigger granular ad bidding or product-availability updates within minutes. Retailers integrating social signals with transaction data saw 6.2% conversion-rate lifts in grocery segments.
Vector Search and Semantic Embedding Unlock Deeper Insights
Embedding-based retrieval replaces brittle keyword matching with context-aware similarity reasoning. Google’s Gemini family demonstrates near-expert performance across text, image, and audio tasks, catalyzing demand for cross-modal knowledge graphs. Financial services, life sciences, and regulated industries rely on these graphs to surface hidden relationships among contracts, medical imagery, and emailed directives, shortening disclosure cycles and enhancing compliance monitoring.
Restraints Impact Analysis*
| Restraint | (~) % Impact on CAGR Forecast | Geographic Relevance | Impact Timeline |
|---|---|---|---|
| Shortage of data-literate workforce and change management gaps | -2.3% | Global, most acute in emerging markets | Long term (≥ 4 years) |
| Escalating data-privacy and data-sovereignty regulations | -1.8% | EU leading, North America following, APAC showing fragmented rules | Medium term (2-4 years) |
| High energy and carbon footprint of large-scale AI pipelines | -1.4% | Global, concentrated in data center regions | Medium term (2-4 years) |
| Fragmentation of content formats and lack of standardisation | -1.1% | Global, varying by industry vertical | Long term (≥ 4 years) |
| Source: Mordor Intelligence | |||
Shortage of Data-Literate Workforce and Change Management Gaps
Only 37% of technology leaders judge generative AI as valuable today, largely because firms struggle to translate prototypes into scaled workflows. [3]Katie Tarasov, “Companies Are Bullish on AI but Skeptical of Payoff,” CNBC, cnbc.com Federal Reserve research shows AI uptake ranging from 5% to 40% across companies, highlighting the skills dispersion in data engineering, model governance, and domain-specific prompt design. Without targeted reskilling programs, analytics value realisation risks stalling despite abundant vendor offerings.
Escalating Data-Privacy and Sovereignty Regulations
Seventy-five percent of professionals identify privacy compliance as the top AI deployment concern. The European Corporate Sustainability Reporting Directive alone brings 3,200 US firms under new disclosure mandates from fiscal 2026, forcing architecture redesigns that partition data by jurisdiction. China’s strategy of shipping training data offshore for model refinement, then repatriating the resulting weights, illustrates the operational complexity now baked into expansion planning.
*Our forecasts treat driver/restraint impacts as directional, not additive. The impact forecasts reflect baseline growth, mix effects, and variable interactions.
Segment Analysis
By Deployment Type: Hybrid Strategies Balance Control and Scale
Public-cloud services captured 55.60% revenue in 2025 as enterprises sought frictionless access to transformer-class models. This share underscores the cost-efficiency and elasticity advantages that cloud hyperscalers continue to refine. The content analytics market size for public-cloud workloads is projected to climb steeply on the back of managed feature stores, model hubs, and enterprise prompts libraries. Hybrid and multi-cloud deployments are on a 20.7% CAGR trajectory because firms must reconcile latency-sensitive use cases with data-residency statutes. In regulated sectors, on-premise appliances remain indispensable for workloads requiring deterministic throughput or sovereign control.
Enterprises increasingly position vector indexes at the edge while offloading heavy embedding generation to cloud GPUs, achieving policy compliance without sacrificing insight depth. Vendors now bundle observability dashboards that score pipeline health across private and public endpoints, a trend that strengthens the content analytics market’s resilience to single-provider outages.


By Application: Speech Analytics Accelerates
Social media monitoring retained a 33.10% share in 2025, reflecting mature adoption of brand-listening suites and influencer tracking modules. Yet contact-center automation, real-time transcription, and voice biometrics are pushing speech and audio analytics toward a 19.9% CAGR, the fastest among tracked segments. The content analytics market size for speech-centric tools is scaling as voice assistants proliferate across banking, travel, and healthcare kiosks. High-quality automatic speech recognition feeds multi-modal dashboards where tone, sentiment, and intent scores guide agent coaching or trigger escalation workflows.
Text analytics remains essential for contractual review and compliance flagging, while video-centric pipelines serve loss-prevention and streaming-content optimisation. Convergence is gaining speed as social-video clips, call-center transcriptions, and user-posted images are routed into the same model garden. The industry narrative, therefore, shifts away from siloed products toward cohesive experience engines, reinforcing long-term growth prospects for the content analytics market.
By End-user Industry: Media and Entertainment Narrows the Gap
Retail and consumer goods accounted for 26.00% of expenditure in 2025 because personalization engines and shelf-level monitoring deliver measurable revenue uplift. However, automated storyboarding, talent-matching, and trailer optimisation set the stage for media and entertainment to advance at a 19.8% CAGR. Competitive pressures to reduce production cycles have sparked aggressive experimentation with script-to-screen AI workflows, positioning studios and streamers as major downstream consumers in the content analytics market.
Other sectors remain active adopters. BFSI institutions employ graph-based fraud alerting that builds on transactional embeddings, while healthcare pairs diagnostic imaging with clinical notes to enhance evidence-based care. Oil and gas firms deploy generative AI for well-integrity documentation, proving that domain-trained models can unlock niche operational efficiency. These patterns validate cross-industry breadth within the content analytics industry, even though spend concentration still skews toward sectors with direct consumer engagement.
By Organisation Size: SMEs Adopt Cloud-Native Suites
Large enterprises held 62.50% market revenue in 2025 because they can fund multi-year roadmaps that integrate analytics with ERP and CRM backbones. They also command the data volume that lucrative insight engines require. Small and medium enterprises, however, are forecast to grow usage at 21.6% CAGR as turnkey SaaS packages abstract model orchestration, governance, and continuous-integration complexity. This democratisation ensures that competitive advantage no longer depends on owning clusters of GPUs, a change that broadens the addressable base for vendors across the content analytics market.
Vendors cater to SMEs with vertical starter kits—out-of-box sentiment analysis for hospitality, micro-influencer scouting for consumer brands, or case-law summarisation for boutique legal practices. Subscription pricing, pay-per-document tiers, and low-code integration blueprints reduce initial commitment. The resulting ecosystem effect funnels fresh data back into shared embeddings stores, enriching the benchmarks that power next-generation releases.
By Content Type: Multimodal Workflows Reshape Foundations
Text accounted for 40.70% processing throughput in 2025, benefiting from mature NLP toolchains and enterprise familiarity. Multimodal and composite analysis, however, is surging at a 20.1% CAGR as users expect coherent answers spanning chat transcripts, product images, and support videos. Inside the content analytics market, teams now route heterogeneous payloads to unified embedding layers that preserve cross-modal context.
Image pipelines leverage CLIP-style encoders for visual similarity, while audio segments feed diarisation models that stitch speaker changes to event metadata. Video frames undergo object detection, then are linked to sentiment tags extracted from concurrent comments. This context blending produces richer downstream dashboards and creates new IP in prompt-template libraries. Forward-leaning adopters thus position multimodal capacity as a prerequisite for AI maturity assessments, amplifying growth across the content analytics market.
Geography Analysis
North America held 37.70% revenue share in 2025 because early cloud adoption produced mature data-science talent pools and extensive third-party marketplace ecosystems. Major providers like AWS drove double-digit percentage growth by bundling advanced vector search primitives into serverless databases, raising the entry barrier for regional challengers. Technology buyers benefit from a stable regulatory backdrop, although impending European ESG-reporting mandates already affect thousands of US multinationals that must align disclosure pipelines accordingly. The region’s spend mix spans financial services, health-tech, and direct-to-consumer retail, ensuring diversified momentum for the content analytics market.
Asia-Pacific is the fastest-growing territory, expected to clock a 21.0% CAGR through 2031. Government-backed infrastructure projects, including Hong Kong’s 3,000-petaflops supercomputing centre and India’s USD 1.3 billion compute strategy, provision the GPU density required for multimodal and large-language model workloads. Social-media penetration across WeChat, LINE, and Douyin ensures abundant vernacular data that accelerates fine-tuning cycles. Regional cloud providers are racing to deliver sovereign AI zones to meet localisation rules, a move likely to preserve high services revenue inside domestic value chains.
Europe advances steadily despite fragmented privacy regimes. Seventy-five percent of professionals cite regulation as their biggest AI hurdle, yet the region leads in privacy-preserving analytics such as federated learning. Automotive, industrial, and energy sectors align with academic labs to commercialise lightweight multimodal models that run on embedded hardware, reinforcing manufacturing competitiveness. Private investment still trails North American and Chinese levels, motivating policy debate on strategic AI autonomy.
Middle East and Africa show emerging momentum in public-sector digitalisation and fintech. Limited local GPU availability has spurred interest in edge accelerators that minimise data egress. Latin America mirrors this trend, with retail payment disruptors and urban-safety agencies embracing SaaS voice analytics. Although smaller in absolute terms, these regions contribute incremental demand that diversifies vendor revenue streams and mitigates geographic concentration risk in the global content analytics market.

Competitive Landscape
Market concentration remains moderate as platform hyperscalers, established enterprise-software vendors, and specialist boutiques jostle for share. AWS, Microsoft, and Google embed multimodal embedding layers into storage, workflow, and BI products, leveraging scale to bundle data residency, billing, and compliance into single contracts. Anthropic’s collaboration with Amazon Q Connect illustrates how tightly integrated LLMs reduce agent handling time by 10-15%. Such efficiency gains widen the moat for cloud incumbents.
Specialist vendors differentiate on vertical depth. SLB developed generative AI blueprints for well-integrity documentation, reducing investigation duration for oilfield engineers. Palantir pushes configurable ontology layers that appeal to defence and health agencies that need granular access controls. Smaller players focus on focal use-cases such as toxic-speech detection or AI code review, then partner with hyperscalers for distribution. Intellectual-property filings in vector compression and bias mitigation signal that patents will play a larger role in safeguarding margins as commoditisation accelerates.
Channel alliances matter because buyers prefer integrated stacks. Applied Industrial Technologies’ acquisition of IRIS Factory Automation strengthens process-automation portfolios that feed analytics engines with shop-floor images. Retail brands Oh Polly and AllSaints selected Algolia and Dixa, respectively, to modernise digital experiences, showcasing demand for composable front-end intelligence that plugs into existing ERP foundations.
Future competition will intensify around edge deployments, regulatory tech, and carbon-efficient inference. The influx of open-source multimodal models lowers barriers for challengers, while capital-intensive inference clusters sustain entry hurdles. As a result, incumbents with strong channel reach and proprietary usage telemetry possess a defensible advantage, though niche innovators will continue to disrupt single-function categories within the content analytics market.
Content Analytics Industry Leaders
Adobe Inc.
Alphabet Inc. (Google Cloud)
Amazon Web Services, Inc.
Apache Software Foundation (OpenSearch)
Apple Inc. (Apple Analytics)
- *Disclaimer: Major Players sorted in no particular order


Recent Industry Developments
- June 2025: Hong Kong confirmed a second AI supercomputing centre to complement the 3,000-petaflops Cyberport facility, reinforcing regional AI capacity.
- June 2025: Amazon posted Q1 2025 AWS revenue of USD 33.5 billion, up 17% year on year, driven by analytics demand, though free cash flow slipped amid rising AI capex.
- June 2025: Palo Alto Networks recorded USD 2.29 billion Q2 2025 revenue with a 15% increase and highlighted plans to hit USD 15 billion ARR by 2030 through AI-centric security.
- June 2025: Serverworks launched a generative-AI proof-of-concept for Japanese call centres, featuring auto-summarisation and advanced document search.
- June 2025: Oh Polly deployed Algolia AI search, improving e-commerce conversions via personalised discovery.
- June 2025: AllSaints rolled out Dixa’s customer-experience suite and partnered with NewStore for unified commerce.
- May 2025: Applied Industrial Technologies acquired IRIS Factory Automation, reporting USD 1.2 billion net sales and expanding process-automation reach.
- April 2025: Google Cloud demonstrated CodeRabbit AI code review on Cloud Run, showcasing serverless scalability for continuous delivery pipelines.


Research Methodology Framework and Report Scope
Market Definitions and Key Coverage
According to Mordor Intelligence, the content analytics market includes all software platforms and managed services that ingest digital text, image, audio, or video assets, apply natural-language processing or computer-vision algorithms, and return actionable insights for marketing, compliance, customer experience, or product decisions. Analytics functions bundled inside creative authoring suites are counted only when sold as discrete modules; generic business intelligence, manual tagging, and pure storage tools are excluded.
Scope exclusion: Stand-alone data warehouses or human-only transcription services are outside this study.
Segmentation Overview
- By Deployment Type
- On-Premise
- Public Cloud
- Hybrid/Multi-Cloud
- By Application
- Text Analytics
- Video Analytics
- Social Media Analytics
- Speech/Audio Analytics
- Web and Document Analytics
- By End-user Industry
- BFSI
- Healthcare and Life Sciences
- Retail and Consumer Goods
- IT and Telecom
- Manufacturing
- Government and Public Sector
- Media and Entertainment
- Other End-user Industries
- By Organisation Size
- Large Enterprises
- Small and Medium-sized Enterprises (SMEs)
- By Content Type
- Text
- Image
- Audio
- Video
- Multimodal/Composite
- By Geography
- North America
- United States
- Canada
- Mexico
- South America
- Brazil
- Argentina
- Chile
- Rest of South America
- Europe
- Germany
- United Kingdom
- France
- Italy
- Spain
- Russia
- Rest of Europe
- Asia-Pacific
- China
- India
- Japan
- South Korea
- Singapore
- Malaysia
- Australia
- Rest of Asia-Pacific
- Middle East and Africa
- Middle East
- United Arab Emirates
- Saudi Arabia
- Turkey
- Rest of Middle East
- Africa
- South Africa
- Nigeria
- Rest of Africa
- Middle East
- North America
Detailed Research Methodology and Data Validation
Primary Research
Mordor analysts interviewed product managers at cloud-native analytics vendors, digital marketing leads in retail and BFSI, and system integrator partners across North America, Europe, and Asia Pacific. Their inputs clarified average selling prices, freemium-to-paid conversion rates, and regional deployment preferences, which helped us validate secondary estimates and fine-tune growth assumptions.
Desk Research
We began with open datasets that track the raw drivers of content volume, international web traffic from ITU, social media user counts from DataReportal, and enterprise cloud spend from the U.S. Bureau of Economic Analysis. We then complemented them with patent trends from Questel and shipment-level SaaS listings scraped through Volza. Company filings, investor decks, and trade association papers such as IAB's measurement benchmarks provided price bands and vertical adoption clues. These sources establish baselines that frame our subsequent model; the list is illustrative, not exhaustive.
Market-Sizing & Forecasting
The model starts with a top-down reconstruction that scales global enterprise software outlays by the share allocated to unstructured content insight tools, then adjusts for penetration into addressable industries. Results are cross-checked through selective bottom-up supplier roll-ups and channel checks on cloud marketplace billings. Key variables include: (1) monthly active social media users, indicating analysis workloads; (2) cost per thousand API calls for text and vision services, shaping revenue; (3) share of enterprises pursuing omnichannel personalization, signaling demand intensity. Multivariate regression paired with scenario analysis projects these inputs to 2030 while capturing economic cycles. Data gaps, for instance in private vendor revenue splits, are bridged using anonymized survey medians that are re-vetted during peer review.
Data Validation & Update Cycle
Before sign-off, outputs pass three rounds of variance and anomaly screening, followed by a senior analyst review. We refresh every twelve months and issue interim pulses whenever material events, large funding rounds, regulatory shifts, or major product sunsets alter market structure. Clients therefore receive the latest validated view.
Why Mordor's Content Analytics Baseline Commands Trusted Decision Making
Published figures usually diverge because firms pick dissimilar scopes, pricing ladders, and refresh cadences. Our disciplined selection of functional boundaries and annually updated variables narrows that gap.
Benchmark comparison
| Market Size | Anonymized source | Primary gap driver |
|---|---|---|
| USD 8.54 B (2025) | Mordor Intelligence | - |
| USD 11.16 B (2025) | Global Consultancy A | Bundles digital asset management and professional services revenue, inflating totals |
| USD 11.03 B (2025) | Industry Association B | Relies on vendor reported surveys without churn adjustment; counts generative AI creators as analytics |
The comparison shows that once overlapping adjacent solutions and unvalidated self-reports are stripped away, Mordor's carefully bounded, regularly refreshed baseline offers a balanced and reproducible foundation for strategic planning.


Key Questions Answered in the Report
What is the current size of the content analytics market?
The market stands at USD 10.08 billion in 2026 and is projected to reach USD 23.12 billion by 2031, reflecting an 18.05% CAGR.
Which deployment model is expanding fastest?
Hybrid and multi-cloud configurations are advancing at a 20.7% CAGR as firms balance data-sovereignty mandates with hyperscale AI capacity.
Which application shows the highest growth momentum?
Speech and audio analytics lead with a 19.9% CAGR, fueled by contact-center automation and voice-enabled customer service.
Which region is poised for the quickest expansion?
Asia-Pacific is projected to grow at a 21.0% CAGR through 2031, supported by large-scale AI infrastructure investments.
What is the main driver behind enterprise adoption of content analytics?
The explosive rise of unstructured data—estimated to hit 80% of 175 zettabytes in 2025—demands vector-based semantic processing for actionable insight.
How are small and medium enterprises benefiting from content analytics?
SMEs are adopting cloud-native suites at a 21.6% CAGR, gaining enterprise-grade AI capabilities without heavy capital outlays.
Page last updated on:


