Analytics As A Service Market Size and Share
Market Overview
| Study Period | 2020 - 2031 |
|---|---|
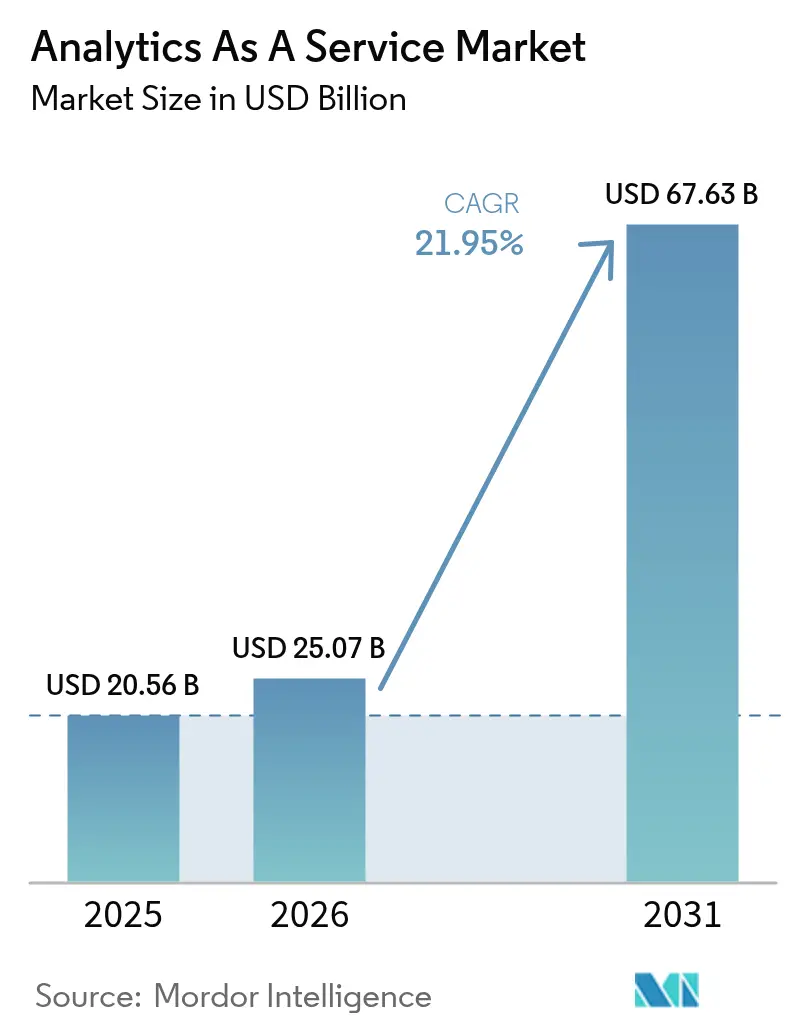
| Market Size (2026) | USD 25.07 Billion |
| Market Size (2031) | USD 67.63 Billion |
| Growth Rate (2026 - 2031) | 21.95% CAGR |
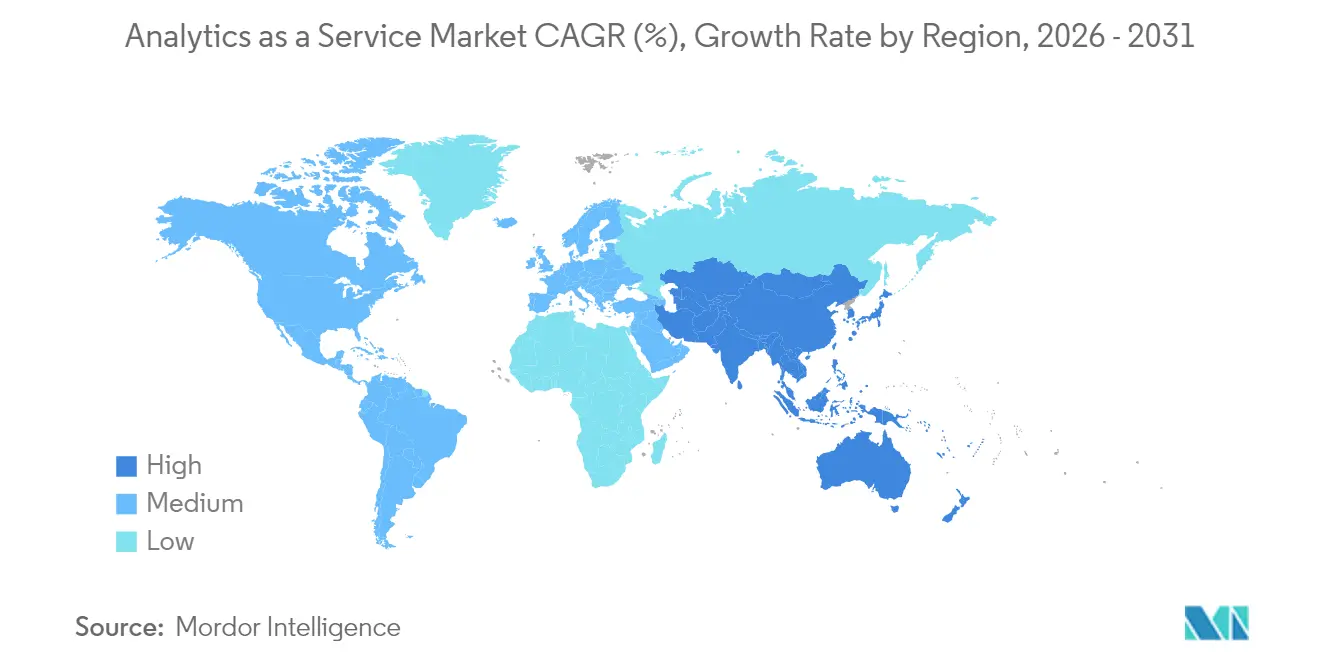
| Fastest Growing Market | Asia Pacific |
| Largest Market | North America |
| Market Concentration | Medium |
Major Players *Disclaimer: Major Players sorted in no particular order Image © Mordor Intelligence. Reuse requires attribution under CC BY 4.0. | |
Analytics As A Service Market Analysis by Mordor Intelligence
The Analytics as a Service market size is expected to grow from USD 20.56 billion in 2025 to USD 25.07 billion in 2026 and is forecast to reach USD 67.63 billion by 2031 at 21.95% CAGR over 2026-2031. Demand is rising because cloud-first data-modernization programs allow enterprises to retire on-premises analytics stacks and shift to pay-as-you-go services. The fast spread of vector-native data stores is also enabling real-time processing of unstructured data for generative AI. Public cloud deployments lead today, yet hybrid strategies are advancing as firms balance cost control with data-sovereignty rules. Competitive intensity is mounting as hyperscale platforms deepen AI capabilities while specialist providers focus on vertical solutions and embedded analytics. Talent shortages and data-egress economics, however, continue to influence implementation timelines and ROI calculations.
Key Report Takeaways
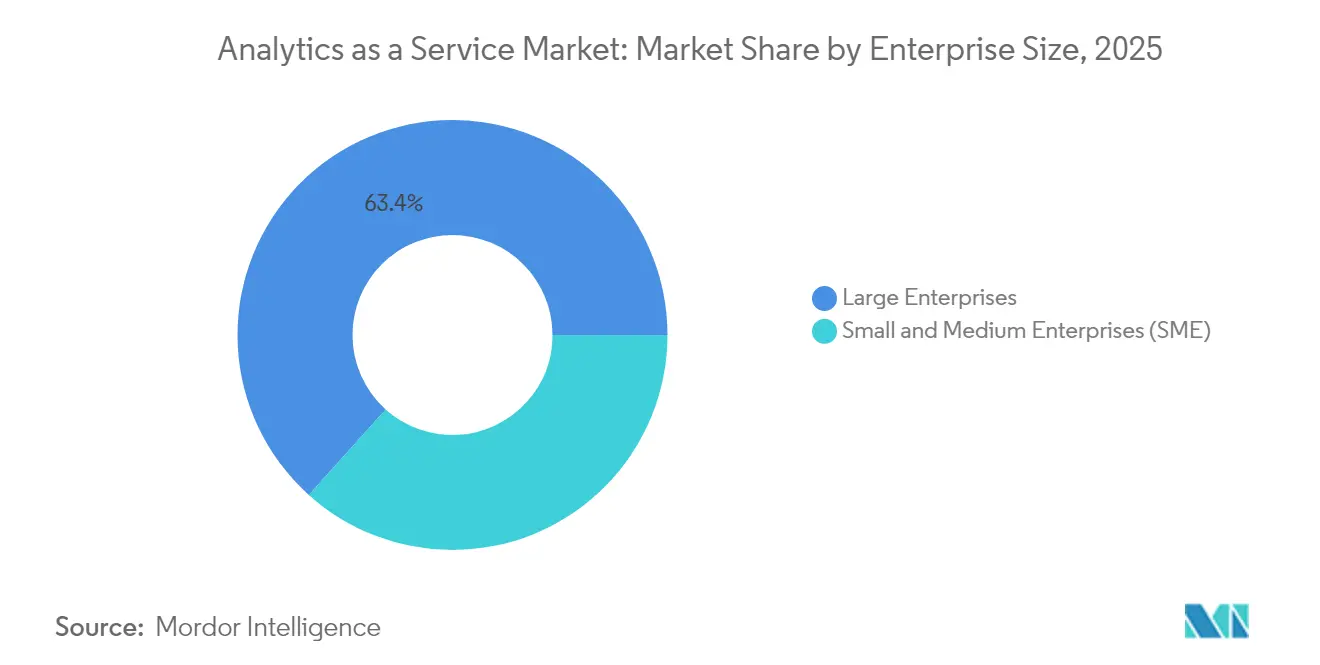
- By enterprise size, Large Enterprises led with 63.35% revenue share in 2025, while SMEs are projected to expand at a 23.40% CAGR through 2031.
- By deployment model, Public Cloud held 47.95% of the Analytics as a Service market share in 2025; Hybrid Cloud is forecast to post the fastest 25.80% CAGR to 2031.
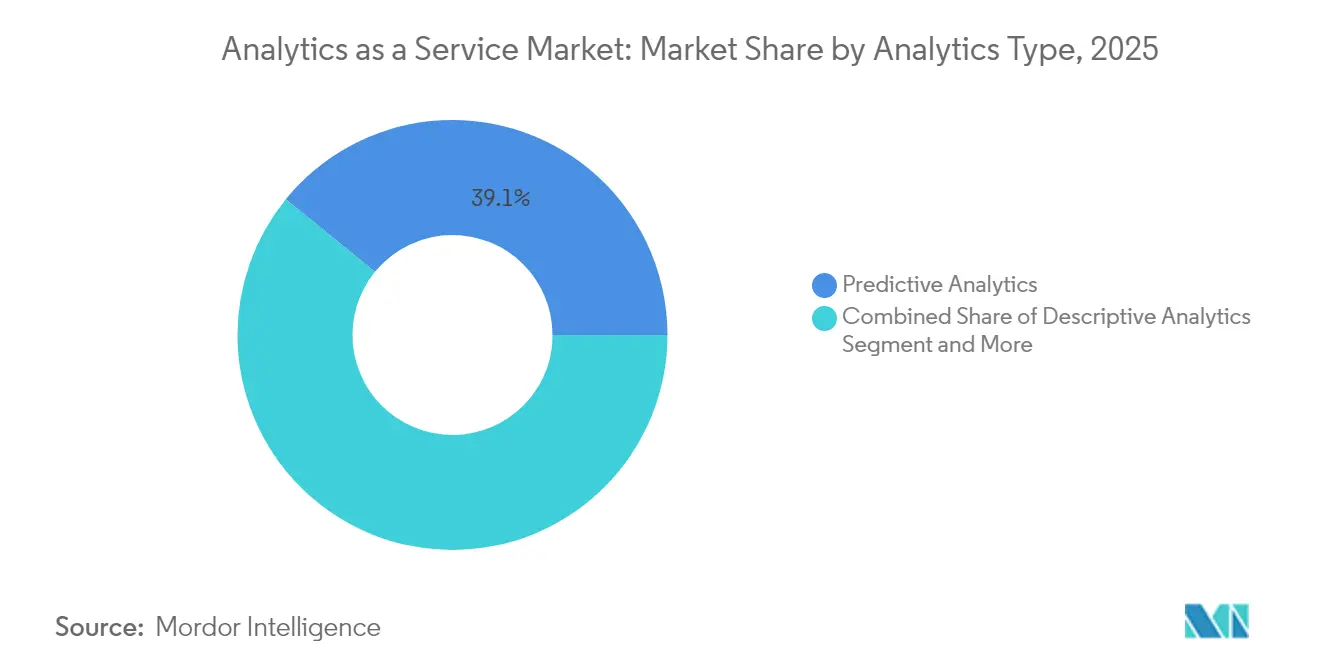
- By analytics type, Predictive Analytics commanded 39.12% of the Analytics as a Service market size in 2025; Prescriptive Analytics is advancing at a 26.10% CAGR through 2031.
- By end-user industry, BFSI accounted for 21.25% share of the Analytics as a Service market size in 2025, while Manufacturing is projected to grow at a 23.30% CAGR to 2031.
- By geography, North America generated 42.35% revenue in 2025; Asia-Pacific is anticipated to deliver the highest 24.60% CAGR between 2026-2031.
Note: Market size and forecast figures in this report are generated using Mordor Intelligence’s proprietary estimation framework, updated with the latest available data and insights as of 2026.
Global Analytics As A Service Market Trends and Insights
Drivers Impact Analysis*
| Driver | (~) % Impact on CAGR Forecast | Geographic Relevance | Impact Timeline |
|---|---|---|---|
| Cloud-first enterprise data-modernization programmes | +9% | Global; strongest in North America and Western Europe | Medium term (2-4 years) |
| Gen-AI-ready vector-native data stores | +6.7% | North America, Western Europe, advanced APAC markets | Short term (≤ 2 years) |
| Pay-as-you-go demand from SMB cloud migrations | +5.6% | Global, emphasis on emerging markets | Medium term (2-4 years) |
| Compliance-driven real-time audit analytics | +4.5% | North America and EU | Medium term (2-4 years) |
| Embedded analytics in vertical SaaS mini-clouds | +3.4% | Global, concentration in North America | Short term (≤ 2 years) |
| Sovereign-cloud mandates driving regional build-outs | +2.2% | EU, APAC, Middle East | Long term (≥ 4 years) |
| Source: Mordor Intelligence | |||
Cloud-First Enterprise Data-Modernization Programmes
Modernization projects are motivating organisations to consolidate siloed data into cloud-native platforms that support AI-ready pipelines. IBM reports that a majority of large enterprises plan to run most workloads in the cloud by 2025, underscoring a pivot away from legacy data warehouses. [1]IBM, “Optimizing Data Flexibility and Performance with Hybrid Cloud,” ibm.com Vendors position full-stack migration toolkits to simplify workload portability, automate schema conversion, and uphold security controls across multi-region environments. Financial services, healthcare, and retail adopters cite quicker time-to-insight and lower infrastructure overhead as primary benefits. As spending shifts from capital expenditure to operating expenditure, service providers differentiate on transparent pricing, integrated governance, and pre-built AI services to accelerate deployment.
Proliferation of Gen-AI-Ready, Vector-Native Data Stores
Vector databases are helping firms unlock unstructured content for generative AI search, recommendation, and chat experiences. Oracle embedded automated vector stores inside its HeatWave GenAI offering. [2]Oracle, “Oracle Announces In-Database LLMs and Automated Vector Store with HeatWave GenAI,” oracle.com Salesforce followed by enabling vector capabilities in Data Cloud. These integrations simplify similarity queries at scale without separate indexing layers. Enterprises gain the ability to combine text, audio, and image embeddings with transactional data inside a single platform, reducing latency and operational complexity. Early adopters in retail and media use the approach to personalise experiences, while industrial firms employ vector search to refine quality-inspection models. Market entrants emphasise open-source compatibility and orchestrated pipelines that ease model retraining.
Rising Pay-as-You-Go Demand from SMB Cloud Migrations
Flexible consumption models are attracting small and mid-size businesses that lack the capital for on-premises analytics hardware. Leading hyperscalers advertise tiered storage, instant-on compute, and auto-scaling clusters to keep entry costs low. The approach supports incremental adoption: firms can begin with descriptive dashboards, then layer predictive and prescriptive modules as data maturity improves. Industry cloud bundles that package security, compliance, and vertical data models further accelerate uptake among resource-constrained teams. As a result, the Analytics as a Service market is broadening beyond its earlier enterprise focus and adding thousands of new customer logos annually.
Compliance-Driven Real-Time Audit Analytics
Legislations such as the EU Digital Operational Resilience Act and enhanced SEC reporting rules compel organisations to monitor risk indicators continuously rather than via quarterly reviews. MetricStream notes a shift toward integrated GRC platforms that embed analytics into control workflows. Financial institutions deploy streaming analytics to flag anomalous transactions within seconds, reducing remediation time. Vendors enhance their offerings with pre-configured regulatory logic and audit trails that simplify attestation. Demand is notably strong in sectors with high penalty exposure, including banking, telecom, and energy.
Restraints Impact Analysis*
| Restraint | (~) % Impact on CAGR Forecast | Geographic Relevance | Impact Timeline |
|---|---|---|---|
| Escalating hyperscaler egress-fee economics | -6.7% | Global | Medium term (2-4 years) |
| Shortage of FinOps and Data-Ops talent | -5.6% | Global; most acute in emerging markets | Short term (≤ 2 years) |
| Model-explainability regulations delaying roll-outs | -3.4% | EU, North America | Medium term (2-4 years) |
| Carbon-intensity quotas on non-green data centres | -2.2% | EU, selected APAC markets | Long term (≥ 4 years) |
| Source: Mordor Intelligence | |||
Escalating Hyperscaler Egress-Fee Economics
Data-transfer fees can represent 10%–15% of a typical cloud invoice. These charges deter multi-cloud analytics architectures because shifting terabytes between platforms inflates total cost of ownership. The UK Competition and Markets Authority flagged egress fees as a switching barrier. Although some providers have introduced fee waivers under certain conditions, customers still face contractual hurdles. Service integrators now promote architectures that keep large datasets in neutral storage tiers or employ data-in-motion optimisation, such as Rackspace’s Data Freedom offering, claiming up to 85% cost reduction.
Shortage of FinOps and Data-Ops Talent
Ever-expanding cloud feature sets have outpaced the labour market’s ability to supply professionals skilled in cost-governance and automated data-pipeline design. Surveys show that 42% of companies lack FinOps expertise, leading to budget overruns and delayed analytics projects. The skills gap widens in regions where educational pipelines have not kept up with AI and cloud curricula. Enterprises counter by upskilling internal staff, engaging managed-service partners, and adopting low-code workflow orchestration tools. Nonetheless, hiring constraints lengthen implementation timelines and can stall proof-of-concept conversions.
*Our forecasts treat driver/restraint impacts as directional, not additive. The impact forecasts reflect baseline growth, mix effects, and variable interactions.
Segment Analysis
By Enterprise Size: SMEs Accelerate Digital Transformation
Large Enterprises accounted for 63.35% of 2025 revenue as they leverage deep budgets to deploy enterprise-wide data lakes and advanced modelling tools. Their analytics estates often integrate with long-standing ERP and CRM systems, enabling cross-functional dashboards and AI-driven forecasting. Multi-nationals also prioritise sovereignty controls, leading to region-specific deployments that interconnect via private backbone networks.
SMEs contribute a smaller share today yet will record the highest 23.40% CAGR to 2031. Pay-as-you-go pricing and turnkey templates lower barriers for firms without dedicated data-science teams. No-code interfaces, auto-ML services, and packaged vertical analytics help founders draw insights quickly, supporting inventory optimisation and targeted marketing. As SMB adoption broadens, vendors pilot simplified FinOps consoles that map workload cost to business KPIs, fostering transparent budgeting across finance and operations teams. The influx of SMEs broadens the Analytics as a Service market customer base, encouraging providers to release lightweight service tiers and community-led education.


By Deployment Model: Hybrid Strategies Gain Momentum
Public cloud maintained 47.95% of 2025 revenue because its shared infrastructure grants instant elasticity, global reach, and continuous feature upgrades. Start-ups and digital natives rely on fully managed analytics stacks, avoiding data-centre expenditures while accessing the latest AI accelerators. However, firms in regulated industries retain sensitive workloads in private environments to satisfy residency mandates and internal risk policies.
Hybrid architectures are set to expand at a 25.80% CAGR, blending public scalability with private-cloud control. IBM notes that hybrid deployments improve flexibility by letting teams locate data and compute where each performs best. Enterprises commonly stage raw data in private object stores, then burst to public clusters for large-scale model training. This topology mitigates egress fees and supports tiered disaster-recovery postures. As sovereignty requirements rise, providers introduce region-specific sovereign cloud zones and inter-cloud networking services, further reinforcing hybrid appeal within the Analytics as a Service market.
By Analytics Type: Prescriptive Insights Drive Business Value
Predictive Analytics dominated 2025 with 39.12% share as demand forecasting, churn prediction, and risk scoring became core to day-to-day operations. Streaming ingestion, automated feature engineering, and managed ML pipelines lower development overhead, letting business analysts test scenarios without coding expertise.
Prescriptive Analytics will grow fastest at 26.10% CAGR through 2031 thanks to optimisation engines that translate forecasts into concrete actions. IBM highlights use cases in production scheduling, inventory balancing, and logistics planning. Early manufacturing adopters achieved double-digit efficiency gains by adjusting line setups in real time. As more providers embed decision-optimisation solvers into BI dashboards, line-of-business users can run what-if analyses and compare cost, time, and sustainability outcomes. This capability elevates the Analytics as a Service market from insight delivery to direct business impact, accelerating adoption across verticals.
By End-User Industry: Manufacturing Embraces Data-Driven Operations
BFSI generated 21.25% of 2025 revenue by using fraud-detection models, credit-risk scoring, and regulatory surveillance. Banks integrate data lineage and automated reporting to satisfy evolving supervisory expectations. Concurrently, the sector invests in generative-AI chatbots that leverage internal knowledge graphs to improve customer service.
Manufacturing will post a 23.30% CAGR to 2031 as plants digitise machinery and adopt predictive-maintenance analytics. TechTarget notes growing use of digital twins and AI-driven quality inspection to minimise downtime and scrap. Alteryx supports factory data blending that unites sensor streams with procurement and warehouse records. As supply-chain volatility persists, manufacturers rely on real-time dashboards to align production with material availability, thereby tightening inventory cycles and enhancing on-time delivery metrics within the Analytics as a Service market.
Geography Analysis
North America held 42.35% of 2025 revenue, anchored by widespread cloud adoption, mature AI talent pools, and constant product innovation from dominant hyperscalers. United States enterprises in healthcare, retail, and media apply large-scale analytics to personalise experiences, optimise logistics, and drive precision medicine. Government agencies also expand data-sharing initiatives that fuel analytic workloads. Canadian organisations follow with fast uptake of sovereign cloud zones that fulfil public-sector data-residency laws. Mexico’s manufacturing corridors integrate cloud analytics into export-oriented supply chains, closing operational insight gaps.
Asia-Pacific is projected to produce the highest 24.60% CAGR, driven by aggressive digital-economic agendas in China, Japan, India, and Southeast Asia. Rapidly scaling e-commerce platforms ingest terabytes of behavioural data daily, while fintechs roll out credit models targeting underserved populations. Local cloud providers partner with multinational hyperscalers to build regionally compliant infrastructure, lowering latency and enabling sovereign-ready Analytics as a Service market offerings. Government stimulus programmes for smart-factory rollouts further stimulate demand, and SMEs leverage low-cost service bundles to leapfrog legacy systems.
Europe occupies a significant share shaped by privacy and AI governance frameworks. Strict GDPR enforcement and forthcoming EU AI Act rules push firms to deploy explainable models, audit layers, and sovereign cloud controls. AWS announced a Germany-based corporate entity to operate an independent European Sovereign Cloud with launch targeted for late 2025. Financial institutions implement multi-region redundancy to maintain operational resilience, while manufacturers connect IoT data into analytics pipelines that support energy-efficiency targets. The Analytics as a Service market in Europe thus balances innovation with compliance, promoting hybrid patterns that satisfy both business and regulatory imperatives.

Competitive Landscape
The Analytics as a Service market shows moderate concentration. AWS leverages its breadth of managed services and partner network to anchor workloads ranging from real-time dashboards to serverless ML. Microsoft capitalises on existing enterprise agreements and tight Office productivity integration to upsell analytics workloads within Azure Synapse and Fabric. Google Cloud differentiates through advanced AI tooling, recently adding multimodal analytics inside BigQuery and Looker.
Specialist providers intensify competition by offering decoupled data layers and performance-optimised engines. Snowflake emphasises cross-cloud collaboration, while Databricks merges data-engineering and lakehouse analytics into a unified platform. Salesforce embeds analytics in its CRM workflow, enhancing data-driven selling. Oracle’s collaboration with AWS to launch Oracle Database@AWS demonstrates a multi-cloud pivot that simplifies enterprise migration paths.
Strategic moves underscore the evolving battleground. AWS committed EUR 7.8 billion to a European Sovereign Cloud scheduled for Brandenburg to satisfy local residency mandates. IBM unveiled watsonx Orchestrate and watsonx.data to weave data-fabric governance with lakehouse economics. Nvidia’s 2025 GTC announcements introduced Blackwell Ultra GPUs on Azure and Google Cloud, aiming to accelerate generative-AI workloads that underpin advanced analytics services. These examples highlight how hardware, software, and ecosystem partnerships shape differentiation within the Analytics as a Service market.
Emerging white-space lies in industry-specific accelerators, embedded analytics for SaaS platforms, and privacy-preserving computation that complies with cross-border data regulations. Vendors that package domain data models, curated feature stores, and low-code interfaces are well-positioned to win adoption among non-technical business users.
Analytics As A Service Industry Leaders
Amazon Web Services
Microsoft Corporation
Google Cloud (Alphabet Inc.)
IBM Corporation
SAP SE
- *Disclaimer: Major Players sorted in no particular order

Recent Industry Developments
- May 2025: AWS launched a new corporate structure in Germany to support its European Sovereign Cloud, committing EUR 7.8 billion (USD 8.8 billion) through 2040.
- April 2025: Oracle and AWS announced Oracle Database@AWS, giving customers managed access to Oracle Autonomous Database in AWS regions.
- March 2025: Nvidia revealed Blackwell Ultra GPUs for Azure and Google Cloud, with VM availability planned in 2025.
- February 2025: IBM launched watsonx Orchestrate and watsonx.data to streamline AI-agent deployment across multi-cloud environments.
- January 2025: Google Cloud introduced multimodal analytics for BigQuery and Looker, integrating Vertex AI models.
- September 2024: Oracle added an Intelligent Data Lake with generative-AI analytics to its Data Intelligence Platform.


Research Methodology Framework and Report Scope
Market Definitions and Key Coverage
The study defines the global Analytics-as-a-Service (AaaS) market as the aggregate annual revenue earned from subscription-based cloud platforms that deliver descriptive, diagnostic, predictive, or prescriptive analytics to enterprises of all sizes through public, private, or hybrid deployments; revenues tied only to implementation or hardware resale are excluded. We describe value purely in U.S. dollars at the vendor invoice level after rebates.
Scope Exclusion: Post-deployment support and bespoke consulting that is not bundled into the recurring AaaS subscription are excluded.
Segmentation Overview
- By Enterprise Size
- Small and Medium Enterprises (SME)
- Large Enterprises
- By Deployment Model
- Public Cloud
- Private Cloud
- Hybrid Cloud
- By Analytics Type
- Descriptive Analytics
- Diagnostic Analytics
- Predictive Analytics
- Prescriptive Analytics
- By End-user Industry
- IT and Telecommunication
- BFSI
- Healthcare and Life-Sciences
- Retail and E-Commerce
- Manufacturing
- Energy and Utilities
- Government and Public Sector
- Other End-user Industries
- By Geography
- North America
- United States
- Canada
- Mexico
- South America
- Brazil
- Argentina
- Chile
- Rest of South America
- Europe
- Germany
- United Kingdom
- France
- Italy
- Spain
- Russia
- Rest of Europe
- Asia-Pacific
- China
- Japan
- India
- South Korea
- Australia
- Singapore
- Malaysia
- Rest of Asia-Pacific
- Middle East and Africa
- Middle East
- Saudi Arabia
- United Arab Emirates
- Turkey
- Rest of Middle East
- Africa
- South Africa
- Nigeria
- Egypt
- Rest of Africa
- Middle East
- North America
Detailed Research Methodology and Data Validation
Primary Research
We interview senior product leads at hyperscale providers, regional managed-cloud resellers, procurement managers in BFSI, healthcare, and retail, plus cloud-focused systems integrators across North America, Europe, and APAC. These discussions validate adoption thresholds, discount bands, and migration timelines that our desk work alone cannot surface.
Desk Research
Our analysts first map the addressable pool by reviewing non-paywalled tier-1 sources such as the United Nations International Trade Statistics, OECD ICT expenditure dashboards, Eurostat's Cloud Use Survey, and industry association white papers from the Cloud Security Alliance and TM Forum. Company 10-Ks, investor decks, and patent trends from Questel clarify revenue splits and innovation pipelines, while Dow Jones Factiva tracks deal flow and pricing moves in real time. Further volume indicators are pulled from Gartner's publicly quoted cloud workload trackers and U.S. Census ICT tables. This source set builds the foundational view; many additional references are tapped for gap filling and validation.
Market-Sizing & Forecasting
A top-down reconstruction starts with worldwide public-cloud spend, multiplies the proportion earmarked for analytics workloads, and is then regionalized using enterprise cloud-penetration ratios; selective bottom-up checks such as sampled ASP x active-tenant counts from five leading suppliers temper the totals. Key model drivers include: 1. Annual cloud infrastructure outlays per employee, 2. Share of data workloads running in cloud analytics engines, 3. Median AaaS subscription price by deployment type, 4. Regulatory data-localization rollouts, and 5. Vendor-reported analytics revenue momentum.
Forecasts employ multivariate regression blended with scenario analysis around economic growth and AI workload intensity, and missing bottom-up datapoints are bridged with three-year moving averages derived from supplier channel checks.
Data Validation & Update Cycle
Outputs pass variance checks against known vendor revenues and Statista market signals before a two-step peer review. Reports refresh each year, and interim recalculations are triggered when a top-five vendor restates earnings or a material regulatory shift occurs; a fresh analyst pass is completed just prior to delivery.
Why Mordor's Analytics As A Service Market Baseline Commands Confidence
Published figures often diverge because firms select different analytics sub-segments, pricing assumptions, refresh rhythms, and currency bases, yet clients still need one dependable starting point. Our disciplined scope, annual refresh, and mixed-method validation mean users can trace every number to observable variables.
Key Gap Drivers include rivals folding adjacent services like data warehousing or insights consulting into AaaS, relying on aggressive uptake curves without triangulating with vendor filings, or scaling 2022 prices forward without currency normalization.
Benchmark comparison
| Market Size | Anonymized source | Primary gap driver |
|---|---|---|
| USD 20.56 B (2025) | Mordor Intelligence | - |
| USD 13.30 B (2024) | Global Consultancy A | Excludes hybrid-cloud revenue; applies uniform 24 % CAGR without vendor cross-checks |
| USD 11.32 B (2024) | Industry Research Firm B | Omits SME uptake and uses pre-pandemic currency rates |
| USD 28.20 B (2024) | Research Publisher C | Bundles data-as-a-service and managed BI services into scope |
In summary, while other publishers swing markedly high or low, Mordor Intelligence grounds its baseline in verifiable spend patterns, clear-cut scope boundaries, and a repeatable model that clients can confidently explain.


Key Questions Answered in the Report
What is the current size of the Analytics as a Service market?
The market is valued at USD 25.07 billion in 2026 and is forecast to reach USD 67.63 billion by 2031.
Which region generates the highest revenue today?
North America leads with 42.35% of 2025 revenue, driven by advanced cloud infrastructure and early AI adoption.
Which deployment model is growing fastest?
Hybrid cloud deployments are projected to expand at a 25.80% CAGR between 2026-2031 as firms balance flexibility and data sovereignty.
Why are vector-native databases important for Analytics as a Service?
They enable efficient similarity search across unstructured data, supporting generative-AI workloads and reducing integration complexity.
Which end-user industry will deliver the fastest growth?
Manufacturing is expected to grow at a 23.30% CAGR through 2031 owing to predictive maintenance, quality analytics, and supply-chain optimisation.
What are the main restraints affecting market growth?
Rising data-egress fees and a shortage of FinOps and Data-Ops professionals can increase costs and delay project rollouts.
Page last updated on:


