Organizational Network Analysis (ONA) Platform Market Size and Share
Market Overview
| Study Period | 2020 - 2031 |
|---|---|
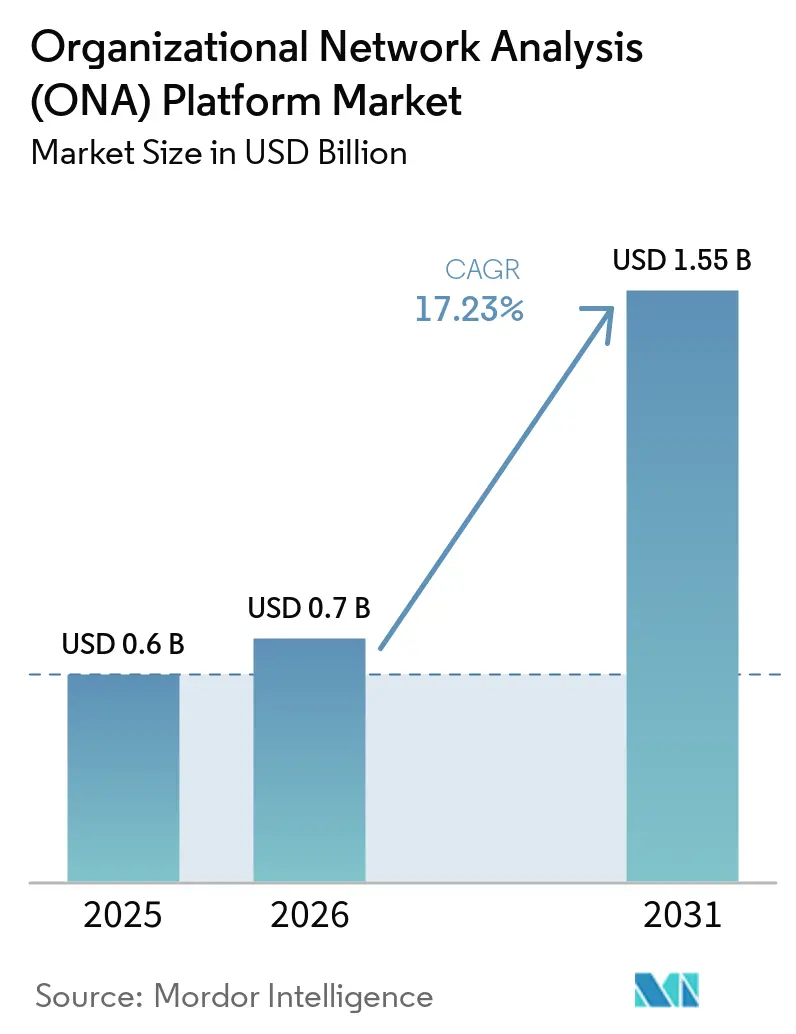
| Market Size (2026) | USD 0.7 Billion |
| Market Size (2031) | USD 1.55 Billion |
| Growth Rate (2026 - 2031) | 17.23% CAGR |
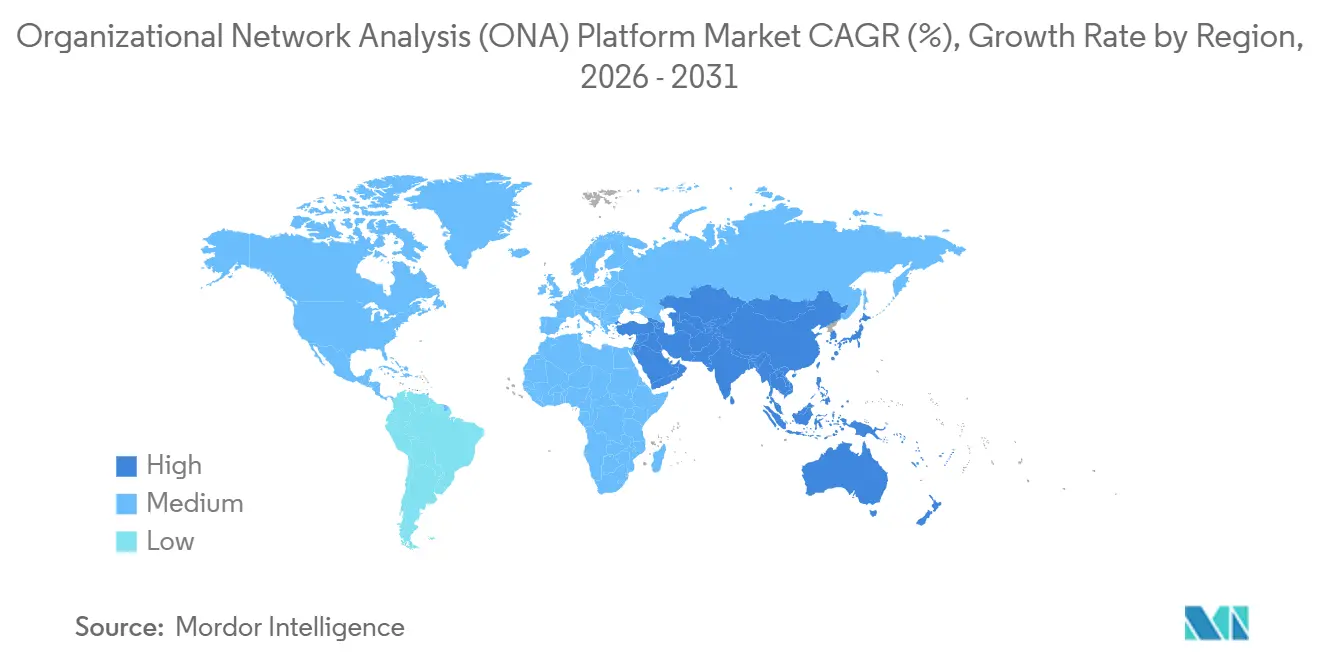
| Fastest Growing Market | Asia-Pacific |
| Largest Market | North America |
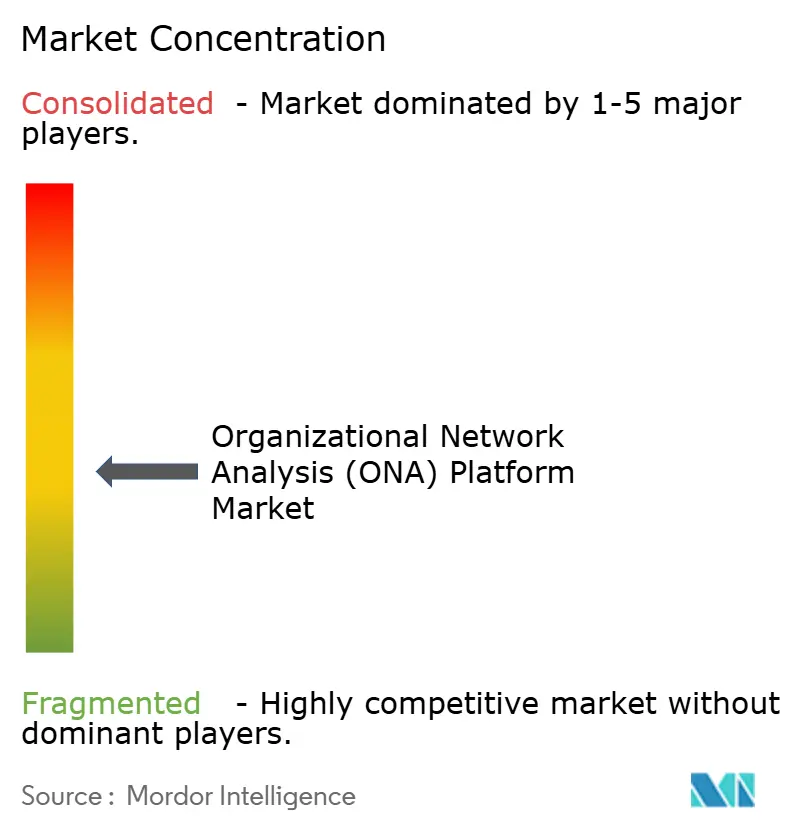
| Market Concentration | Medium |
Major Players *Disclaimer: Major Players sorted in no particular order Image © Mordor Intelligence. Reuse requires attribution under CC BY 4.0. | |
Organizational Network Analysis (ONA) Platform Market Analysis by Mordor Intelligence
The organizational network analysis (ONA) platform market size is projected to expand from USD 0.60 billion in 2025 and USD 0.70 billion in 2026 to USD 1.55 billion by 2031, registering a CAGR of 17.23% between 2026 to 2031. The organizational network analysis platform market is being sustained by the growing enterprise view that informal collaboration networks shape decisions, execution, and change flow more directly than formal reporting lines. Hybrid work continues to support demand because passive collaboration telemetry gives companies a more dependable way to understand who is connected, who is overloaded, and where influence actually sits inside the business. Enterprise AI rollout is also widening the use case because firms increasingly need network-level context to track how AI-enabled decisions spread through teams and where adoption may stall. Competition is shifting as broader workforce analytics suites absorb ONA capabilities into existing software environments, which puts pressure on standalone pricing and pushes vendors to differentiate through data depth, prescriptive modeling, and regulated-market compliance. Opportunity remains strongest where enterprises need always-on visibility during workforce planning, restructuring, integration, and hybrid productivity management, especially as SaaS delivery lowers entry barriers for buyers outside the largest global enterprises.
Key Report Takeaways
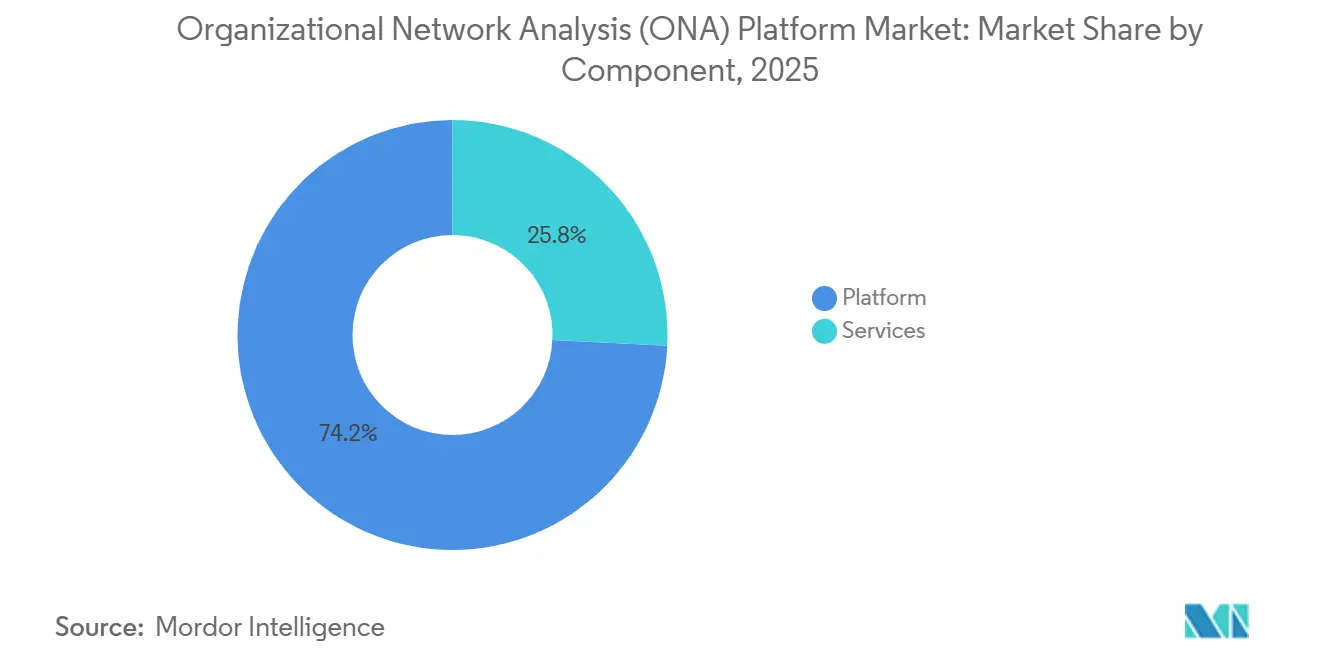
- By component, platform solutions led with 74.20% revenue share in Organizational Network Analysis (ONA) Platform Market in 2025, while services are projected to expand at a 17.24% CAGR through 2031.
- By deployment model, cloud-based deployment accounted for 69.80% of total revenue in 2025, while hybrid deployment is forecast to grow at a 18.37% CAGR through 2031.
- By enterprise size, large enterprises accounted for 66.10% of ONA platform market revenue in 2025, while SMEs are projected to grow at a 19.41% CAGR through 2031.
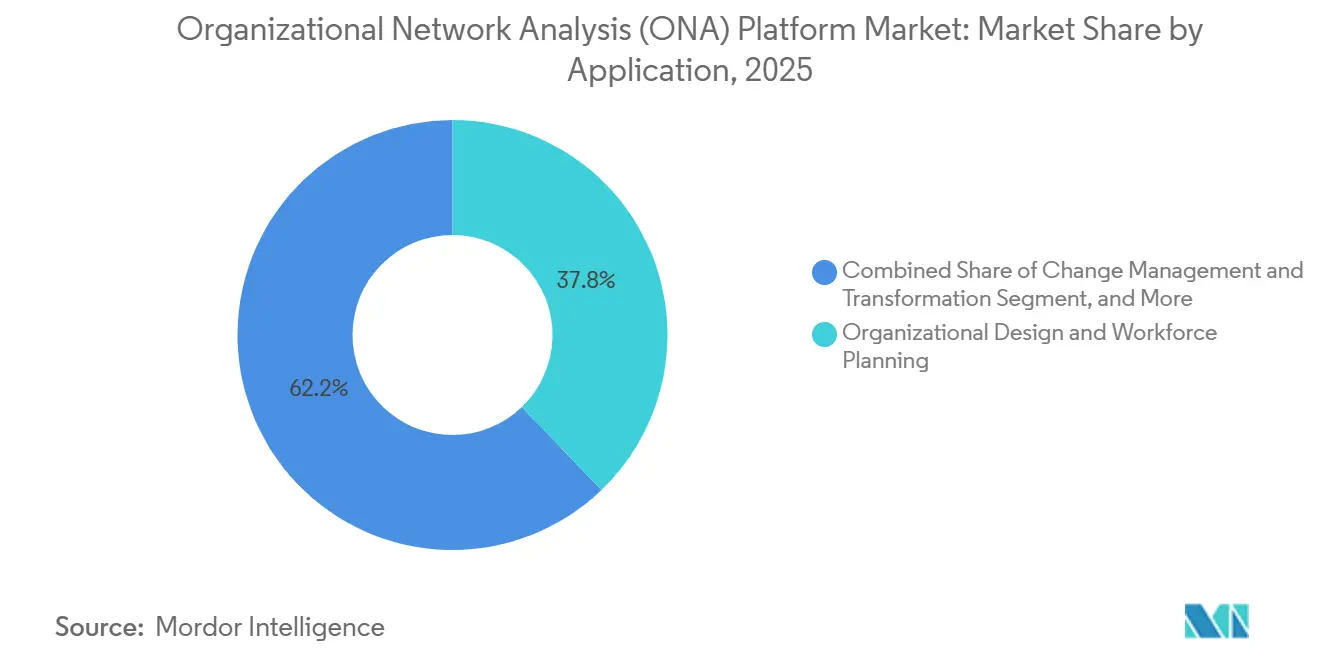
- By application, Organizational Design and Workforce Planning accounted for 37.82% share of the organizational network analysis platform market size in 2025, while Change Management and Transformation is projected to expand at a 20.13% CAGR through 2031.
- By end user industry, IT and Telecom held 27.45% share in 2025, while Healthcare and Life Sciences are forecast to grow at a 21.17% CAGR through 2031.
- By geography, North America held 41.30% of the organizational network analysis platform market share in 2025, while Asia-Pacific is projected to advance at a 17.89% CAGR through 2031.
Note: Market size and forecast figures in this report are generated using Mordor Intelligence’s proprietary estimation framework, updated with the latest available data and insights as of January 2026.
Global Organizational Network Analysis (ONA) Platform Market Trends and Insights
Drivers Impact Analysis*
| Driver | (~) % Impact on CAGR Forecast | Geographic Relevance | Impact Timeline |
|---|---|---|---|
| Hybrid Work Complexity Expands Demand for Collaboration Visibility | +3.8% | Global, concentrated in North America and Europe | Short term (≤ 2 years) |
| Burnout Prevention Elevates Collaboration Overload Analytics | +2.9% | Global, North America and Northern Europe | Short term (≤ 2 years) |
| M&A and Transformation Programs Need Influence Mapping | +2.4% | North America, Europe, spill-over to APAC | Medium term (2-4 years) |
| Generative AI Enables Prescriptive Network Insights | +2.2% | Global, early gains in North America, UK, and Japan | Medium term (2-4 years) |
| Enterprise AI Rollout Governance Requires Influence Diffusion Mapping | +1.8% | North America, EU core, spill-over to APAC | Medium term (2-4 years) |
| Developer Experience Optimization Creates New ONA Buying Center | +1.2% | North America, emerging traction in India, Germany, and Israel | Long term (≥ 4 years) |
| Source: Mordor Intelligence | |||
Hybrid Work Complexity Expands Demand for Collaboration Visibility
The organizational network analysis (ONA) platform market is seeing direct support from hybrid work, as fixed office attendance no longer provides managers with a reliable view of how people actually work together. In 2025, it was reported that employees handled 275 interruptions a day and exchanged 153 Teams messages on a typical weekday, which shows why message volume alone is no longer a useful stand-in for productive collaboration.[1]Microsoft, “Breaking Down the Infinite Workday,” Microsoft WorkLab, microsoft.com In this setting, passive network data has become more valuable than periodic surveys because it captures recurring ties, bottlenecks, and coordination strain as they happen. Worklytics also found in 2025 that return-to-office cohorts often lost close collaborator density after mandate implementation, and that passive ONA signals could identify voluntary departure risk 4-6 weeks before exits with 70-80% accuracy. That lead time matters because enterprises are now using the organizational network analysis platform market less for one-off diagnostics and more for ongoing workforce planning cycles tied to retention, location strategy, and team redesign.
Burnout Prevention Elevates Collaboration Overload Analytics
The organizational network analysis (ONA) platform market is also gaining from the need to measure collaboration overload before it turns into turnover or lower focus time. In October 2025, SaaS organizations using ONA-informed focus blocks saw a 22% rise in perceived focus time and a 15% drop in cognitive fatigue within 90 days.[2] Worklytics, “Using Passive ONA to De-Risk Return-to-Office Mandates,” Worklytics, worklytics.co Worklytics found in 2025 that the top 10% of employees ranked by betweenness centrality were 1.8 times more likely to face burnout than the wider workforce. The same study showed that teams logging more than 25 weekly collaboration hours produced 23% higher innovation output but also carried 31% higher turnover risk. This is widening demand for platforms that can separate necessary collaboration from wasteful load, which gives the organizational network analysis platform market a stronger position within broader workforce health and productivity budgets.
M&A and Transformation Programs Need Influence Mapping
The ONA platform market is benefiting from M&A and restructuring programs because integration success depends on informal influence paths as much as on formal system alignment. Research published in July 2025 found that 45-60% of deal benefits depend directly on information systems integration, which supports the case for mapping informal connectors before and after close. The same research linked global M&A activity of USD 3.5 trillion in 2024 to the growing operational need for better integration planning. In practice, this means influence networks can no longer be treated as a post-deal culture issue because the most important cross-unit bridges may disappear early if they are not identified and stabilized. That change is expanding the organizational network analysis platform market beyond HR teams and into strategy, corporate development, legal, and transformation functions.
Generative AI Enables Prescriptive Network Insights
The organizational network analysis (ONA) platform market is moving beyond descriptive mapping because generative AI makes it easier to model the effect of organizational changes before leaders act on them. Research published in July 2025 showed that large language model agents achieved 94.9% full-knowledge recall across 864 organizational simulations, supporting the use of AI for scenario testing during team restructures and span-of-control changes. SAP stated in May 2026 that its SuccessFactors update introduced autonomous human capital management with AI-driven organizational modeling, and linked the release to a finding that 62% of C-suite executives were dissatisfied with how existing people data linked to business performance. Visier also released its next-generation Workforce AI platform in April 2026, integrating the Glean Model Context Protocol to make workforce and network signals available as context for enterprise AI agents. As enterprises scale agentic AI, the ONA platform market is becoming relevant not only for people analytics but also for AI governance, adoption flow, and intervention design.[3]MDPI Systems, “Information Systems Integration in M&A: Impact on Deal Value Realization,” Systems, mdpi.com
Restraints Impact Analysis*
| Restraint | (~) % Impact on CAGR Forecast | Geographic Relevance | Impact Timeline |
|---|---|---|---|
| Data Privacy and Ethical Surveillance Concerns | -3.2% | EU core (GDPR, EU AI Act), CCPA states, APAC | Short term (= 2 years) |
| Integration Complexity Across Fragmented Collaboration Data Sources | -2.6% | Global, mid-market, APAC | Medium term (2-4 years) |
| Employee Trust Erosion from Perceived Monitoring | -2.0% | Global, Northern Europe, Japan | Medium term (2-4 years) |
| Weak Managerial Fluency in Network Metrics Slows Actionability | -1.4% | Emerging markets, mid-market globally | Long term (= 4 years) |
| Source: Mordor Intelligence | |||
Data Privacy and Ethical Surveillance Concerns
The organizational network analysis (ONA) platform market faces a direct restraint from privacy regulations, as employment-related behavioral data is now drawing closer scrutiny across major jurisdictions. In 2025, 86% of employees believed that disclosure of ONA data collection should be a legal requirement, indicating a significant trust gap before deployment even begins. The same issue carries legal weight because GDPR Article 83(5) allows fines of up to 4% of global annual turnover for unlawful processing of employee data, thereby raising the stakes for weak governance design. Research published in April 2026 noted that European authorities were increasing scrutiny of passive behavioral monitoring and that the EU AI Act adds new assessment demands for AI-assisted employment systems. As a result, vendors that build transparency controls, consent options, and jurisdiction-specific data-handling into their products are gaining an advantage, while mid-sized buyers without strong privacy teams are moving more slowly.[4]Worklytics, “GDPR and CCPA Compliance Checklist for ONA Tools,” Worklytics, worklytics.co
Integration Complexity Across Fragmented Collaboration Data Sources
The organizational network analysis platform market is also constrained by the technical challenge of pulling usable data from fragmented collaboration stacks. People data often sits across email, calendar, messaging, project management, and HR systems, and each source follows its own access rules, update cycles, and residency requirements. This turns many deployments into integration programs rather than simple SaaS rollouts, especially in multi-cloud enterprises or in companies that have grown through acquisitions. The vendors that invest early in connectors across Microsoft 365, Google Workspace, Slack, Jira, and Workday, therefore, build a practical edge that newer entrants struggle to match as deeply. The result is that time-to-value differs sharply across customers, and the ONA platform market grows faster where the underlying data architecture is already more unified.
*Our forecasts treat driver/restraint impacts as directional, not additive. The impact forecasts reflect baseline growth, mix effects, and variable interactions.
Segment Analysis
By Component: Platform Infrastructure Anchors Revenue Concentration
Platform solutions accounted for 74.20% of the organizational network analysis (ONA) platform market in 2025, indicating that buyers prefer a persistent analytics layer over project-led services when they need network intelligence to scale across the enterprise. This pattern aligns with the shift toward continuous passive analysis rather than periodic survey work because recurring collaboration data requires software infrastructure to ingest, process, and visualize activity at scale. The organizational network analysis platform market, therefore, continues to favor software-led revenue even when implementation support remains important. In many accounts, the first purchase is driven by the need to establish a single source of truth for network visibility across distributed teams. That makes the platform layer the control point for data governance, dashboarding, and future AI-assisted modeling.
Services are still growing and are projected to record a 17.24% CAGR through 2031 because enterprises often need help with deployment design, change support, governance, and custom modeling during early rollout stages. The organizational network analysis platform industry still relies on service support for large, complex accounts, where buyers want tailored integration work rather than standard onboarding. Over time, self-serve configuration and stronger templates are likely to shift routine setup work back into the product, which narrows the role of services in lower-complexity deals. At the same time, large ecosystem vendors are building service-like functionality directly into their software, which puts pressure on standalone advisory-led models. Cornerstone’s May 2026 Workforce AI launch, covering 45 million users across 186 countries and more than 55,000 skills ontologies, shows how broad platforms are absorbing more of the workflow depth that once sat outside core software.


By Deployment Model: Hybrid Architectures Gain Ground in Regulated Sectors
Cloud-based deployment held 69.80% of the organizational network analysis platform market share in 2025 because it offers faster setup, lower infrastructure burden, and a cleaner fit with the SaaS environments that many buyers already use. Early adoption largely came from technology-led enterprises that wanted quick time-to-value and faced limited data residency constraints. That made cloud the default model for buyers focused on speed, experimentation, and easier expansion across regions. The organizational network analysis (ONA) platform market still draws much of its current volume from those cloud-first users because the software is closely tied to digital collaboration systems that already run in the cloud. In these accounts, deployment choice has often been less about preference and more about matching the rest of the collaboration stack.
Hybrid deployment is now the fastest-growing path and is projected to grow at a 18.37% CAGR through 2031, as regulated sectors seek to keep sensitive employee data behind the firewall while still using cloud-side analytics and AI features. This is especially visible in BFSI, healthcare, and government, where control over people's data has become central to procurement. The model appeals to organizations that are still moving toward broader cloud adoption but are not ready to transfer all workforce data to external environments. On-premises deployment remains relevant in sovereign or defense-sensitive settings, yet its role is increasingly focused on a narrower set of highly controlled use cases. As compliance demands rise, the ONA platform market is likely to keep shifting toward hybrid designs that balance analytical flexibility with stricter data handling.
By End User Enterprise Size: SME Entry Points Redefine Market Boundaries
Large enterprises accounted for 66.10% of revenue in 2025 because they face the greatest coordination strain across hybrid teams, multi-site operations, and post-acquisition structures. These buyers also have larger budgets, stronger data infrastructure, and clearer internal owners for workforce analytics programs. For that reason, the organizational network analysis (ONA) platform market first developed around large global employers that needed to understand how work moved beyond the formal org chart. Many vendor road maps still reflect that history, with product design shaped by the procurement cycles and governance demands of enterprise HR and transformation teams. Large enterprises, therefore, remain the anchor accounts for both product scale and reference deployment value.
SMEs are projected to grow at a 19.41% CAGR through 2031, which signals that pricing and delivery changes are pulling the market into a much broader customer base. SaaS economics have lowered access barriers for firms with 500-5,000 employees that previously lacked the budget or the vendor leverage to buy advanced ONA tools. The organizational network analysis platform industry is also reaching SMEs through adjacent features inside Microsoft 365 and Google Workspace, where lighter collaboration metrics help build familiarity before buyers move to dedicated platforms. That exposure creates better-informed customers and shortens education cycles for mid-market vendors. As a result, the organizational network analysis platform market is no longer defined only by Fortune 500 demand, but increasingly by whether vendors can package depth, privacy, and ease of deployment for smaller teams.
By Application: Change Drivers Reshape How ONA Value Is Defined
Organizational Design and Workforce Planning accounted for 37.82% of the organizational network analysis platform market in 2025, as it remains the clearest use case for linking informal collaboration structures to formal staffing decisions. HR and organizational effectiveness teams continue to use ONA to test whether reporting lines, spans of control, and team boundaries align with how work actually gets done. That practical tie to headcount planning keeps the segment at the center of many buying decisions. The organizational network analysis platform market still gains much of its credibility from this application because it produces visible actions rather than abstract network maps. It also aligns with annual planning rhythms, which helps secure recurring budgets and repeat analysis.
Change Management and Transformation is the fastest-growing application, projected to expand at a 20.13% CAGR through 2031, as more organizations seek real-time influence mapping during integration and restructuring. In July 2024, research showed that 79% of business leaders recognized their responsibility for value creation through network leverage, while only 27% of workers felt their organization acted on that recognition, which shows how execution gaps keep this application relevant even after network awareness improves. Leadership and Influence Mapping, Collaboration and Communication Analytics, and Innovation Network Analysis are also expanding as firms seek clearer views of connectors, hotspots, and idea flow. The Others category captures newer uses such as supplier network resilience analysis and board governance connectivity mapping, which shows how demand is moving beyond HR into wider strategic and operational decisions. This broader use-case mix gives the organizational network analysis platform market a more durable base than if it were tied only to org design projects.

By End User Industry: Healthcare’s Network Complexity Fuels Fastest Growth
IT and Telecom retained the largest share at 27.45% in 2025 because distributed engineering work depends heavily on informal knowledge flows, peer support, and a balanced load of collaboration. Software and cloud firms adopted passive collaboration analytics earlier than most sectors, which gave them a head start in using ONA to track technical influence and developer experience. That made the organizational network analysis platform market especially relevant in environments where formal process maps often miss how technical work actually gets solved. These companies also tend to have richer collaboration data and stronger tolerance for software-based experimentation. As a result, IT and Telecom remain the reference sector for large-scale deployments and product testing.
Healthcare and Life Sciences is projected to expand at a 21.17% CAGR through 2031, which makes it the fastest-growing vertical in the organizational network analysis (ONA) platform market. Growth is being driven by clinical team restructuring, care coordination analysis, and post-pandemic consolidation, which require better visibility into how people and decisions move across organizations. A Fortune 500 medical device company with 15,000 employees achieved a 12% reduction in development cycle time, an 18% increase in patent output, a 27% reduction in engineering turnover, and USD 23 million in productivity gains from one ONA deployment. BFSI continues to adopt ONA for compliance and risk visibility, while Retail and E-commerce, Industrial Manufacturing, and Government and Public Sector are expanding for different reasons tied to workforce modernization, coordination strain, and retention. That spread suggests the organizational network analysis platform market is broadening from a technology-centered base into sectors where network visibility supports operational reliability as much as people analytics.
Geography Analysis
North America accounted for 41.30% of the organizational network analysis (ONA) platform market share in 2025 because the region combines large hybrid-work employers, mature people analytics programs, and a strong base of pure-play and suite vendors. The United States remained the main source of regional demand, with adoption supported by enterprises that already use digital collaboration systems at scale. Microsoft Viva Insights has helped widen exposure by making metrics such as diverse ties, strong ties, and influence rank available inside existing Microsoft 365 environments. That matters because it lowers the barrier to initial ONA use and gives buyers a path from embedded metrics to fuller platform purchases. Canada and Mexico are growing within the regional base, though both remain earlier in adoption than the United States.
Asia-Pacific is the fastest-growing region in the ONA platform market, advancing at a 17.89% CAGR through 2031. In March 2025, research showed that close to 75% of APAC organizations were still at Levels 1–2 of people analytics maturity, compared with the Americas, where organizations were concentrated at Level 4, suggesting a large base of buyers that have yet to make a major ONA investment. Another study found in 2025 that 73% of APAC HR leaders had adopted or changed their HR technology platform in the prior 18 months, while 46% expected budget increases, which supports a favorable environment for new ONA vendor entry. India, Japan, and South Korea stand out because technology services expansion, HR platform renewal, and growing analytics maturity are creating a stronger base for ONA deployment.
Europe held the second-largest regional position in 2025, with Germany, the United Kingdom, France, and the Benelux countries forming the core demand base for the organizational network analysis platform market. The region’s main difference is regulatory intensity, since GDPR enforcement and the EU AI Act make privacy design a more central buying factor than in many other markets. This raises compliance costs and often lengthens deployment cycles, favoring vendors with strong consent management, localization controls, and a privacy-by-design product architecture. South America, the Middle East, and Africa remain earlier-stage markets, where demand is concentrated in multinational subsidiaries and the largest local enterprises pursuing workforce modernization.

Competitive Landscape
The organizational network analysis platform market remains moderately fragmented, with no single vendor holding a dominant commercial position. Competition is shaped by 3 main points: depth of passive data processing, native AI support for network scenario modeling, and compliance architecture for regulated environments. Dedicated vendors such as Humanyze, Worklytics, Network Perspective, SWOOP Analytics, and Teamspective compete with broader workforce analytics suites from SAP SuccessFactors, Visier, and Microsoft Viva Insights. This mix puts standalone providers under pressure because larger suite vendors can bundle ONA features into broader HR or productivity platforms. The organizational network analysis platform market, therefore, rewards providers that can show clear differentiation in data depth, actionability, or regulatory readiness rather than simple visualization.
Smaller vendors are still finding room to compete by focusing on specific use cases, such as visualization, org design support, or calendar data analysis. Technical differentiation is becoming increasingly important as generative AI enters the category, especially when vendors can simulate network effects rather than merely report them. Research in 2025 presented a graph-augmented generation framework for organizational network modeling, which supports the view that analytical depth will increasingly matter in product competition. Procurement expectations are also rising, and privacy extensions such as ISO/IEC 27701 and SOC 2 Type II controls are increasingly aligned with baseline requirements for regulated accounts. These demands favor vendors that can combine feature breadth with auditable governance.
White-space opportunity remains strongest in the mid-market, in healthcare, and in developer experience analytics, where collaboration load is important but not always well measured by mainstream HR tools. Teamspective’s February 2026 AI tools launch, with Model Context Protocol compatibility, shows how some vendors are trying to embed ONA data into broader enterprise AI workflows rather than selling it as a separate analytics layer. SAP and Visier are following a similar direction by tying organization modeling and workforce context more closely to AI-enabled decision support. If this shift continues, the organizational network analysis platform market will move further away from a narrow HR analytics label and closer to a broader role in enterprise change execution and AI adoption governance.
Organizational Network Analysis (ONA) Platform Industry Leaders
Humanyze
Polinode Pty Ltd.
Innovisor
Worklytics Co.
TrustSphere Pte. Ltd.
- *Disclaimer: Major Players sorted in no particular order

Recent Industry Developments
- May 2026: SAP updated SuccessFactors with AI-driven organizational modeling, embedding prescriptive ONA into HR infrastructure to connect people data with business performance outcomes.
- May 2026: Cornerstone OnDemand launched Workforce AI, unifying skills and network analytics across 45M users, integrating collaboration signals with talent mobility and succession planning.
- April 2026: Visier released Workforce AI with Glean MCP integration, making ONA signals available to enterprise AI agents, shifting ONA toward AI infrastructure.
- February 2026: Humanyze was acquired by Livechain for USD 325,000, marking early consolidation in the fragmented ONA platform mid-market.


Global Organizational Network Analysis (ONA) Platform Market Report Scope
The organizational network analysis (ONA) platform market refers to solutions that map and analyze relationships, communication flows, and influence patterns within enterprises to improve collaboration, leadership visibility, and organizational design. These platforms provide applications such as workforce planning, change management, sentiment analytics, and innovation network analysis, enabling leaders to identify key connectors, bottlenecks, and opportunities for transformation. Available via cloud, on-premises, or hybrid models, ONA platforms serve both large enterprises and SMEs across industries, including BFSI, healthcare, IT and telecom, retail, manufacturing, government, and others. Their core purpose is to translate organizational connections into actionable insights that strengthen performance, agility, and innovation.
The organizational network analysis (ONA) platform market report is segmented by Component (Platform, and Services), Deployment Model (Cloud-based, On-premises, and Hybrid), Enterprise Size (Large Enterprises, and Small and Medium-sized Enterprises), Application (Organizational Design and Workforce Planning, Collaboration and Communication Analytics, Change Management and Transformation, Leadership and Influence Mapping, Innovation Network Analysis, and Others), End-user Industry (BFSI, Healthcare and Life Sciences, Information Technology and Telecom, Retail and E-commerce, Industrial Manufacturing, and Government and Public Sector), and Geography (North America, South America, Europe, Asia-Pacific, Middle East, and Africa). The Market Forecasts are Provided in Terms of Value (USD).
| Platform |
| Services |
| Cloud-based |
| On-premises |
| Hybrid |
| Large Enterprises |
| Small and Medium-sized Enterprises |
| Organizational Design and Workforce Planning |
| Collaboration and Communication Analytics |
| Change Management and Transformation |
| Leadership and Influence Mapping |
| Innovation Network Analysis |
| Others |
| BFSI |
| Healthcare and Life Sciences |
| Information Technology and Telecom |
| Retail and E-commerce |
| Industrial Manufacturing |
| Government and Public Sector |
| North America | United States |
| Canada | |
| Mexico | |
| South America | Brazil |
| Argentina | |
| Rest of South America | |
| Europe | Germany |
| United Kingdom | |
| France | |
| Italy | |
| Spain | |
| Russia | |
| Netherlands | |
| Rest of Europe | |
| Asia-Pacific | China |
| Japan | |
| India | |
| South Korea | |
| Australia and New Zealand | |
| Rest of Asia-Pacific | |
| Middle East | Saudi Arabia |
| United Arab Emirates | |
| Rest of Middle East | |
| Africa | South Africa |
| Nigeria | |
| Rest of Africa |
| By Component | Platform | |
| Services | ||
| By Deployment Model | Cloud-based | |
| On-premises | ||
| Hybrid | ||
| By End User Enterprise Size | Large Enterprises | |
| Small and Medium-sized Enterprises | ||
| By Application | Organizational Design and Workforce Planning | |
| Collaboration and Communication Analytics | ||
| Change Management and Transformation | ||
| Leadership and Influence Mapping | ||
| Innovation Network Analysis | ||
| Others | ||
| By End User Industry | BFSI | |
| Healthcare and Life Sciences | ||
| Information Technology and Telecom | ||
| Retail and E-commerce | ||
| Industrial Manufacturing | ||
| Government and Public Sector | ||
| By Geography | North America | United States |
| Canada | ||
| Mexico | ||
| South America | Brazil | |
| Argentina | ||
| Rest of South America | ||
| Europe | Germany | |
| United Kingdom | ||
| France | ||
| Italy | ||
| Spain | ||
| Russia | ||
| Netherlands | ||
| Rest of Europe | ||
| Asia-Pacific | China | |
| Japan | ||
| India | ||
| South Korea | ||
| Australia and New Zealand | ||
| Rest of Asia-Pacific | ||
| Middle East | Saudi Arabia | |
| United Arab Emirates | ||
| Rest of Middle East | ||
| Africa | South Africa | |
| Nigeria | ||
| Rest of Africa | ||


Key Questions Answered in the Report
What is the current and forecast value of the organizational network analysis (ONA) platform market?
The organizational network analysis (ONA) platform market stands at USD 0.70 billion in 2026 and is projected to reach USD 1.55 billion by 2031, growing at a 17.23% CAGR from 2026 to 2031.
Which component leads revenue in organizational network analysis platforms?
Platform solutions led with 74.20% of revenue in 2025 because enterprises prefer a persistent analytics layer over project-based services for continuous network visibility.
Which application area is expanding the fastest for ONA platforms?
Change Management and Transformation is the fastest-growing application, with a projected 20.13% CAGR through 2031, driven by restructuring and M&A integration needs.
Why is hybrid work increasing demand for ONA tools?
Hybrid work makes informal collaboration patterns harder to see through org charts alone, so companies are using passive telemetry to identify real influence paths, overload, and coordination gaps.
Which region leads revenue and which one is growing the fastest?
North America led with 41.30% of global revenue in 2025, while Asia-Pacific is the fastest-growing region with a projected 17.89% CAGR through 2031.
Which end-user sector shows the strongest growth outlook?
Healthcare and Life Sciences is the fastest-growing end-user sector at a 21.17% CAGR through 2031 because clinical coordination, restructuring, and consolidation require stronger network visibility.
Page last updated on:


