Optical Networking And Communications Market Size and Share
Market Overview
| Study Period | 2019 - 2030 |
|---|---|
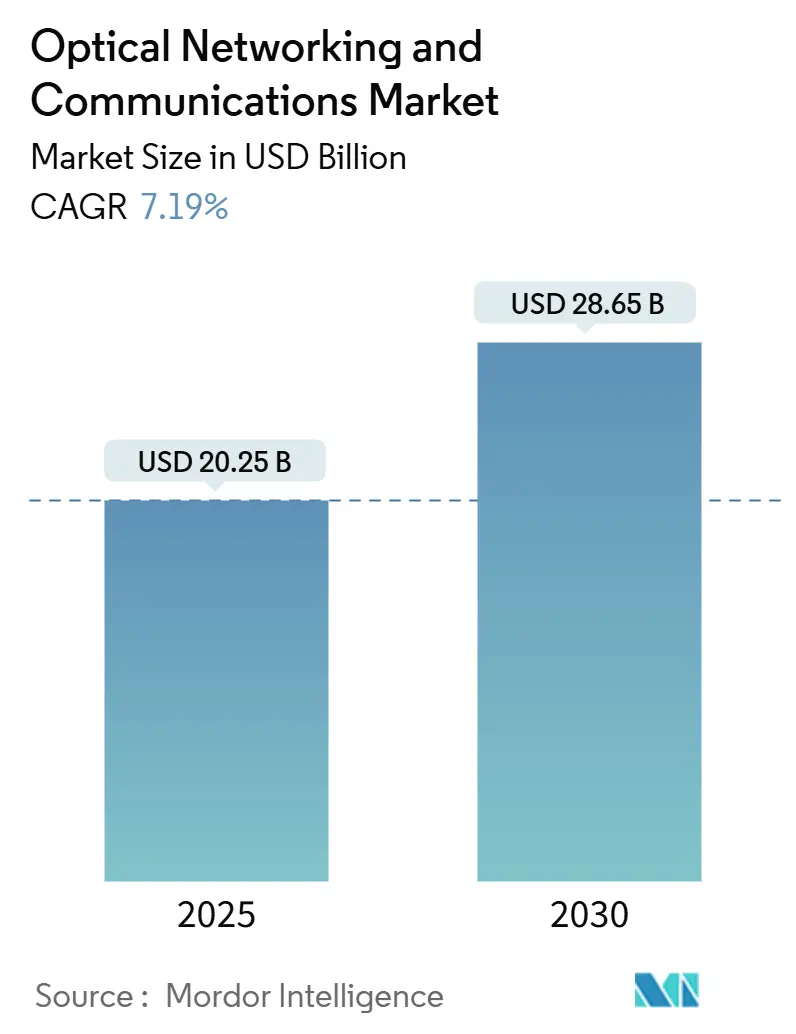
| Market Size (2025) | USD 20.25 Billion |
| Market Size (2030) | USD 28.65 Billion |
| Growth Rate (2025 - 2030) | 7.19% CAGR |
| Fastest Growing Market | Asia Pacific |
| Largest Market | Asia Pacific |
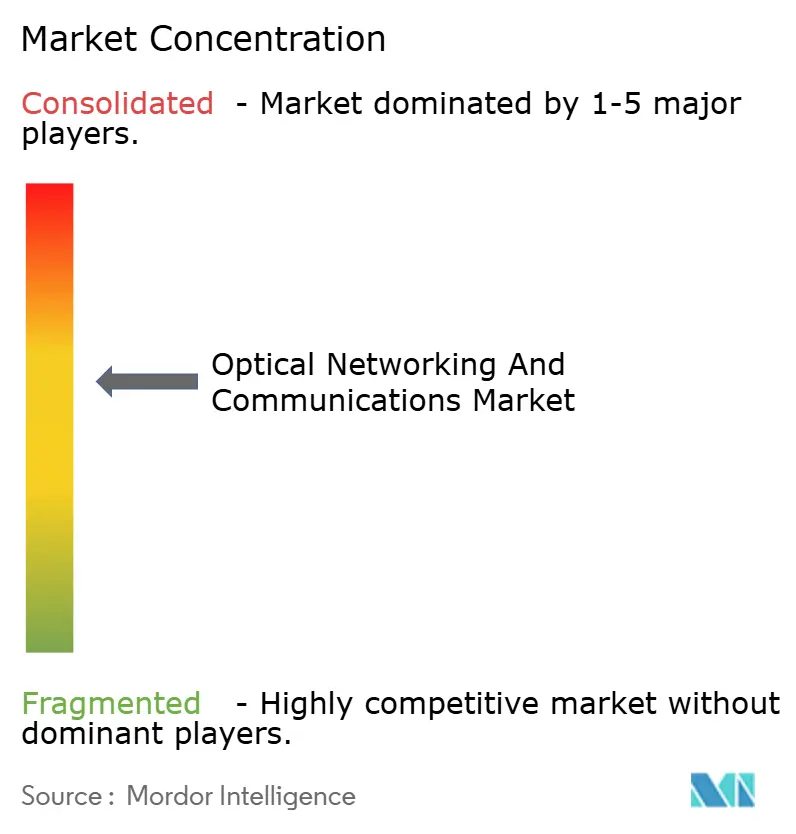
| Market Concentration | Medium |
Major Players *Disclaimer: Major Players sorted in no particular order Image © Mordor Intelligence. Reuse requires attribution under CC BY 4.0. | |
Optical Networking And Communications Market Analysis by Mordor Intelligence
The optical networking and communications market size stood at USD 20.25 billion in 2025 and is forecast to reach USD 28.65 billion by 2030, advancing at a 7.19% CAGR. The growth arc is propelled by bandwidth-hungry AI workloads, hyperscale data-center interconnect upgrades, and the fiber-rich 5G infrastructure wave. Breakthrough coherent optics such as Ciena’s WaveLogic 6 Extreme, which delivers 1.6 Tb/s single-carrier wavelengths while cutting power needs by 50%, reinforce performance-per-watt advantages. Asia-Pacific’s outsized 37.16% revenue share is anchored in national fiber rollouts and China’s 6G research leadership. Wavelength-division multiplexing (WDM) retains 51.46% share, yet coherent optical transmission commands the fastest 8.14% CAGR as operators squeeze more spectral efficiency from existing fiber. Component dynamics illustrate transceivers’ 34.23% share, while optical fiber expands the fastest at 7.67% as governments bankroll rural broadband. Greater-than-400 Gbps systems are the quickest climbers at 8.32% CAGR, mirroring hyperscalers’ shift toward 800G and emerging 1.6T pluggables.
Key Report Takeaways
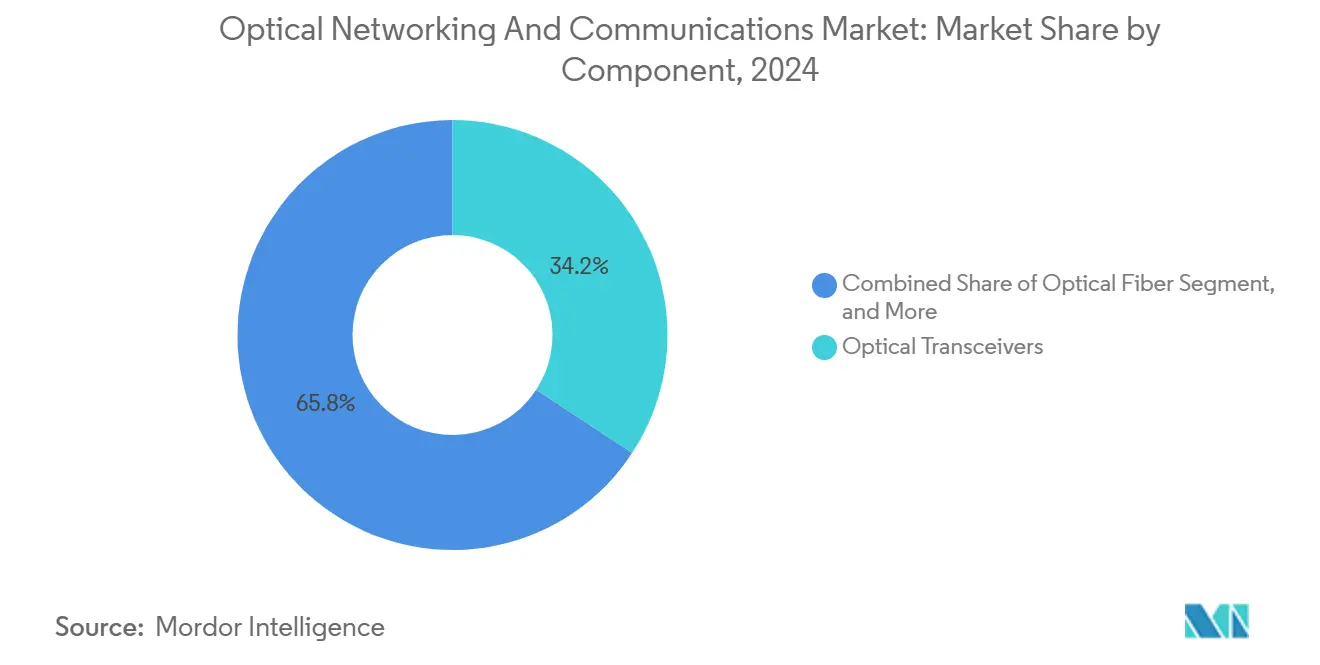
- By component, optical transceivers led with 34.23% revenue share in 2024, whereas optical fiber is forecast to expand at a 7.67% CAGR through 2030.
- By technology, WDM accounted for 51.46% of revenue in 2024, while coherent optical transmission is projected to grow at an 8.14% CAGR by 2030.
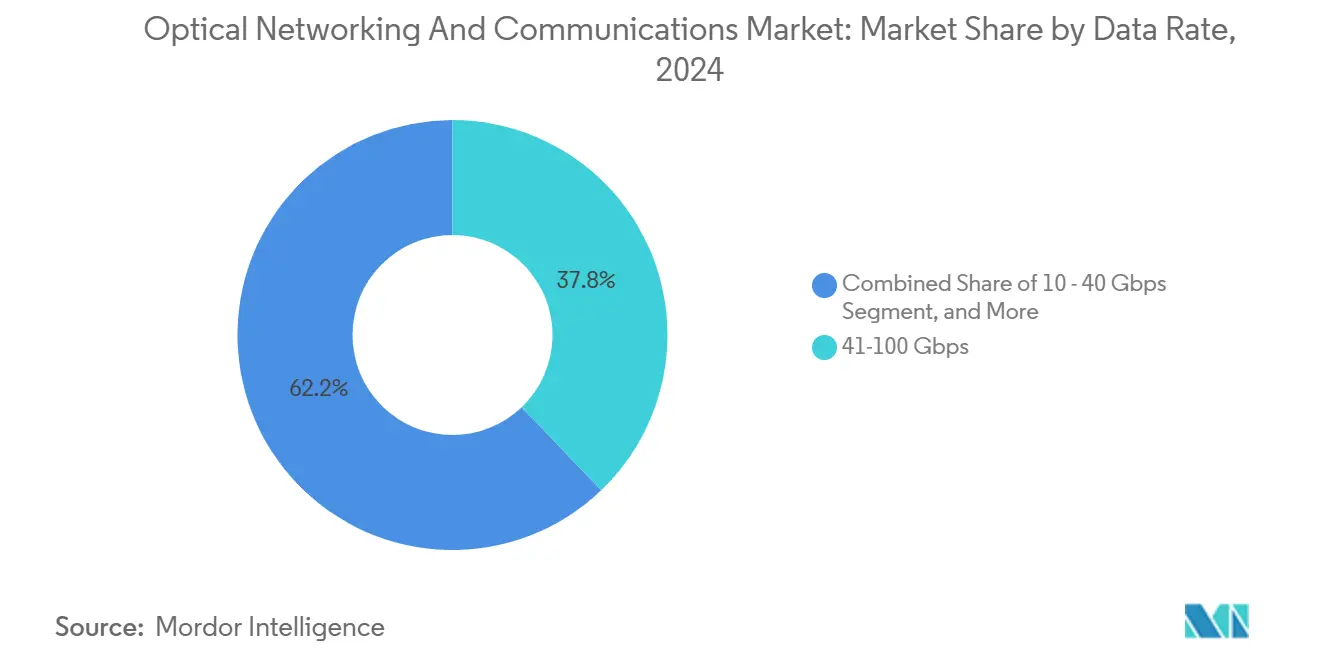
- By data rate, the 41-100 Gbps tier captured 37.83% share in 2024; systems above 400 Gbps are poised to advance at an 8.32% CAGR by 2030.
- By end-user, telecom service providers held 43.97% share in 2024, whereas cloud and colocation data centers are expected to register a 7.72% CAGR to 2030.
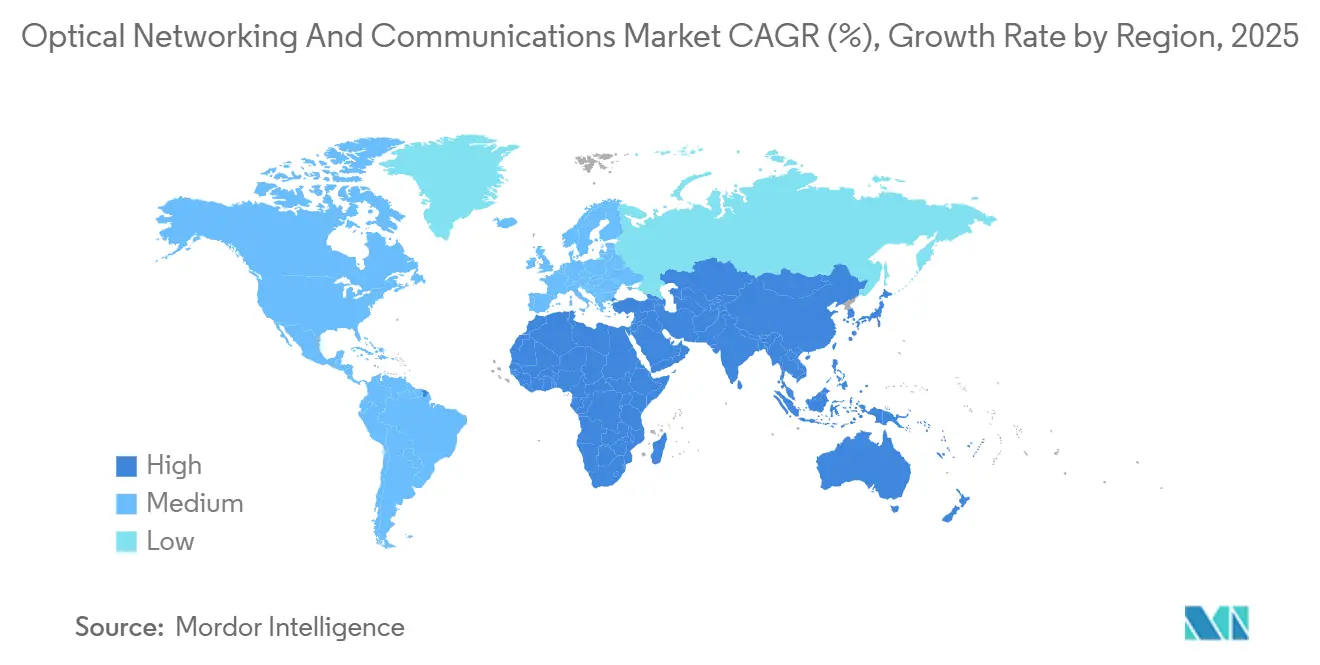
- By geography, Asia-Pacific commanded 37.16% of the optical networking and communications market share in 2024 and is projected to post a 7.91% CAGR through 2030.
Global Optical Networking And Communications Market Trends and Insights
Drivers Impact Analysis*
| Driver | (~) % Impact on CAGR Forecast | Geographic Relevance | Impact Timeline |
|---|---|---|---|
| Surge in hyperscale data-center interconnect bandwidth demand | +1.8% | Global, concentrated in North America and Asia-Pacific | Medium term (2-4 years) |
| Acceleration of 5G backhaul and fronthaul fiber deployments | +1.5% | Global, led by Asia-Pacific and Europe | Short term (≤ 2 years) |
| Rapid adoption of coherent 400G/800G pluggable optics | +1.2% | North America and Europe, expanding to Asia-Pacific | Medium term (2-4 years) |
| Government-funded national fiber broadband projects | +0.9% | North America and Europe, selective Asia-Pacific markets | Long term (≥ 4 years) |
| AI/ML-driven need for ultra-low-latency intra-DC optical switching | +0.7% | North America and Asia-Pacific hyperscale regions | Short term (≤ 2 years) |
| Disaggregated open optical line systems enabling multi-vendor savings | +0.4% | Global, early adoption in North America | Medium term (2-4 years) |
| Source: Mordor Intelligence | |||
Surge in Hyperscale Data-Center Interconnect Bandwidth Demand
Hyperscalers project a sixfold traffic jump within five years as AI cluster architectures replace CPU-centric designs. Dual 800G coherent pluggables built on 3 nm ASICs enable 1.6 Tb/s wavelengths that double capacity per channel and slice power budgets in half. [1]“Telia Lithuania deploys WaveLogic 5 Extreme for country-wide 800 Gb/s service,” Ciena Corporation, CIENA.COM Higher port counts and longer reach optical circuit switching minimize latency between GPU pods. Power-efficiency mandates drive a pivot from intensity-modulated direct-detect optics toward coherent solutions delivering superior bits-per-watt. As AI training footprints swell, network operators prioritize spectral efficiency to postpone costly new fiber builds. These dynamics sustain long-run demand for leading-edge coherent hardware across metro and long-haul domains.
Acceleration of 5G Backhaul and Fronthaul Fiber Deployments
5G densification multiplies small-cell counts, forcing operators to swap legacy microwave links for fiber able to ferry 10–100× more capacity. Lithuania’s first 800 Gb/s wavelength service, powered by WaveLogic 5 Extreme, exemplifies mobile backhaul modernization. Centralized RAN models intensify fronthaul traffic between remote radio heads and base-band units, magnifying demand for high-capacity optical transport with tight synchronization. Urban fiber builds receive regulatory tailwinds as governments chase smart-city goals. Vendors supplying 400G and 800G line cards benefit from an upgrade cadence that is shorter than traditional transport cycles. Collectively, 5G backhaul requirements reinforce revenue visibility for optical system suppliers through mid-decade.
Rapid Adoption of Coherent 400G/800G Pluggable Optics
Shifting coherent engines into QSFP-DD and OSFP modules democratizes high-end performance for smaller carriers and enterprises. Lightpath’s 400G protected circuits slashed power usage by 80% while preserving five-nines availability. Standardized pluggables streamline inventory and enable pay-as-you-grow scaling compared with proprietary line cards. Hyperscalers gravitate to 800G and future 1.6T modules to maximize rack-unit density in power-capped data halls. Open network architectures welcome multi-vendor coherent plug adoption, tempering total-cost-of-ownership and accelerating innovation cycles. As performance leadership migrates from chassis to module, suppliers with advanced DSP and photonic integration enjoy an expanded addressable base.
Government-Funded National Fiber Broadband Projects
USD 42.5 billion under the BEAD program exemplifies how public funds bridge rural connectivity gaps. Ciena and Flex ramp domestic pluggable OLT production that satisfies Build America, Buy America clauses, lending a competitive edge to U.S. manufacturers. Similar schemes in Canada, Germany, and Japan earmark fiber as critical infrastructure, funneling multi-year procurement toward established vendors with carrier-grade pedigrees. Long payback cycles favor robust, standards-based gear over bleeding-edge features, segmenting demand by performance class. Additionally, mandated domestic content de-risks supply chains and nurtures local photonics ecosystems. These policies elongate the revenue runway for optical networking and communications market participants focused on broadband access.
Restraints Impact Analysis*
| Restraint | (~) % Impact on CAGR Forecast | Geographic Relevance | Impact Timeline |
|---|---|---|---|
| High capital expenditure to upgrade legacy networks | -1.3% | Global, particularly acute in mature markets | Long term (≥ 4 years) |
| Persistent supply-chain constraints for photonic ICs | -0.8% | Global, concentrated impact in North America and Europe | Medium term (2-4 years) |
| Skilled-labor shortage in photonic packaging and testing | -0.6% | North America and Europe, emerging in Asia-Pacific | Long term (≥ 4 years) |
| Heightened cyber-security vetting of foreign optical modules | -0.4% | North America and Europe, selective Asia-Pacific markets | Medium term (2-4 years) |
| Source: Mordor Intelligence | |||
High Capital Expenditure to Upgrade Legacy Networks
Modernizing proprietary optical line systems often requires forklift swaps that double opex during migration windows. Financial traders chasing microsecond latency gains can face nine-figure network budgets. [2]“Ultra-low latency OTN technologies boosting brokerage competitiveness,” Lightwave, LIGHTWAVEONLINE.COM Depreciation cycles (7–10 years) rarely align with fast-moving coherent roadmaps, prompting CFO pushback on early asset write-downs. Smaller telcos struggle to secure funding amid rising interest rates and, slowing adoption of next-gen platforms. Multi-domain operation adds complexity, as teams must run legacy and new systems in parallel to safeguard service-level agreements. These cost headwinds temper the otherwise robust optical networking and communications market outlook.
Persistent Supply-Chain Constraints for Photonic ICs
Germanium prices jumped 75% after export restrictions, and gallium could climb 250%, underscoring material single-source exposure. [3]“What impact is China’s export ban on critical materials for optics having?” Laser Focus World, LASERFOCUSWORLD.COM Few fabs can process InP or silicon-photonics wafers at scale, extending component lead times beyond 52 weeks. Geopolitical frictions threaten access to contract foundries, pushing vendors into multi-year redesigns around alternative substrates. Governments respond with CHIPS-style incentives; Infinera secured up to USD 93 million for U.S. fab upgrades. Nevertheless, relief is not immediate, extending the drag on equipment shipments through the medium term and dampening optical networking and communications market expansion.
*Our forecasts treat driver/restraint impacts as directional, not additive. The impact forecasts reflect baseline growth, mix effects, and variable interactions.
Segment Analysis
By Component: Transceivers Anchor Revenue While Fiber Accelerates
Transceivers delivered 34.23% of the optical networking and communications market share in 2024, mirroring their pivotal role as electro-optical gateways. Parallel government broadband builds propel fiber’s 7.67% CAGR, establishing the passive backbone before active gear upgrades. The optical networking and communications market size tied to fiber deployments is projected to compound steadily as rural projects break ground. Meanwhile, switches, routers, and amplifiers harvest incremental demand from open-line system adoption that separates transport and routing roles. Amplifier volumes swell on ultra-long-haul routes such as the 45,000 km 2Africa cable that relies on 800G wavelengths. Component mix shifts gradually, yet transceivers remain the highest-margin layer due to dense DSP integration and advanced photonic packaging.
Rising 800G pluggable adoption enhances transceiver ASPs, cushioning volume volatility. Fiber suppliers chase yield improvements in ultra-low-attenuation glass to accommodate 1.6 Tb/s carriers. Switch fabric vendors add coherent ports, blurring boundaries with traditional transport gear. The confluence of open-networking trends and energy mandates steers buyers toward solutions that optimize bits per watt, lifting demand for integrated transceiver-line-system offerings. Consequently, the component landscape balances transceiver revenue leadership with brisk fiber volume expansion across the forecast window.


By Technology: WDM Leads but Coherent Innovates Faster
WDM preserved 51.46% revenue share in 2024, leveraging entrenched deployments across metro and long-haul routes. However, optical networking and communications market leaders increasingly favor coherent modulation to stretch spectral efficiency, yielding an 8.14% CAGR for coherent systems. The optical networking and communications market size attached to coherent upgrades scales rapidly as 400G/800G pluggables mature. Passive optical networks retain momentum in fiber-to-home rollouts, while SONET/SDH sees a gradual sunset except where strict timing is non-negotiable.
Coherent’s ascendancy stems from DSP progress that unlocks probabilistic constellation shaping and higher baud rates without fresh fiber digs. OpenZR+ and OIF-defined 800LR standards accelerate multi-vendor interoperability, curbing vendor lock-in. Conversely, WDM incumbency assures a lengthy tail of maintenance revenues for legacy gear. The interplay between cost-optimized PAM4 and premium coherent channels fosters network tiering, matching technology to route distance and capacity need. Overall, coherent advances reshape competitive moats as innovation migrates from optical layer plumbing to silicon domain expertise.
By Data Rate: Ultra-High Speeds Take the Growth Crown
The 41-100 Gbps cohort captured 37.83% revenue share in 2024 thanks to widespread 100G metro rollouts. Yet, above-400 Gbps lanes chart the swiftest 8.32% CAGR, fueled by 800G line cards and early 1.6 T prototypes. The optical networking and communications market size for >400 Gbps systems surges as AI clusters demand bandwidth-dense east-west traffic paths. Mid-band segments (101-400 Gbps) bridge legacy 100G and cutting-edge 800G adoption, stabilizing upgrade cycles for tier-2 operators.
Field trials like AT&T’s 1.6 Tb/s 296 km route confirm commercial viability for terabit-scale transport. Vendor roadmaps hint at 3.2 Tb/s wavelengths by decade-end, extending Moore’s law-style optics scaling. Nevertheless, low-speed segments persist in access networks where cost trumps capacity. As operators weigh fiber exhaust risk, they tilt toward higher line rates, reducing per-bit opex and deferring civil works. This dynamic anchors sustained demand for DSP-rich transceivers that ride advanced process nodes.
By End-User: Data Centers Outpace Traditional Telcos
Telecom carriers retained a 43.97% share in 2024, yet cloud and colocation facilities post a sharper 7.72% CAGR as AI workloads reshape traffic profiles. Data centers favor coherent pluggables that condense 800G into 1 RU pizza-boxes, optimizing scarce rack power. The optical networking and communications market size tied to hyperscale campuses thus expands faster than that linked to nationwide telco footprints. Enterprises modernize campus-to-cloud backbones, adding steady but smaller volumes. Government and defense segments buy for security and survivability, sustaining niche demand.
Healthcare and utilities adopt telemedicine and smart-grid applications that crave deterministic latency. Hospital networks such as Atlantic Health employ redundant coherent paths for medical imaging. End-user diversification reduces cyclicality, yet vendor go-to-market models increasingly bifurcate between carrier-grade and data-center-centric portfolios. This customer mix evolution steers R&D toward lower-power, higher-density optics tuned for switch-to-switch links versus long-haul spans.
Geography Analysis
Asia-Pacific’s 37.16% revenue share and 7.91% CAGR underscore unrivaled fiber investment scale. China Mobile’s metro 400G rollouts and NTT’s 6G optics research headline the region’s innovation clout. Manufacturing clusters across China and Japan compress hardware costs, reinforcing regional export competitiveness. India and South Korea add upside through 5G densification and smart-city agendas.
North America ranks second, buoyed by hyperscale data-center expansions and the BEAD-funded rural fiber marathon. Build America, Buy America clauses steer purchases toward domestic plants such as Ciena’s Flex line, strengthening supply sovereignty. Frontier trials, including AT&T’s 1.6 Tb/s transport, validate North American appetite for bleeding-edge speeds. Canada and Mexico modernize cross-border routes, rounding out continental demand.
Europe posts measured growth under a digital-sovereignty banner. euNetworks’ 1.6 Tb/s Amsterdam-Düsseldorf link signals operator readiness to leapfrog to WaveLogic 6 performance. Germany, the U.K., and France spearhead data-center builds, while Eastern markets pursue backbone refreshes. Regulatory carbon targets push energy-efficient coherent gear, shaping procurement specs.
Middle East and Africa ride submarine mega-projects such as 2Africa’s 45,000 km 800G chain that stitches 33 nations. Gulf smart-city blueprints elevate metro fiber density, whereas African states focus on undersea landings to ignite inland connectivity. South America experiences gradual modernization led by Brazil and Chile, with opportunities tied to Pacific and Atlantic cable landings. Collectively, regional disparities reflect differential stages of digital-infrastructure maturity yet converge on coherent optics as the common upgrade denominator in the optical networking and communications market.

Competitive Landscape
Moderate consolidation intensified with Nokia’s USD 2.3 billion Infinera buyout, forging a challenger to Ciena and Huawei. Proprietary DSP roadmaps such as WaveLogic 6 Extreme’s 1.6 Tb/s single-carrier feat exemplify innovation moats. Suppliers owning coherent IP plus control-plane software win end-to-end deals, marginalizing single-component specialists.
Strategic tilt toward data-center fabrics sees vendors adding Ethernet-switch silicon or aligning with open compute projects. Disaggregated open-line systems enable smaller entrants to sell niche ROADMs or Raman amps that slot into carrier builds. Infinera’s CHIPS-Act grant highlights the government's resolve to localize photonics chains. Geopolitics injects complexity as Western telcos vet foreign modules for security compliance, benefiting domestic suppliers.
Competition pivots on power efficiency per Gb and automated telemetry for self-healing networks. Players such as Huawei push optical-electrical-optical convergence, while Ciena invests in zero-touch provisioning. Market share battles shift toward vertical integration depth, ecosystem openness, and factory localization, shaping buyer evaluations across the optical networking and communications market.
Optical Networking And Communications Industry Leaders
Ciena Corporation
Infinera Corporation
Lumentum Holdings Inc.
Coherent Corp.
Acacia Communications, Inc.
- *Disclaimer: Major Players sorted in no particular order

Recent Industry Developments
- March 2025: AT&T trialed 1.6 Tb/s over 296 km Newark-Philadelphia fiber, quadrupling present speeds.
- February 2025: Nokia finalized its USD 2.3 billion Infinera acquisition, bolstering coherent optics breadth.
- January 2025: Ciena introduced a 1.6 Tb/s Coherent-Lite pluggable aimed at hyperscalers’ AI clusters.
- January 2025: Ciena demoed 448G PAM4 lanes and 1.6 T prototypes at the OCP Summit.


Global Optical Networking And Communications Market Report Scope
| Optical Transceivers |
| Optical Fiber |
| Optical Switches and Routers |
| Optical Amplifiers |
| Optical Cables |
| Other Components |
| Wavelength-Division Multiplexing (WDM) |
| Synchronous Optical Networking (SONET/SDH) |
| Fiber Channel |
| Passive Optical Network (PON) |
| Coherent Optical Transmission |
| Other Technologies |
| Less than 10 Gbps |
| 10 - 40 Gbps |
| 41 - 100 Gbps |
| 101 - 400 Gbps |
| Above 400 Gbps |
| Telecom Service Providers |
| Cloud and Colocation Data Centers |
| Enterprises |
| Government and Defense |
| Healthcare and Utilities |
| Other End-Users |
| North America | United States | |
| Canada | ||
| Mexico | ||
| Europe | Germany | |
| United Kingdom | ||
| France | ||
| Russia | ||
| Rest of Europe | ||
| Asia-Pacific | China | |
| Japan | ||
| India | ||
| South Korea | ||
| Australia | ||
| Rest of Asia-Pacific | ||
| Middle East and Africa | Middle East | Saudi Arabia |
| United Arab Emirates | ||
| Rest of Middle East | ||
| Africa | South Africa | |
| Egypt | ||
| Rest of Africa | ||
| South America | Brazil | |
| Argentina | ||
| Rest of South America | ||
| By Component | Optical Transceivers | ||
| Optical Fiber | |||
| Optical Switches and Routers | |||
| Optical Amplifiers | |||
| Optical Cables | |||
| Other Components | |||
| By Technology | Wavelength-Division Multiplexing (WDM) | ||
| Synchronous Optical Networking (SONET/SDH) | |||
| Fiber Channel | |||
| Passive Optical Network (PON) | |||
| Coherent Optical Transmission | |||
| Other Technologies | |||
| By Data Rate | Less than 10 Gbps | ||
| 10 - 40 Gbps | |||
| 41 - 100 Gbps | |||
| 101 - 400 Gbps | |||
| Above 400 Gbps | |||
| By End-User | Telecom Service Providers | ||
| Cloud and Colocation Data Centers | |||
| Enterprises | |||
| Government and Defense | |||
| Healthcare and Utilities | |||
| Other End-Users | |||
| By Geography | North America | United States | |
| Canada | |||
| Mexico | |||
| Europe | Germany | ||
| United Kingdom | |||
| France | |||
| Russia | |||
| Rest of Europe | |||
| Asia-Pacific | China | ||
| Japan | |||
| India | |||
| South Korea | |||
| Australia | |||
| Rest of Asia-Pacific | |||
| Middle East and Africa | Middle East | Saudi Arabia | |
| United Arab Emirates | |||
| Rest of Middle East | |||
| Africa | South Africa | ||
| Egypt | |||
| Rest of Africa | |||
| South America | Brazil | ||
| Argentina | |||
| Rest of South America | |||


Key Questions Answered in the Report
How fast will global spending on optical networking rise through 2030?
The optical networking and communications market is projected to expand from USD 20.25 billion in 2025 to USD 28.65 billion by 2030, reflecting a 7.19% CAGR.
Which region contributes the most revenue today?
Asia-Pacific leads with 37.16% share owing to large-scale fiber deployments and advanced 6G research programs.
Why are coherent pluggable optics gaining traction?
Coherent 400G/800G modules provide higher spectral efficiency and lower power draw, letting operators boost capacity without forklift upgrades.
What data rate tier is growing the quickest?
Systems above 400 Gbps post the fastest 8.32% CAGR as hyperscalers migrate toward 800G and early 1.6T links.
How did Nokia’s Infinera acquisition alter competition?
The USD 2.3 billion deal created a stronger challenger to Ciena and Huawei by combining deep coherent DSP portfolios with expanded global reach.
What material shortages threaten optical hardware supply?
Export restrictions on germanium and gallium elevated prices and highlighted dependence on a narrow set of photonic IC foundries.
Page last updated on:


