Fiber Optic Component Market Size and Share
Market Overview
| Study Period | 2020 - 2031 |
|---|---|
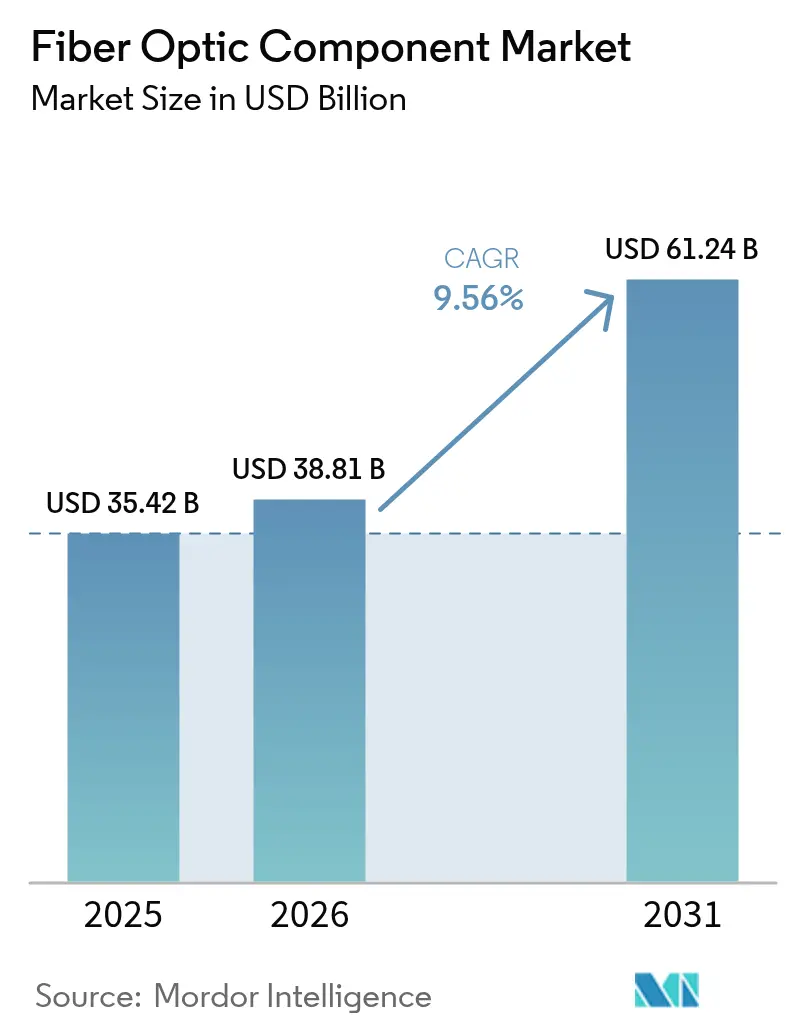
| Market Size (2026) | USD 38.81 Billion |
| Market Size (2031) | USD 61.24 Billion |
| Growth Rate (2026 - 2031) | 9.56% CAGR |
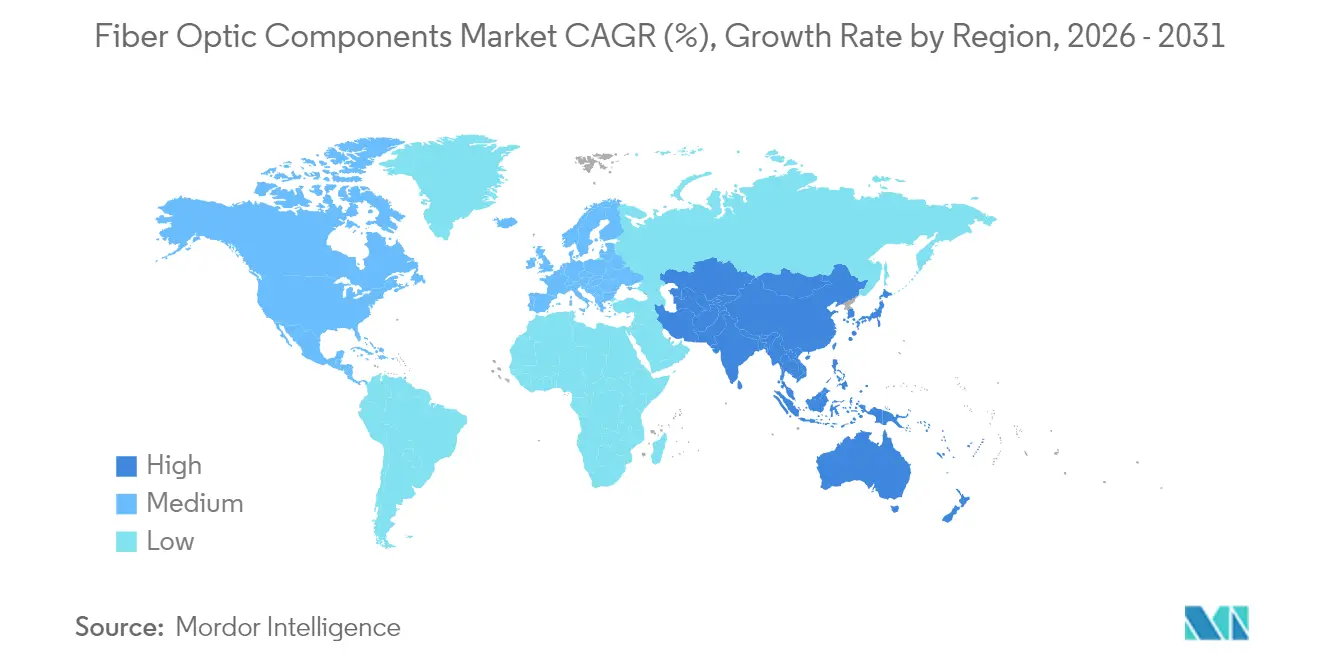
| Fastest Growing Market | Asia Pacific |
| Largest Market | Asia Pacific |
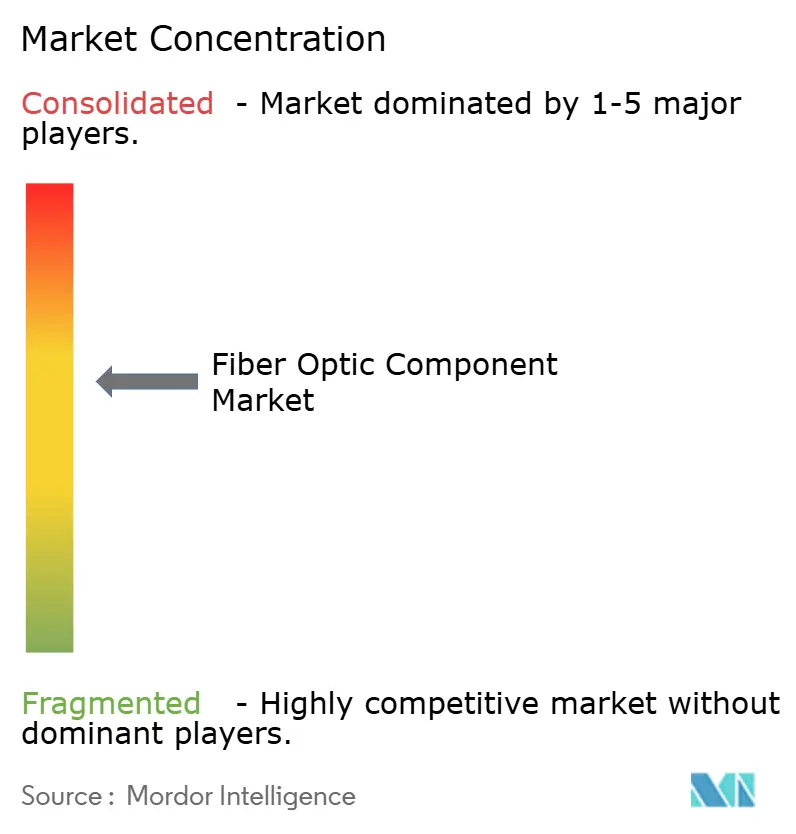
| Market Concentration | Medium |
Major Players *Disclaimer: Major Players sorted in no particular order Image © Mordor Intelligence. Reuse requires attribution under CC BY 4.0. | |
Fiber Optic Component Market Analysis by Mordor Intelligence
Fiber Optic Component Market size in 2026 is estimated at USD 38.81 billion, growing from 2025 value of USD 35.42 billion with 2031 projections showing USD 61.24 billion, growing at 9.56% CAGR over 2026-2031.
This expansion underscores the fiber optic component market resilience as global networks pivot to artificial intelligence workloads, 5G densification, and quantum-safe communication. Supply-chain pressures on critical compound semiconductors have amplified vertical integration strategies among major vendors while motivating accelerated R&D on alternative materials. In parallel, hyperscale data-center operators reserve long-term capacity commitments that stabilize demand visibility for cable manufacturers and photonic chipmakers. Government-funded rural broadband programs in the United States, the European Union, and key Asia Pacific economies are reinforcing baseline consumption of passive optical infrastructure across both mature and developing regions.
Key Report Takeaways
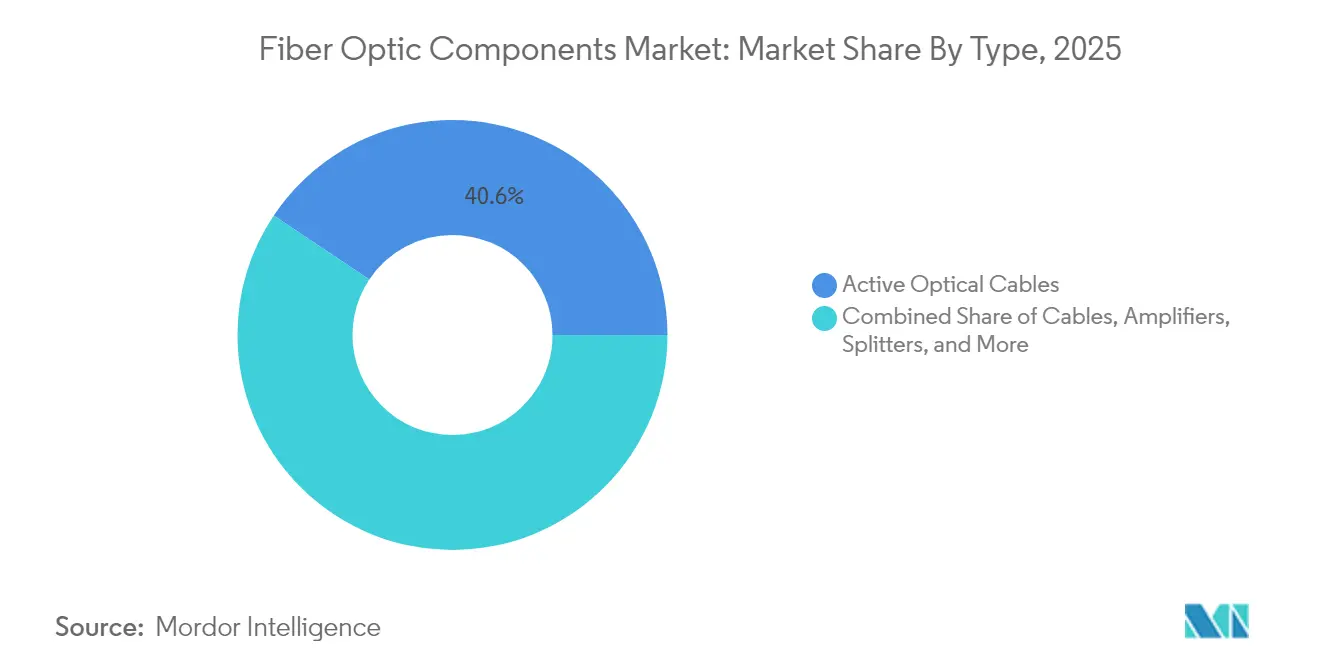
- By type, optical cables commanded 40.62% of the fiber optic component market share in 2025, while active optical cables are projected to expand at an 10.97% CAGR to 2031.
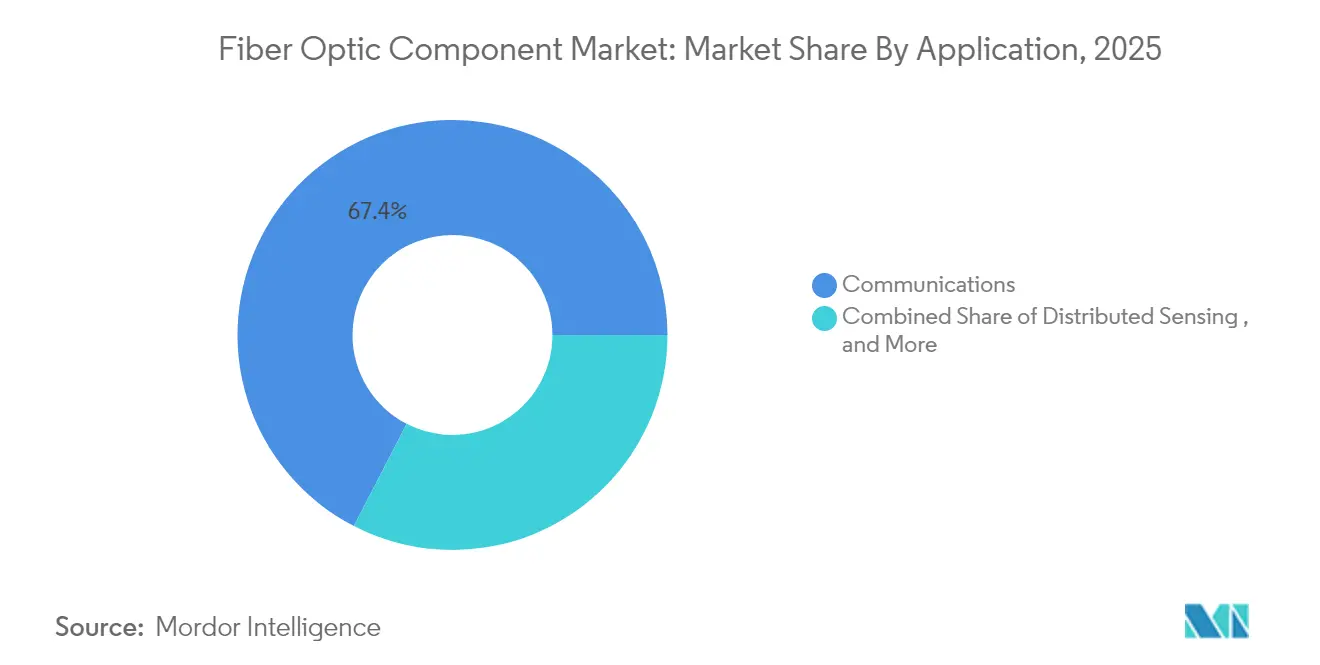
- By application, communications held 67.42% revenue share in 2025; the same segment also records the fastest 10.72% CAGR through 2031.
- By end-user, telecom operators retained 55.38% share of the fiber optic component market size in 2025, whereas hyperscale and enterprise data centers are advancing at 12.01% CAGR.
- By geography, Asia Pacific led with 38.74% share in 2025 and is projected to grow at a 10.44% CAGR to 2031.
Note: Market size and forecast figures in this report are generated using Mordor Intelligence’s proprietary estimation framework, updated with the latest available data and insights as of 2026.
Global Fiber Optic Component Market Trends and Insights
Drivers Impact Analysis*
| Driver | (~) % Impact on CAGR Forecast | Geographic Relevance | Impact Timeline |
|---|---|---|---|
| Hyperscale-data-center fiber refresh wave | +2.10% | Global, concentrated in North America and the Asia Pacific | Medium term (2–4 years) |
| 5G fronthaul/backhaul densification | +1.80% | Global, with early deployment in Asia Pacific and Europe | Short term (≤ 2 years) |
| AI/ML optics > 800 Gb accelerating PAM4/Co-Packaged Optics | +2.40% | North America and Asia Pacific, spillover to Europe | Medium term (2–4 years) |
| Rapid FTTH rollout in emerging APAC and Africa | +1.60% | Asia Pacific and Africa | Long term (≥ 4 years) |
| Source: Mordor Intelligence | |||
Hyperscale-data-center fiber refresh wave
Surging generative-AI training clusters require far denser optical interconnects than legacy cloud nodes. Corning reported a 46% year-over-year jump in optical-communications revenue to USD 1.36 billion during Q1 2025, underpinned by a multi-year supply agreement that reserves 10% of its global fiber output for a single data-center operator[1]Wendell Weeks, “Corning Q1 2025 Results Highlight Optical Surge,” Corning Incorporated, corning.com. Optical transceiver shipments exceeded USD 3 billion in Q2 2024, marking the strongest sequential revenue performance since 2019. Equipment vendors are redesigning leaf-and-spine architectures around 800 G and 1.6 T optics, which requires higher-grade bend-insensitive fiber inside cable trays. These shifts elevate demand for low-loss fiber types and advance orders for co-packaged optics. The broad refresh cycle increases visibility for component suppliers over a multi-year horizon.
5G fronthaul and backhaul densification
Wide-scale standalone 5G rollouts multiply fiber counts from radio head to baseband unit. Thailand’s Village Broadband Internet initiative extended fiber to 24,700 remote communities by March 2025. Malaysia’s national broadband project, valued at MYR 21 billion (USD 4.4 billion), upgraded 60% of premises to fiber as of December 2024. Sumitomo Electric’s 0.07-millisecond converter improves the time-synchronization precision needed for fronthaul coordination[4]Hiroshi Nishihara, “0.07 ms Converter for Remote 3D Visuals,” Sumitomo Electric, sumitomoelectric.com. Prysmian’s latest ultra-high-density ribbon cables help operators push more fibers into constrained ducts Prysmian Group. These deployments transform network topologies toward distributed architectures, lifting demand for connectors, closures, and low-latency cables.
AI/ML optics accelerating PAM4 and co-packaged integration
Lumentum demonstrated an enhanced 800 G ZR+ transceiver fabricated on proprietary indium-phosphide technology, doubling its datacom chip order backlog by mid-2025. The company expanded backend assembly lines in Thailand to mitigate material bottlenecks and shorten lead times. Shanghai Jiao Tong University has scaled thin-film lithium-niobate photonic chip production, which could broaden ecosystem access to high-speed modulators. Suppliers shipped more than 20 million 400 G and 800 G optical modules in 2024, signalling broad acceptance of PAM4 signalling for advanced AI clusters. As model sizes rise, operators must trim power budgets, making co-packaged optics a default choice at 51.2 T switch capacity. Continuous feedback between AI system architects and photonics engineers accelerates successive design-win cycles.
Rapid FTTH expansion in emerging markets
Indonesia initiated a national optical backbone to bridge digital gaps across 4,200 islands, while the Philippines’ USD 288 million National Fiber Backbone spans 1,245 kilometers and targets 70 million new users by 2028. India committed USD 16.1 billion to rural broadband, having already connected 270,000 villages by April 2025. Australia’s Better Connectivity Plan earmarked AUD 1.1 billion (USD 740 million) for rural fiber corridors. Such projects assure long-tail demand for passive infrastructure, diversify supplier revenue beyond hyperscale clients, and set the stage for future 5G and smart-grid services.
Restraints Impact Analysis*
| Restraint | (~) % Impact on CAGR Forecast | Geographic Relevance | Impact Timeline |
|---|---|---|---|
| Shortage of indium-phosphide and gallium-arsenide epi-capacity | −1.4% | Global, acute impact in Asia Pacific manufacturing | Short term (≤ 2 years) |
| Geopolitical export controls on advanced photonics to China | −1.1% | Global supply chains, concentrated in Asia Pacific | Medium term (2–4 years) |
| Source: Mordor Intelligence | |||
Shortage of indium-phosphide and gallium-arsenide epi-capacity
China’s export restriction on gallium and germanium in 2023 lifted spot prices by 250% and 75%, respectively. The U.S. Geological Survey calculated a potential USD 3.4 billion GDP hit if bans become absolute. Coherent’s new six-inch indium-phosphide wafer line in Texas promises 60% cost reduction once fully ramped, quadrupling die output per wafer. Fraunhofer ISE’s InP-on-GaAs substrates lower wafer costs by 80% and enable eight-inch pilot runs. Even so, tooling cycles limit near-term relief, forcing contract manufacturers to prioritize high-margin transceiver customers and extend delivery windows on lower-speed parts.
Geopolitical export controls are fragmenting global supply chains
U.S. export rules targeting photonic integrated circuits complicate supply contracts that previously leveraged Asia Pacific back-end capacity. Chinese foundries are accelerating domestic photonic chip programs to reduce dependency on imported epitaxy equipment. Parallel supply chains raise costs due to duplicated R&D and compliance audits. European vendors must file dual-use license applications for every new high-speed transceiver family, lengthening time-to-market. Multiregional qualification of assembly locations spreads risk but strains working-capital budgets. While fragmentation spurs localized innovation clusters, it weighs on near-term volumes and margins.
*Our forecasts treat driver/restraint impacts as directional, not additive. The impact forecasts reflect baseline growth, mix effects, and variable interactions.
Segment Analysis
By Type: Active Optical Cables Outpace Traditional Infrastructure
Optical cables retained a 40.62% share of the fiber optic component market in 2025, driven by entrenched deployments in metro and long-haul backbones. The fiber optic component market size for this segment reached USD 14.39 billion, reflecting the dominance of passive cable spending in large state-funded rollouts. However, active optical cables post an 10.97% CAGR to 2031 as hyperscale operators migrate to fully integrated, pluggable links inside server racks. Demand for amplifiers and splitters remains tied to point-to-point upgrades on existing routes, particularly where governments finance rural reach projects.
Adoption of co-packaged optics turns active cables into short-reach engines of bandwidth scaling. Corning introduced Gen-AI fiber assemblies with integrated power-optimized connectors aimed at 102.4 T switch enclosures. Transceiver makers bundle digital signal processors with photonic dies, shrinking footprint while lifting energy efficiency. The active segment thereby captures incremental share by substituting traditional trunks at datacom distances below 100 meters. Suppliers that couple glass-drawing expertise with module integration stand to gain follow-on design wins.


By Application: Communications Dominance Amid Diversification
Communications accounted for 67.42% of revenue and exhibited the highest 10.72% CAGR, reinforcing the fiber optic component market share leadership of service providers and data center interconnects. Fiber optic component industry observers note that distributed sensing and medical instrumentation have begun to command premium pricing, yet their volumes remain modest relative to broadband access. The fiber optic component market size tied to communications is set to breach USD 41.3 billion by 2031, as 800 G optics proliferate.
Healthcare deployments illustrate lateral growth. A Shenzhen hospital upgraded to an all-optical LAN and reported a 60% improvement in triage data access times. Tele-robotic surgery trials in Europe used 5G-backed fiber strands to achieve sub-35-millisecond round-trip latency. In industrial settings, distributed acoustic sensing safeguards pipelines and rail corridors. Despite diversifying use cases, communications spending anchors supplier volume forecasts, ensuring economies of scale that subsequently benefit niche applications.
By End-User: Hyperscale Data Centers Drive Market Transformation
Telecom operators locked in a 55.38% share in 2025 owing to cumulative rights-of-way and universal service mandates. Yet the hyperscale and enterprise data-center segment is advancing at 12.01% CAGR and is projected to reach USD 19.95 billion by 2031. This shift tilts R&D toward low-power VCSEL arrays and silicon photonics engines customized for AI workloads.
Corning forecasts a 30% compound sales increase in its enterprise division through 2027 as cloud providers pre-buy capacity. Defense agencies add counter-drone fiber links that demand battle-hardening, while energy majors equip methane-leak monitoring systems with fiber interferometers. Such divergence spreads revenue risk and spurs specialized connector formats, including expanded-beam and hermaphroditic assemblies. Suppliers agile enough to straddle high-volume telecom orders and lower-volume, ruggedized defense contracts secure balanced portfolios.
Geography Analysis
Asia Pacific held 38.74% of the fiber optic component market in 2025 and is growing at 10.44% CAGR. China’s 50 G passive optical network rollout and 10-gigabit city program create step-function increases in optical-line-terminal capacity. Japan’s National Institute of Information and Communications Technology demonstrated 1.02 Pbit/s transmission across 1,808 kilometers, proving that existing terrestrial fiber can meet long-haul AI traffic. Government subsidies ensure that emerging economies such as India and the Philippines fund last-mile fiber, sustaining baseline demand even during macro-slowdowns.
North America is the second-largest regional contributor, buoyed by hyperscale campus expansions in Virginia’s data-center corridor and Oregon’s renewable-powered server farms. The U.S. Broadband Equity, Access, and Deployment (BEAD) program allocates USD 42.45 billion for unserved areas, mandating fiber where feasible. Quantum-network testbeds in Boston and Chicago validate ultra-secure key distribution over installed dark fiber, catalysing new categories of ultra-low-loss cabling.
Europe emphasizes industrial automation and quantum-safe government links. Germany recorded quantum communications over existing Deutsche Telekom fiber spanning 76 kilometers without repeaters. The UK taskforce achieved 410-kilometer quantum-secure video transmission in April 2025. Southern European utility firms invest in fiber-based SCADA upgrades, while the Nordics leverage abundant hydropower to attract AI clusters, thereby drawing co-packaged optics demand. Latin America and the Middle East & Africa remain smaller today but log double-digit growth as undersea cable landings and data-center incentives proliferate.

Competitive Landscape
The fiber optic component market displays moderate consolidation. Corning, Prysmian, Sumitomo Electric, and Furukawa collectively hold a commanding position in glass preform and cable volumes, whereas Broadcom, Lumentum, and Coherent dominate photonic integrated circuit design. Tier-one incumbents deepen vertical integration to secure material access following gallium and indium volatility. Corning’s new preform line in Poland shortens European lead times, while Prysmian installs ribbon-drawing towers in the United States to localize BEAD contracts.
Technology differentiation intensifies. Coherent’s six-inch indium-phosphide wafers unlock four-fold die counts, raising barriers for smaller foundries. NICT and Sumitomo Electric pushed coupled-core fiber to 1.02 Pbit/s across 1,808 kilometers, laying groundwork for hollow-core upgrades in the next decade[2]Hitoshi Kawashima, “455 Tb/s Stable Transmission Using Coupled-Core Fiber,” NTT Corporation, ntt.com. NTT’s 455 Tb/s multicore trials showed MIMO equalization viability, hinting at roadmap continuity before space-division multiplexing becomes mainstream. Patent litigation rises around co-packaged optic thermal-management designs, particularly among U.S. and Chinese startups.
Strategic partnerships proliferate. Lumen Technologies secured 10% of Corning’s global output through 2026, ensuring AI campus expansions proceed uninterrupted. Sumitomo Electric’s EUR 90 million acquisition of Südkabel expands high-voltage direct current cable offerings for subsea interconnects. Fraunhofer ISE collaborates with European photonics clusters to scale InP-on-GaAs substrates that bypass gallium supply risk. With capital intensity rising, mid-tier players pursue specialization niches such as medical endoscopy fibers, sensing interferometers, or airborne tactical links.
Fiber Optic Component Industry Leaders
Lumentum Holdings Inc.
Broadcom Inc.
Coherent Corp. (II-VI)
Sumitomo Electric Industries Ltd.
Accelink Technologies
- *Disclaimer: Major Players sorted in no particular order

Recent Industry Developments
- March 2025: Corning upgraded its Springboard plan, adding a Gen-AI fiber and cable system aimed at a 30% CAGR for its enterprise division.
- January 2025: NICT and Sumitomo Electric achieved 1.02 Pbit/s transmission over 1,808 kilometers using 19-core fiber, setting a capacity-distance record.
- November 2024: Sumitomo Electric introduced a 0.07-millisecond DisplayPort-to-Ethernet converter in collaboration with Sony.
- August 2024: Corning and Lumen Technologies signed a two-year agreement reserving 10% of Corning’s global capacity for AI data centers.


Research Methodology Framework and Report Scope
Market Definitions and Key Coverage
Our study defines the fiber-optic component market as revenue generated from new optical transceivers, active optical cables, cables, amplifiers, splitters, connectors, circulators, and related passive modules that enable light-based data transmission across telecom, data-center, industrial, medical, and defense networks.
According to Mordor Intelligence analysts, refurbished hardware, installation services, and discrete optical fiber cable assemblies sold as commodity bulk are outside this scope. Scope exclusion: We do not count revenues from turnkey network rollout services or copper-based hybrid connectivity solutions, which keeps the dataset strictly component focused.
Segmentation Overview
- By Type
- Cables
- Amplifiers
- Active Optical Cables
- Splitters
- Connectors
- Transceivers
- Others
- By Application
- Distributed Sensing
- Communications
- Analytical and Medical Equipment
- Lighting
- By End-user
- Telecom Operators
- Hyperscale and Enterprise Data Centers
- Industrial and Energy
- Healthcare and Life-Sciences
- Defense and Aerospace
- By Geography
- North America
- United States
- Canada
- Mexico
- South America
- Brazil
- Argentina
- Rest of South America
- Europe
- Germany
- United Kingdom
- France
- Russia
- Rest of Europe
- Asia-Pacific
- China
- Japan
- India
- South Korea
- Rest of Asia-Pacific
- Middle East and Africa
- United Arab Emirated
- Saudi Arabia
- South Africa
- Nigeria
- Rest of Middle East and Africa
- North America
Detailed Research Methodology and Data Validation
Primary Research
We complemented desk work with interviews across tier-1 component makers, hyperscale data-center architects, regional telecom operators, and photonics academics in North America, Europe, and key Asian hubs. These conversations validated price-performance roadmaps, typical module yields, and regional deployment pacing, letting us recalibrate assumptions where public data proved patchy.
Desk Research
Our team first mapped the demand pool through credible open datasets such as the International Telecommunication Union's fixed-broadband lines, TeleGeography's global submarine cable tracker, the U.S. FCC's fiber route miles, China MIIT's 5G base-station tallies, and Eurostat's data-center electricity surveys, which signal lane-count expansion. Corporate filings gathered via D&B Hoovers and news archives screened on Dow Jones Factiva supplied shipment splits, average selling prices, and regional mix for listed suppliers.
Patent trends accessed on Questel, technical papers on IEEE Xplore, and trade releases from the FTTH Council, OSA, and IEC committees further clarified emerging design shifts (e.g., 400 G coherent optics, hollow-core fiber).
The sources above illustrate, not exhaust, the wider secondary pool we relied on for baseline facts and cross-checks.
Market-Sizing & Forecasting
Our model begins with a top-down reconstruction of global port shipments built from ITU traffic growth and 5G cell-site counts, which are then tied to fiber-kilometer demand and translated into component revenue using blended ASPs. Select bottom-up roll-ups of supplier disclosures and sample channel checks act as guardrails. Critical variables include 400 G transceiver ASP erosion, FTTH household penetration gains, hyperscale rack fiber-port density, single-mode fiber price index, and average splice loss targets. Forecasts employ multivariate regression with scenario analysis to capture bandwidth elasticity and macro spending swings.
Data Validation & Update Cycle
Output is pressure-tested through variance dashboards, peer review, and anomaly flags; any deviation beyond preset thresholds triggers re-contact with industry sources before sign-off. Reports refresh annually, and an interim sweep follows material events so clients receive our latest view.
Why Mordor's Fiber Optic Component Baseline Commands Reliability
Published estimates often diverge because publishers choose different component baskets, currency conversions, and refresh cadences.
We acknowledge these gaps upfront.
Benchmark comparison
| Market Size | Anonymized source | Primary gap driver |
|---|---|---|
| USD 35.42 B | Mordor Intelligence | - |
| USD 36.69 B | Global Consultancy A | Includes resale of refurbished optics and bundles copper hybrids |
| USD 30.11 B | Industry Association B | Excludes emerging coherent pluggables and applies aggressive ASP decline |
These comparisons show that Mordor Intelligence balances inclusive yet disciplined scope choices with transparent variables, giving decision-makers a dependable, repeatable baseline that stands up to client scrutiny.


Key Questions Answered in the Report
How large is the fiber optic component market in 2026?
The fiber optic component market size is USD 38.81 billion in 2026 and is forecast to climb to USD 61.24 billion by 2031.
Which region leads the fiber optic component market growth?
Asia Pacific holds 38.74% revenue share and is expanding at a 10.44% CAGR, driven by national broadband rollouts and photonics manufacturing capacity.
What segment is growing fastest within the fiber optic component market?
Active optical cables show the highest growth at 10.97% CAGR, reflecting hyperscale data-center adoption of co-packaged optics.
How are supply-chain constraints affecting suppliers?
Gallium and indium export restrictions inflate material costs, prompting vertical integration and alternative substrate R&D such as InP-on-GaAs solutions.
What recent breakthrough sets the bandwidth benchmark?
NICT and Sumitomo Electric achieved 1.02 Pbit/s over 1,808 kilometers, demonstrating the future headroom for long-haul fiber systems.
Which end-user segment is fastest growing?
Hyperscale and enterprise data centers are advancing at 12.01% CAGR as AI training clusters demand ultra-high-speed optical interconnects.
Page last updated on:


