Optical Interconnect Market Size and Share
Market Overview
| Study Period | 2020 - 2031 |
|---|---|
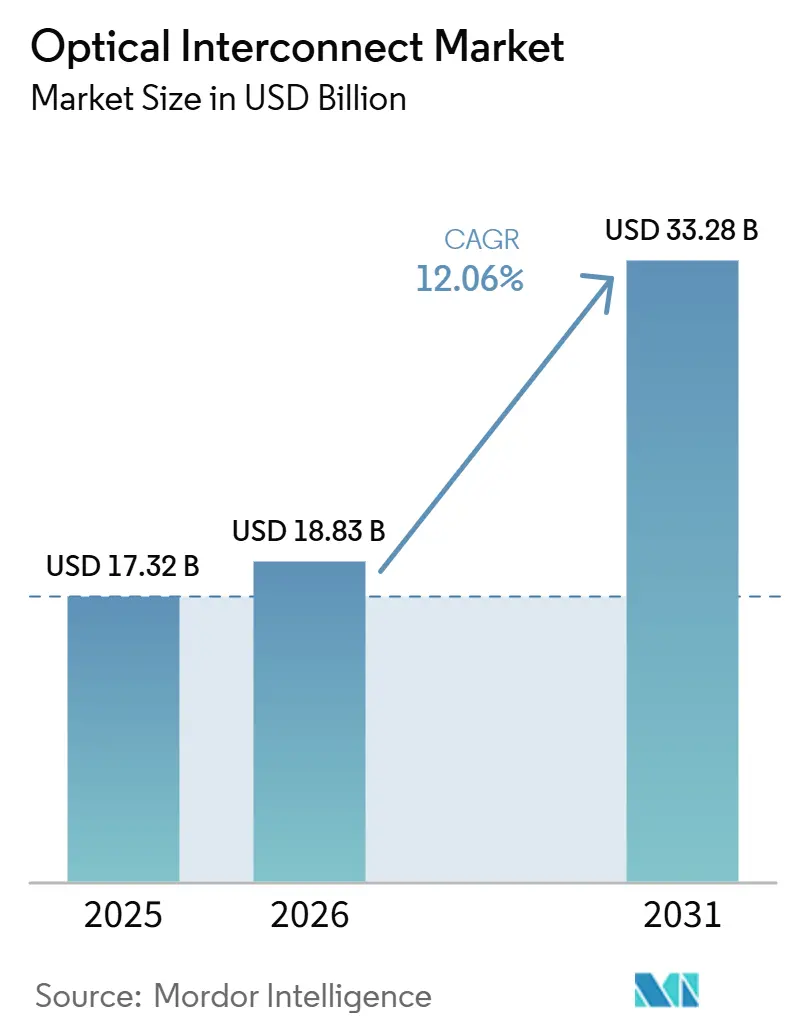
| Market Size (2026) | USD 18.83 Billion |
| Market Size (2031) | USD 33.28 Billion |
| Growth Rate (2026 - 2031) | 12.06% CAGR |
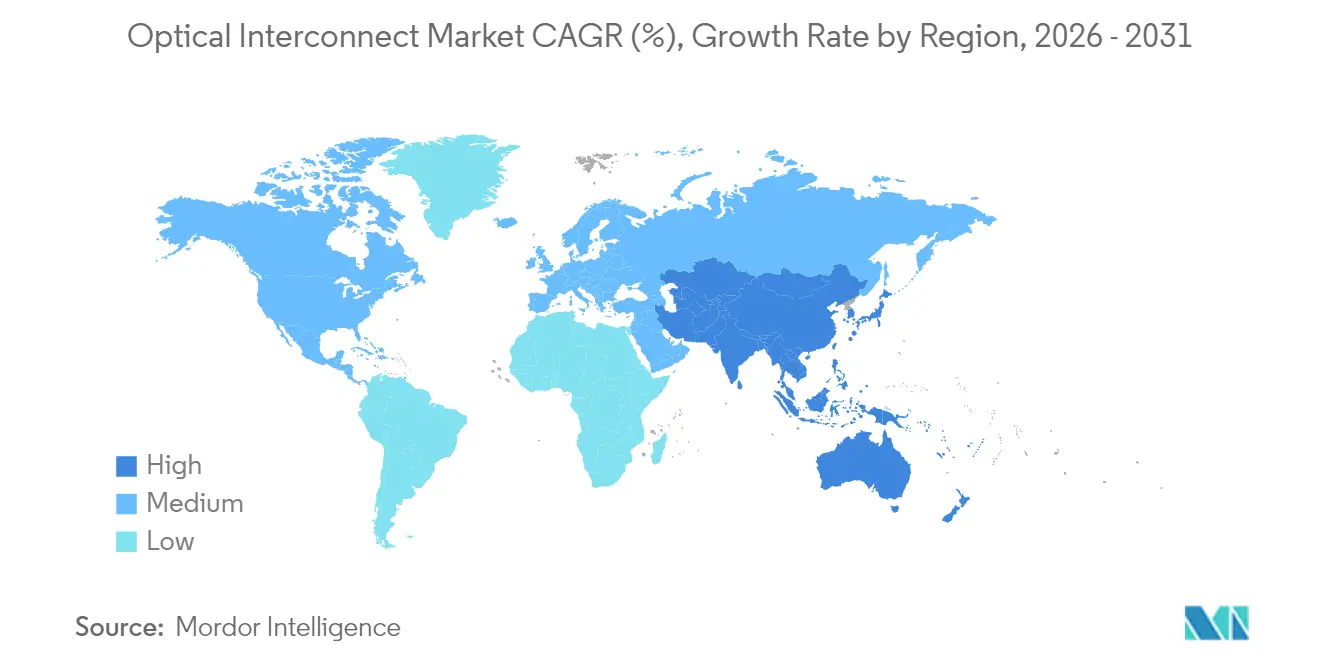
| Fastest Growing Market | Asia Pacific |
| Largest Market | North America |
| Market Concentration | Medium |
Major Players *Disclaimer: Major Players sorted in no particular order Image © Mordor Intelligence. Reuse requires attribution under CC BY 4.0. | |
Optical Interconnect Market Analysis by Mordor Intelligence
The Optical Interconnect Market size is projected to be USD 17.32 billion in 2025, USD 18.83 billion in 2026, and reach USD 33.28 billion by 2031, growing at a CAGR of 12.06% from 2026 to 2031. [1]Corning Incorporated, “Fiber Connectivity for AI-Ready Data Centers,” corning.comRising bandwidth requirements from artificial intelligence and high-performance computing workloads, the migration from copper to photonics, and rapidly expanding hyperscaler capital expenditure underpin this growth trajectory. Embedded optical modules gain momentum as co-packaged optics bridges the gap between switch ASICs and photonic I/O, while single-mode links dominate long-reach topologies as cloud operators scale geographically distributed data centers.[2]Broadcom Inc., “51.2 Tbps Co-Packaged Optics Platform,” broadcom.comCommercial 800G deployments and the early ramp of 1.6 T solutions keep the technology roadmap ahead of traffic growth, helping operators reduce fiber counts and improve power efficiency. Strategic acquisitions by Broadcom, Intel, and AMD tighten control over silicon photonics IP, signaling sustained investment in advanced packaging, indium phosphide wafer scaling, and integrated cooling technologies.
Key Report Takeaways
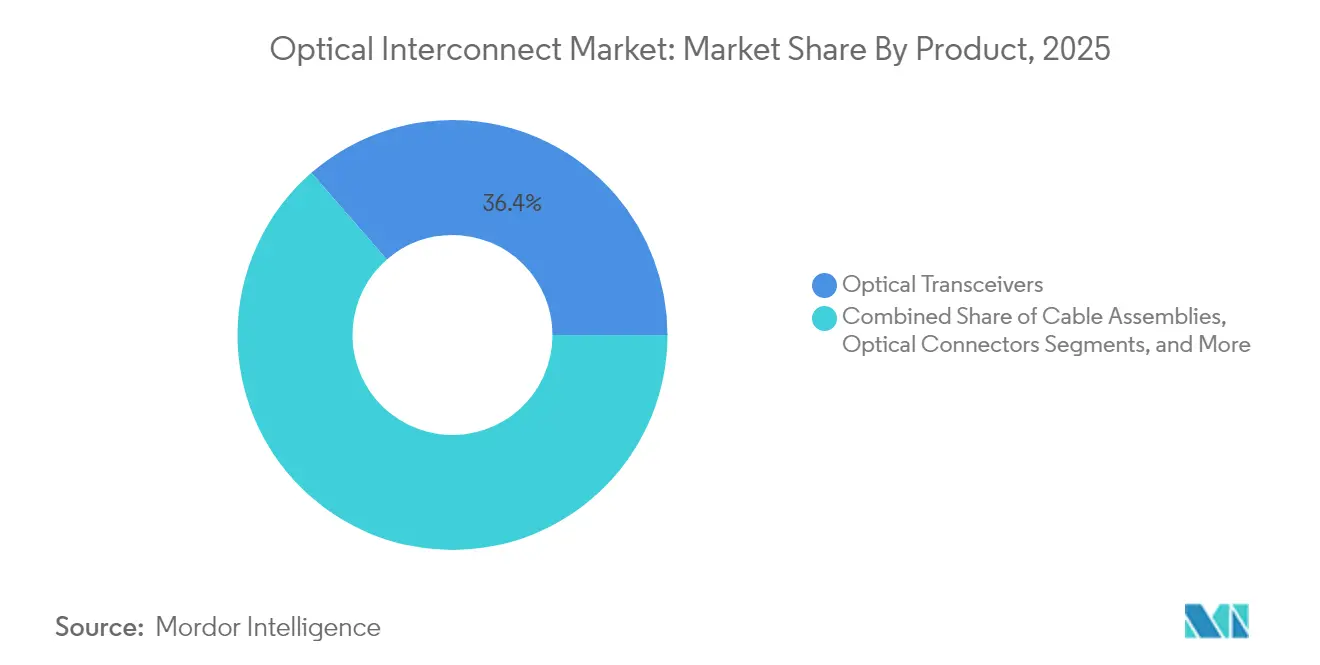
- By product type, optical transceivers led with 36.40% revenue share in 2025; embedded optical modules are projected to expand at a 22.1% CAGR through 2031.
- By interconnect level, board-to-board and rack-level links held 44.20% of the optical interconnect market share in 2025, while chip-to-chip connections will grow at 26.9% CAGR to 2031.
- By fiber mode, single-mode solutions accounted for 61.50% of the optical interconnect market size in 2025 and are advancing at a 13.4% CAGR through 2031.
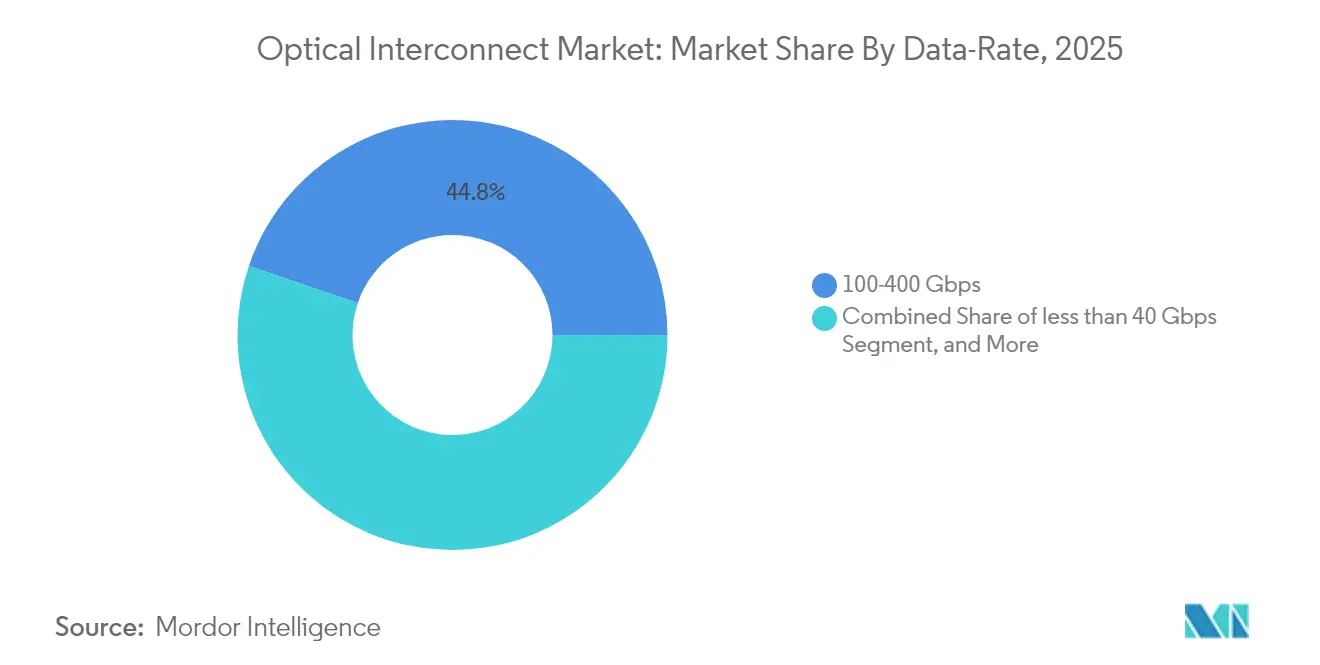
- By data rate, the 100–400 Gbps tier retained a 44.80% share in 2025, whereas >400 Gbps links will post a 33.7% CAGR over 2026–2031.
- By application, data communication captured a 60.20% share in 2025; the telecommunications segment is forecast to expand at a 14.6% CAGR to 2031.
- By geography, North America commanded 33.60% share in 2025, while Asia Pacific is the fastest-growing region at a 13.05% CAGR through 2031.
Note: Market size and forecast figures in this report are generated using Mordor Intelligence’s proprietary estimation framework, updated with the latest available data and insights as of 2026.
Global Optical Interconnect Market Trends and Insights
Drivers Impact Analysis*
| Driver | (~) % Impact on CAGR Forecast | Geographic Relevance | Impact Timeline |
|---|---|---|---|
| Demand for cloud, AI and HPC bandwidth | +4.2% | Global, concentrated in North America and Asia Pacific | Long term (≥ 4 years) |
| Rising data-center interconnect investments | +3.1% | North America and EU, expanding to Asia Pacific | Medium term (2-4 years) |
| 400 G/800 G migration in hyperscale DCs | +2.8% | Global, led by North America | Short term (≤ 2 years) |
| Silicon-photonics transceiver adoption | +1.9% | Global, manufacturing clusters in Taiwan and the United States | Medium term (2-4 years) |
| Co-packaged optics for switch ASICs | +1.5% | Early adopters in North America and Asia Pacific | Long term (≥ 4 years) |
| Thin-film lithium-niobate photonics links | +0.8% | Asia Pacific core with spill-over to North America | Long term (≥ 4 years) |
| Source: Mordor Intelligence | |||
Increasing Demand for Communication Bandwidth
Generative AI clusters require 10–100 times more fiber than traditional cloud services, pushing existing copper interconnects past their physical limits and forcing an accelerated transition to photonics. Meta’s internal architectures already show copper reach constraints at the rack boundary, guiding investment toward optical topologies that support hundreds of terabits per second in scale-out domains. High-speed Ethernet port shipments are projected to climb from 70 million in 2023 to more than 240 million in 2026, mirroring the ramp of 1.6 T interfaces. Modern GPU clusters now specify 200 Tbps of east-west bandwidth, translating into installations that exceed 3,000 fibers per fabric link, a scale that directly benefits vendors of dense photonic integration. This persistent traffic curve underpins multi-year orders for optical interconnect components across servers, switches, and long-haul DCI footprints.
Rising Data-Center Interconnect Investments
Microsoft alone has secured more than USD 8 billion in new dark-fiber contracts to reinforce its distributed cloud backbone. Dell’Oro projects AI back-end networks surpassing USD 20 billion by 2028, implying that optical interconnect market demand will outpace general server spending through the decade. Hyperscalers are now funding their own submarine cables, raising subsea investment to USD 9.8 billion by 2029, a move that further widens the addressable base for coherent transport systems. With traffic growth at regional exchange points expected to multiply sixfold within five years, the optical interconnect market benefits from a stable pipeline of DCI and backbone upgrades. Vendors equipped to deliver 800 G and 1.6 T optics stand to capture outsized share as operators seek to maximize cost-per-bit on each installed fiber.
Rapid 400 G/800 G Migration
Hyperscaler adoption of 400 G and 800 G pluggables is moving faster than earlier transitions, lifting quarterly revenue expectations for suppliers like Lumentum beyond USD 500 million by late 2025. IEEE ratification schedules for new 800 GbE and 1.6 TbE clauses by 2025 provide the standards baseline needed for volume deployment. Ciena’s WaveLogic 6 Extreme has already demonstrated 1.6 Tbps single-wavelength transport at 3 nm CMOS geometries, pointing to a technology runway that stays ahead of the traffic curve. Every new speed grade removes legacy SR, LR, and ER modules, forcing a replacement cycle that magnifies the optical interconnect market over the forecast window. In turn, cable congestion falls and operational complexity eases, enabling larger fabrics without proportionate fiber growth.
Commercial Silicon-Photonics Adoption
The silicon-photonics market is forecast to grow from USD 2.16 billion in 2024 to USD 7.52 billion by 2029 on the back of data-center optics. Intel’s optical I/O chiplet integrates 64 channels of 32 Gbps data in a single package, proving the viability of high-volume photonic integration alongside compute die.[3]Intel Corporation, “Integrated Optical I/O Chiplet Demonstration,” intel.com TSMC, through the Silicon Photonics Industry Alliance, is aligning more than 30 ecosystem partners to provide volume manufacturing, a move that reduces device cost and accelerates time-to-market. Compared with copper links, silicon-photonics solutions deliver higher bandwidth density and lower power per bit at speeds beyond 100 G, making them the preferred path for the optical interconnect market moving toward co-packaged optics adoption.
Restraints Impact Analysis*
| Restraint | (~) % Impact on CAGR Forecast | Geographic Relevance | Impact Timeline |
|---|---|---|---|
| Slow commercialization of next-gen tech | -1.8% | Global, with stronger effect in emerging markets | Medium term (2-4 years) |
| High capex for 800 G/1.6 T optics and packaging | -2.3% | Global, highest impact in cost-sensitive regions | Short term (≤ 2 years) |
| Thermal-management issues in CPO and photonics | -1.2% | Global, concentrated in high-performance segments | Medium term (2-4 years) |
| InP wafer and packaging supply bottlenecks | -0.9% | Global, concentrated in Asia Pacific manufacturing hubs | Long term (≥ 4 years) |
| Source: Mordor Intelligence | |||
Slow Commercialization of Next-Generation Technologies
Co-packaged optics remains several years away from mass adoption despite visible R&D momentum, as reliability testing and standardization through the Optical Internetworking Forum take longer than anticipated. Thermal constraints at terabit speeds require new packaging materials and heat spreaders that pass strict qualification regimes, extending design cycles for system OEMs. Thin-film lithium-niobate photonics, though promising, still faces brittleness and yield challenges, delaying the high-volume availability of the material outside a few pilot fabs in China. These commercialization lags introduce planning risk for operators that must balance future-proofing with proven reliability, tempering near-term adoption rates for bleeding-edge solutions in the optical interconnect market.
High Capital Expenditure Requirements
Pluggable 800 G and 1.6 T transceivers currently command price premiums that restrict adoption by cost-sensitive carriers, leading to a slower ramp in Tier-2 and Tier-3 clouds. Co-packaged optics lines require specialized pick-and-place assembly, wafer-level optics, and integrated liquid cooling, adding millions of dollars in facility retrofits before production can start. Hyperscaler spending is cyclical, and analysts expect a 20–30% capex pullback in 2026 once the current AI build-out subsides, a swing that injects volume volatility into suppliers’ forecasts. Because optical component R&D relies on multi-year amortization windows, smaller vendors face funding gaps unless anchor customers commit to large forward volumes, potentially slowing innovation diffusion across the broader optical interconnect market.
*Our forecasts treat driver/restraint impacts as directional, not additive. The impact forecasts reflect baseline growth, mix effects, and variable interactions.
Segment Analysis
By Product: Transceivers Lead, Embedded Modules Accelerate
The optical interconnect market size for product-level sales centers on transceivers, which held a 36.40% revenue position in 2025, according to Broadcom. Embedded optical modules, however, are growing fastest at a 22.1% CAGR as ASIC designers validate co-packaged optics inside switch chassis. Traditional active optical cables remain popular for plug-and-play deployments, but their growth moderates as operators favor separate optics that scale to longer reaches. Cable assemblies and connectors track overall fiber growth, providing steady volume without the steep cost curves of integrated photonics. Broadcom’s 51.2 Tbps CPO platform shows 70% lower energy dissipation than pluggables, illustrating why embedded modules will keep gaining share. Intel’s optical I/O chiplet delivers 4 Tbps bidirectional throughput at 5 pJ/bit, a power milestone that positions embedded designs as the logical successor once packaging yields mature intel.com. Manufacturing alliances such as OpenLight and Jabil shorten time-to-market for integrated parts, signaling a broader pivot toward embedded optics inside the optical interconnect market.
The medium-term outlook suggests that embedded modules will cannibalize a portion of pluggables but also open new sockets where thermal budgets forbid traditional form factors. Many hyperscalers will dual-source embedded and pluggable parts until industry-wide interoperability matures, preserving transceiver revenue even as growth shifts. Meanwhile, CPO variants sit at the center of switch roadmaps for 1.6 T and 3.2 T fabrics, guaranteeing a sizable pipeline for backplane optics. Because embedded modules reduce front-panel density pressures, rack architects can shrink chassis depth or add accelerators, improving overall compute density. The interplay among these product categories keeps the optical interconnect market dynamic and underscores why broad portfolios are critical for vendors courting hyperscaler design wins.


By Interconnect Level: Board-Level Dominance Faces Chip-Level Disruption
Board-to-board and rack-level links accounted for 44.20% of optical interconnect market share in 2025, reflecting today’s modular server designs. Silicon photonics now enables on-package optical lanes that bypass PCB traces, driving chip-to-chip links to a 26.9% CAGR outlook. Metro and long-haul DCI solutions remain essential yet grow at a steadier clip because of longer deployment cycles and regulatory hurdles. The technology needs differ: chip-to-chip optics target sub-nanosecond latency and watt-per-terabit efficiencies, whereas DCI equipment optimizes spectral efficiency and amplifier cascades.
PCIe Gen 6 over optics, demonstrated by Marvell at OFC 2025, sends 64 GT/s traffic across 10 m fibers, enabling disaggregated compute racks that decouple CPUs and GPUs. Ayar Labs’ funding round underscores confidence in monolithic optical I/O that can break traditional memory and cache hierarchies. As co-packaged optics migrates from prototypes to volume switches, board designers will place laser sources near ASICs, lowering insertion loss and reducing pluggable face-plate thermal density. However, service providers still require rack-level links for backwards compatibility, bridging the transition from legacy spine-leaf topologies to next-generation fabrics. This hybrid demand profile supports incremental revenue across all interconnect levels in the optical interconnect market.
By Fiber Mode: Single-Mode Supremacy
Single-mode fiber maintains a 61.50% share and posts a 13.4% CAGR through 2031, favored for its superior bandwidth-distance product. Multi-mode fiber continues to serve cost-sensitive intra-rack runs yet faces scale limitations beyond 100 m. AI cluster deployments now push inter-machine learning fabrics across multikilometer campuses, where attenuation penalties mandate low-loss single-mode links. Corning’s Vascade EX2500 illustrates innovation on dispersion parameters tailored for 800 G and future 1.6 T channels, extending the economic life of existing conduits.
Ribbonized single-mode cables optimize installation labor, letting operators pull hundreds of fibers at once to reach the 3,000-fiber threshold typical in 200 Tbps fabrics. In parallel, bend-insensitive variants reduce micro-bend loss in crowded trays, further strengthening the single-mode value proposition. The optical interconnect market expects single-mode designs to capture incremental share every upgrade cycle, as data rates move higher and multi-mode modulation ceilings plateau.
By Data-Rate: above 400 Gbps Momentum
Shipments in the 100–400 Gbps band held 44.80% share in 2025, but links above 400 Gbps will post a 33.7% CAGR through 2031, making them the headline growth engine. Industry progress on 8×100 G, 16×100 G, and 8×200 G optical engines lifts face-plate bandwidth above 1.6 Tbps per module, enabling denser top-of-rack fabrics. Lumentum, Coherent, and Marvell already offer 800 G ZR/ZR+ coherent pluggables that reach 500 km, collapsing metro optical shelves into a single-slot form factor.
The standards roadmap, led by IEEE P802.3dj, finalizes 1.6 Tbps Ethernet by 2025, offering operators clear interoperability targets. Ciena’s coherent-lite engine demonstrates the feasibility of 1.6 T transport on existing fiber, de-risking adoption for carriers reluctant to cut in new cable. Each speed step pushes equipment vendors to re-architect cooling, signal integrity, and power delivery, driving adjacent sales in thermal-pad materials, linear drive VCSELs, and DSPs. This cascade keeps the optical interconnect market on an aggressive innovation cadence even as aggregate port counts plateau.
By Application: Data Communication Dominates, Telecom Accelerates
Data-communication workloads held 60.20% of 2025 revenue, reflecting cloud operators’ push to scale AI clusters across global regions. Telecommunications customers adopt similar optics at a 14.6% CAGR as 5G backhaul upgrades and early 6G prototypes demand coherent capacity deep into the access network. Data-center operators prioritize bandwidth density and wattage per bit, while telcos value environmental resilience and operational lifespan.
Hyperscalers already own nearly 60% of global data-center capacity, concentrating spending with a handful of component suppliers that can ship in million-unit volumes. On the telco side, Open ROADM and TIP plug-fests accelerate vendor interoperability, lowering cost barriers and expanding market reach. Over time, carrier networks will mimic cloud operational models, adopting disaggregated optical line systems and software-defined control planes. This convergence blends the requirements of once discrete segments, pushing the optical interconnect market toward unified portfolios that serve both private data centers and public network operators.
Geography Analysis
North America led the optical interconnect market with a 33.60% share in 2025 thanks to hyperscaler concentration and decades-long silicon-photonics research programs by firms such as Intel. Capital spending on proprietary fiber assets remains robust, seen in Microsoft’s multibillion-dollar dark-fiber contracts with Lumen, underlining a strong near-term demand floor for high-speed optics. Regional merger activity, including AMD’s acquisition of Enosemi and Nokia’s USD 2.3 billion purchase of Infinera, adds both design talent and intellectual property to domestically headquartered firms. Continued Federal investment in advanced packaging and CHIPS Act photonics grants further strengthens North American manufacturing resilience, particularly for indium-phosphide wafers and heterogeneous integration.
Asia Pacific is the fastest-growing region at a 13.05% CAGR, driven by China’s national photonics strategy, Taiwan’s foundry leverage, and regional investments in end-to-end supply chains. The Silicon Photonics Industry Alliance organized by TSMC includes over 30 companies and offers unified process design kits, lowering fabrication barriers and shortening learning curves for new entrants. China’s CHIPX pilot lines manufacture thin-film lithium-niobate on 6-inch wafers, giving domestic players a head start in next-generation modulators. Regional governments subsidize AI computing clusters that serve both commercial workloads and national research, ensuring sustained demand for terabit-scale optics over the forecast window. Collaboration between Taiwanese fabs and US cloud providers further blurs regional boundaries but ultimately inflates aggregate Asia-Pacific volumes in the optical interconnect market.
Europe’s optical production slipped below 8% of global share by 2024, prompting the European Commission to propose a Photonics Chips Act aimed at revitalizing domestic capacity. European photonics firms collectively spent more than EUR 12 billion on R&D in 2024, yet commercialization gaps persist relative to North America and Asia Pacific. Initiatives from Photonics21 and national programs in Germany and France pledge to double the number of pilot lines by 2027. On the corporate front, Prysmian’s USD 950 million acquisition of Channell Commercial Corporation expands the group’s fiber-connectivity footprint in North American and Middle-East data-center projects, reflecting a pragmatic globalization strategy. While the region remains technologically capable, its optical interconnect market growth depends on coordinated funding and faster technology-transfer pipelines to scale innovations into volume products.

Competitive Landscape
The optical interconnect market is moderately fragmented. Broadcom shipped over 20 million 100 G optical channels to date and targets more than 5 million 800 G units in 2025, leveraging vertical integration from silicon photonics to packaging. Coherent’s shift to 6-inch indium-phosphide wafers reduces die cost by 60% and quadruples device density, a step that tightens cost structures against second-tier suppliers.[4]Coherent Corp., “Transition to 6-Inch InP Wafer Platform,” coherent.com Nokia’s acquisition of Infinera combines line-system, coherent DSP, and pluggable expertise into a business expected to command 20% of global optical systems revenue after integration.
Startup funding remains active. Ayar Labs secured USD 155 million from AMD, Intel, and NVIDIA to accelerate chip-to-chip optical I/O, providing incumbents with early access to disruptive IP. IonQ’s purchase of Lightsynq brings quantum-grade photonics into the broader ecosystem, hinting at convergence between AI and quantum hardware interconnects. Mature component vendors such as Lumentum and Sumitomo expand into optical circuit switches and HVDC cables respectively, reinforcing adjacency plays that complement transceiver portfolios. Overall, suppliers able to align advanced integration, supply-chain control, and power-efficient architectures capture disproportionate share as traffic moves to 800 G and beyond.
Continued supply-chain consolidation is likely. Indium-phosphide epi houses, silicon-photonics fabs, and advanced packaging subcontractors remain acquisition targets for tier-one OEMs looking to derisk key material flows. At the same time, regional policy incentives encourage on-shore capacity, leading to a two-speed environment in which global leaders add local factories while smaller specialists partner through joint ventures. Such dynamics sustain competition yet restrain price erosion, keeping average selling prices stable enough to fund next-generation R&D across the optical interconnect market.
Optical Interconnect Industry Leaders
3M Company
Sumitomo Electric Industries, Ltd.
TE Connectivity
Broadcom Inc.
ZTE Corporation
- *Disclaimer: Major Players sorted in no particular order


Recent Industry Developments
- June 2025: IonQ completed its acquisition of Lightsynq Technologies, adding more than 20 patents for photonic quantum networking
- May 2025: AMD acquired Enosemi to accelerate co-packaged optics innovation for AI systems
- March 2025: Prysmian Group announced a USD 950 million acquisition of Channell Commercial Corporation to expand fiber-connectivity offerings
- March 2025: Marvell demonstrated the first end-to-end PCIe Gen 6 over optics at OFC 2025


Research Methodology Framework and Report Scope
Market Definitions and Key Coverage
According to Mordor Intelligence, our study defines the optical interconnect market as every active or embedded photonic device, transceivers, active cables, co-packaged optics, connectors, and related engines that convert or guide light to move data between chips, boards, racks, or metro links for telecommunications and data communication uses.
Scope Exclusion: our model omits copper backplanes, sub-millimeter on-chip waveguides, and commoditized passive patch cords.
Segmentation Overview
- By Product
- Optical Transceivers
- Active Optical Cables (AOC)
- Embedded Optical Modules (EOM)
- Cable Assemblies
- Optical Connectors
- By Interconnect Level
- Chip-to-Chip
- Board-to-Board / Rack-Level
- Metro and Long-Haul DCI
- By Fiber Mode
- Single-Mode Fiber
- Multi-Mode Fiber
- By Data-Rate
- less than 40 Gbps
- 40-100 Gbps
- 100-400 Gbps
- above 400 Gbps
- By Application
- Telecommunication
- Data Communication
- By Geography
- North America
- United States
- Canada
- Mexico
- South America
- Brazil
- Argentina
- Rest of South America
- Europe
- Germany
- United Kingdom
- France
- Rest of Europe
- Asia Pacific
- China
- India
- Japan
- South Korea
- ASEAN
- Rest of Asia Pacific
- Middle East
- Saudi Arabia
- UAE
- Turkey
- Rest of Middle East
- Africa
- South Africa
- Rest of Africa
- North America
Detailed Research Methodology and Data Validation
Primary Research
Our analysts interviewed optical component engineers, hyperscale network architects, and telecom procurement heads across North America, Europe, and Asia. These dialogues yielded yield curves, bill of materials ratios, and forward capex intentions that anchored price erosion and penetration assumptions.
Desk Research
We gathered baseline volumes and average selling prices from public datasets such as UN Comtrade fiber exports, US Census ICT shipments, Eurostat PRODCOM, and ITU fiber route statistics. We then matched them with 10-Ks, investor decks, and OCP Foundation whitepapers to map platform shifts. Paid resources, D&B Hoovers for revenue splits, Dow Jones Factiva for deal flow, and Questel for silicon photonics patents helped us verify competitive signals, while open IEEE Photonics, FTTH Council, and regional regulator releases refined adoption curves. The sources named are illustrative, not exhaustive.
Market-Sizing & Forecasting
A top-down build started with 2024 data center port shipments and telecom fiber route adds, converted to link counts and multiplied by blended ASPs. Supplier roll-ups for transceivers, AOCs, and CPO modules provided a bottom-up cross-check before the totals were aligned. Key variables modeled include 400 G/800 G shipment mix, co-packaged optics penetration, hyperscale capex, silicon photonics yield, and 5Gbackhaul fiber rollout. We forecast 2025 to 2030 using multivariate regression and scenario analysis vetted by primary experts; this is where Mordor Intelligence differentiates through annual FX refresh and port mix recalibration.
Data Validation & Update Cycle
Outputs face variance scans against independent shipment trackers, then a senior analyst reviews anomalies before sign-off. Reports refresh each year, with interim updates if supply or demand shocks exceed preset thresholds.
Why Mordor's Optical Interconnect Baseline Inspires Confidence
Published values often diverge because firms pick different component baskets, freeze exchange rates at varied dates, or limit coverage to single mode fiber.
Key gap drivers we observe are narrow chip level focus, optimistic ASP decay, or outdated 2023 currency conversions, whereas Mordor applies full value chain scope, live ASP tracking, and yearly FX updates.
Benchmark comparison
| Market Size | Anonymized source | Primary gap driver |
|---|---|---|
| USD 19.39 B (2025) | Mordor Intelligence | |
| USD 16.06 B (2024) | Global Consultancy A | excludes AOCs and board level links |
| USD 13.87 B (2024) | Industry Research B | uses single mode fiber only and static ASPs |
| USD 20.92 B (2025) | Regional Consultancy C | assumes 14 % port surge without supply checks |
These comparisons show our balanced scope, live currency updates, and dual side validation give decision makers the most dependable, transparent baseline available.


Key Questions Answered in the Report
What is the current size of the optical interconnect market?
The optical interconnect market is valued at USD 18.83 billion in 2026 and is projected to reach USD 33.28 billion by 2031.
Which product category holds the largest revenue share?
Optical transceivers lead with a 36.40% share in 2025, reflecting their versatility across data-center and telecom deployments.
Why is single-mode fiber gaining more traction than multi-mode?
Single-mode fiber delivers superior bandwidth-distance performance, critical for AI clusters that now span campus-scale facilities requiring 61.50% of overall fiber demand.
What regions are growing fastest?
Asia Pacific is forecast to expand at a 13.05% CAGR, fueled by China’s photonics strategy and Taiwan’s foundry ecosystem.
How quickly are >400 Gbps optics being adopted?
Links above 400 Gbps will register a 33.7% CAGR through 2031 as hyperscalers migrate to 800 G and 1.6 T implementations to meet AI workload growth.
What technological hurdle could slow market momentum?
High capital requirements for advanced optics and packaging infrastructure remain a key restraint, particularly for cost-sensitive operators.
Page last updated on:


