Optical Encryption Market Size and Share
Market Overview
| Study Period | 2020 - 2031 |
|---|---|
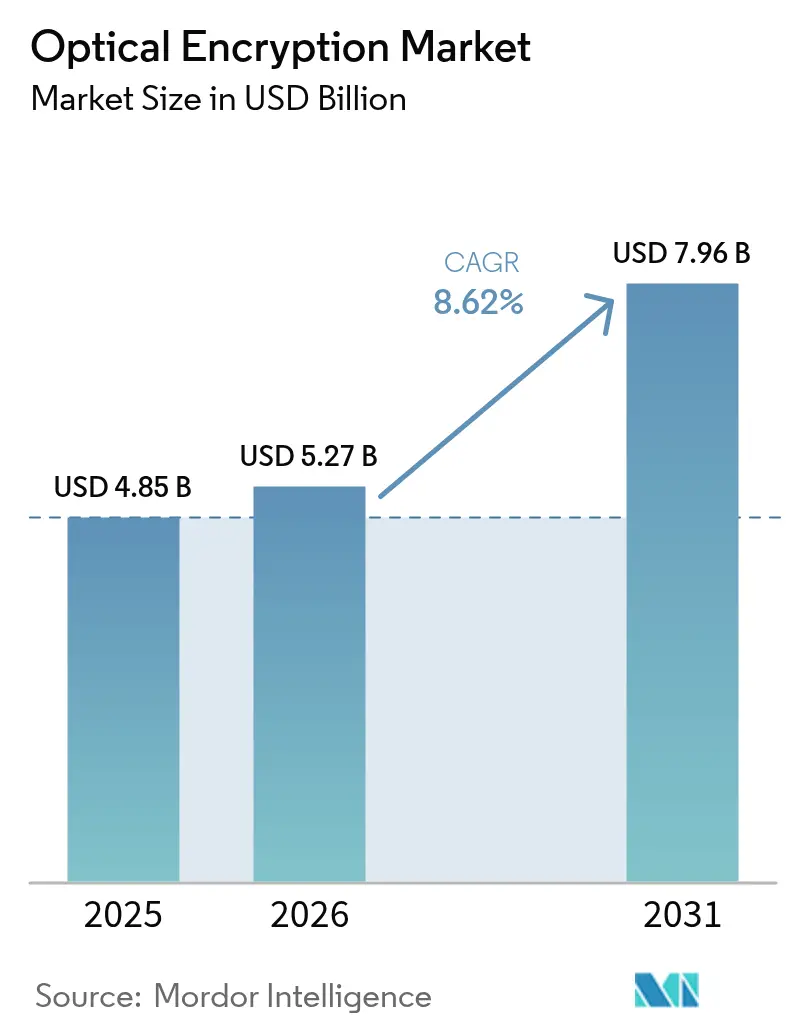
| Market Size (2026) | USD 5.27 Billion |
| Market Size (2031) | USD 7.96 Billion |
| Growth Rate (2026 - 2031) | 8.62% CAGR |
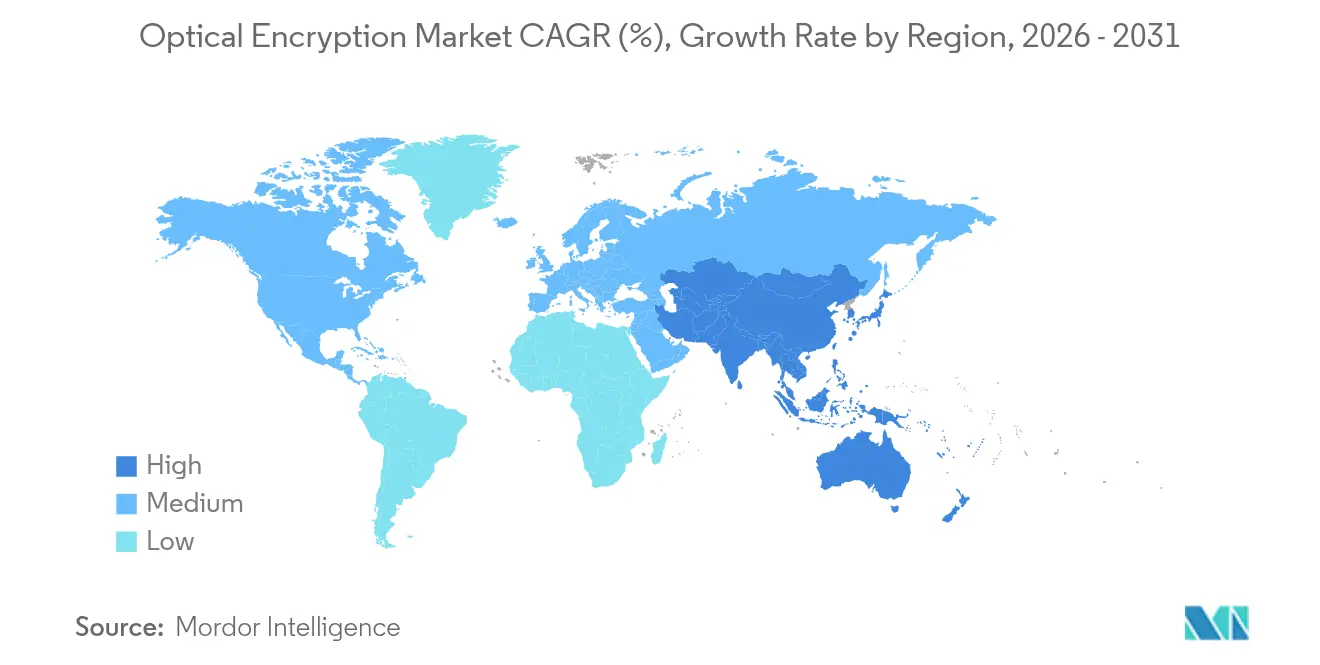
| Fastest Growing Market | Asia Pacific |
| Largest Market | North America |
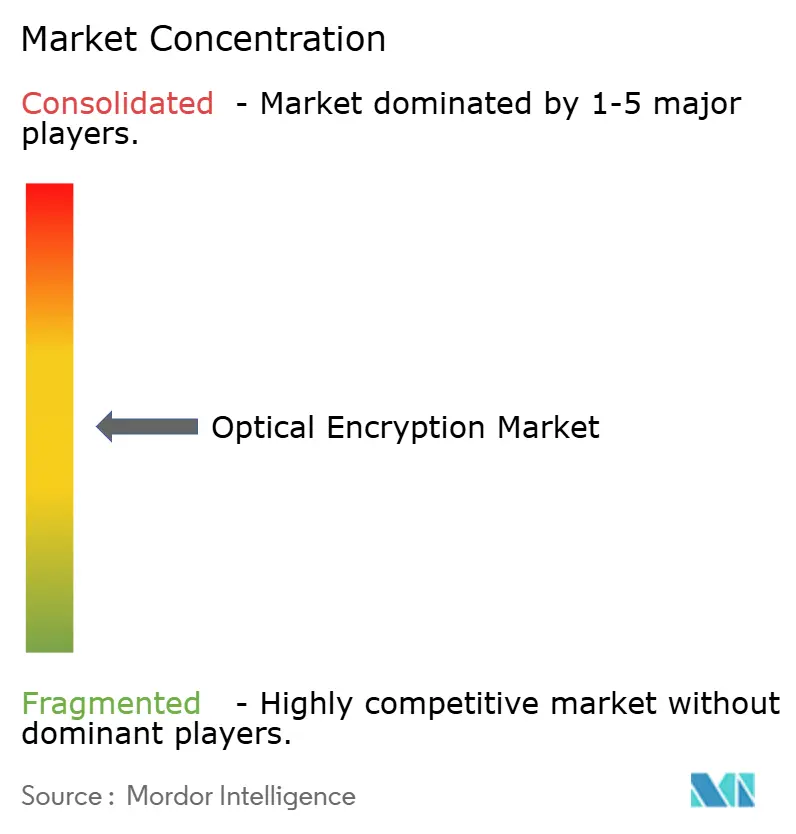
| Market Concentration | Medium |
Major Players *Disclaimer: Major Players sorted in no particular order Image © Mordor Intelligence. Reuse requires attribution under CC BY 4.0. | |
Optical Encryption Market Analysis by Mordor Intelligence
The Optical Encryption Market size was valued at USD 4.85 billion in 2025 and estimated to grow from USD 5.27 billion in 2026 to reach USD 7.96 billion by 2031, at a CAGR of 8.62% during the forecast period (2026-2031).
The optical encryption market is valued at USD 4.85 billion in 2025 and is projected to reach USD 7.43 billion by 2030, registering an 8.91% CAGR. Rapid adoption of quantum-safe architectures, soaring AI bandwidth requirements, and line-rate performance above 800 Gbps propel investment in Layer 1 encryption platforms. Hardware-based designs remove software vulnerabilities, satisfy zero-trust mandates, and align with sovereign-cloud rules that compel in-flight key control. Hyperscale data-center operators accelerate 400 G and 800 G coherent upgrades, while telecom carriers refresh metro rings to enable multi-terabit data-center interconnects using integrated AES-256-GCM encryption.[1]Ciena Corporation, “WaveLogic 6 Extreme Product Brief,” ciena.comSilicon-photonics integration cuts power budgets and lifts port densities, supporting loss-less AI/LLM workflows that cannot tolerate packet-level retransmissions. Finalization of NIST’s post-quantum standards FIPS 203–205 creates a clear compliance target, reinforcing demand for crypto-agile optical hardware.
Key Report Takeaways
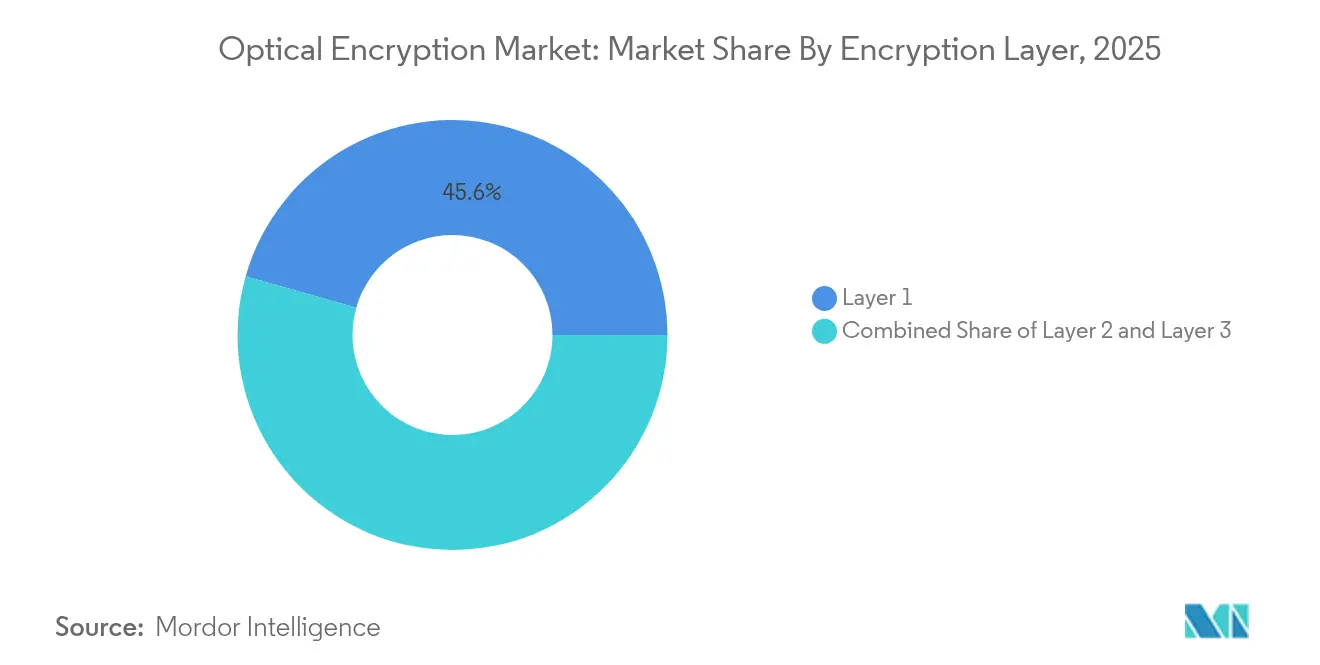
- By encryption layer, Layer 1 solutions held 45.60% of the optical encryption market share in 2025 and are expanding at a 11.55% CAGR through 2031.
- By data rate, the 40–100 Gbps category accounted for 37.35% of the optical encryption market size in 2025, while the >100 Gbps segment is advancing at an 17.4% CAGR to 2031.
- By component, hardware appliances captured 41.10% revenue share in 2025; coherent and pluggable modules record the fastest 15.85% CAGR.
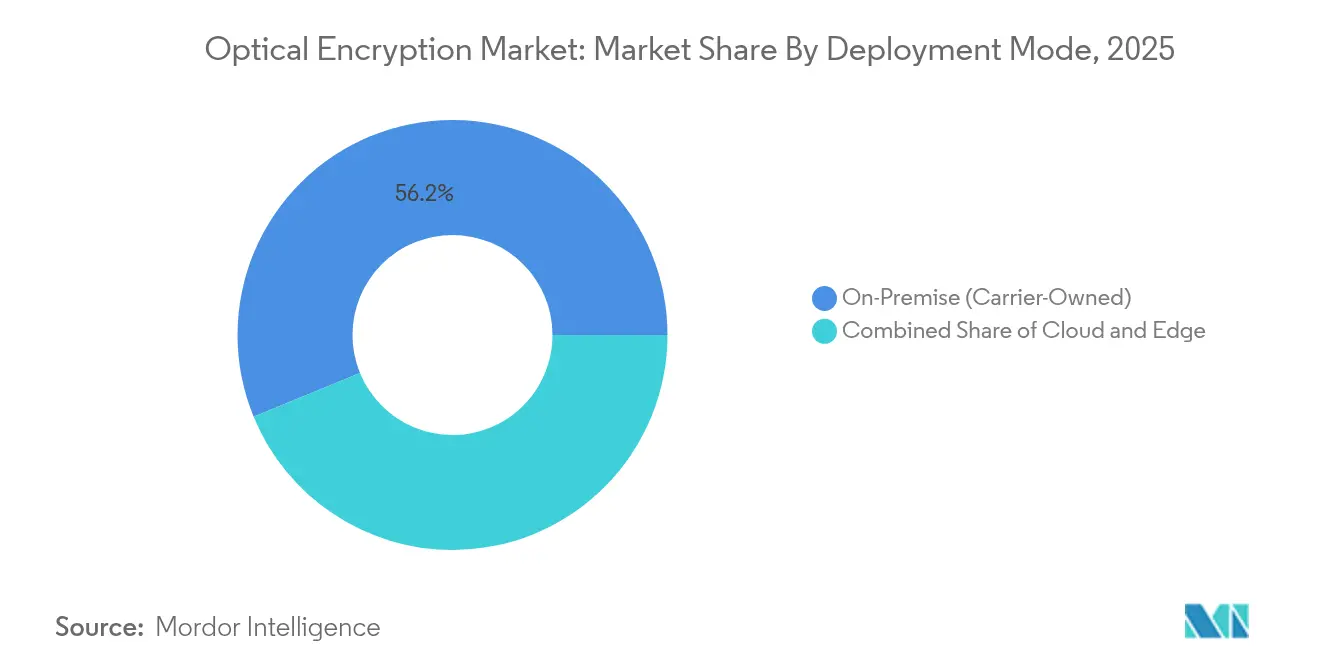
- By deployment mode, on-premise carrier-owned systems controlled 56.20% of the optical encryption market size in 2025, whereas cloud and network-as-a-service models are growing at a 16.5% CAGR.
- By end-user vertical, datacenter and cloud led with 51.20% revenue share in 2025 and is forecast to rise at a 14.9% CAGR through 2031.
- By geography, North America commanded 40.60% share in 2025; Asia Pacific is the fastest-growing region at 9.62% CAGR.
Note: Market size and forecast figures in this report are generated using Mordor Intelligence’s proprietary estimation framework, updated with the latest available data and insights as of 2026.
Global Optical Encryption Market Trends and Insights
Drivers Impact Analysis*
| Driver | (~) % Impact on CAGR Forecast | Geographic Relevance | Impact Timeline |
|---|---|---|---|
| Multi-terabit metro DCI build-outs | +2.1% | Global, with concentration in North America and Asia Pacific | Medium term (2-4 years) |
| Zero-trust mandates across critical infrastructure | +1.8% | North America and EU, expanding to Asia Pacific | Short term (≤ 2 years) |
| MACsec bottlenecks pushing Layer 1 upgrades | +1.4% | Global data-center markets | Short term (≤ 2 years) |
| Post-quantum crypto-agile transport pilots | +1.2% | Government and BFSI sectors worldwide | Long term (≥ 4 years) |
| Source: Mordor Intelligence | |||
Multi-terabit Metro DCI Build-outs Drive Coherent Adoption
Hyperscale operators interconnect distributed AI campuses with multi-terabit metro rings, shifting to coherent optics that embed AES-256-GCM at 400 G and 800 G. Ciena’s WaveLogic 6 Extreme enables 1.6 Tbps per wavelength while trimming per-bit power use by 50%. Optical circuit switching inside data centers removes copper bottlenecks and hands encryption to the physical layer, ensuring loss-less gradient exchange during model training. Regional carriers replicate this model to monetize existing dark fiber by offering encrypted bandwidth slices. Resulting scale economics lower cost per secured bit and accelerate Layer 1 penetration across colocation and enterprise campuses.
Zero-trust Mandates Accelerate Layer-1 Integration
Government frameworks now presume breach and require continuous verification, making hardware encryption a default rather than an add-on. The U.S. CNSA 2.0 and the EU’s NIS2 point directly at quantum-resistant keys, steering budgets toward devices that encrypt transparently at line rate. Broadcom’s Emulex Secure Fibre Channel adapters illustrate how hardware telemetry blocks ransomware while maintaining full throughput.[2]Broadcom Inc., “Emulex Secure Fibre Channel HBAs,” broadcom.com Financial institutions adopt similar designs to serve high-frequency trading where microsecond delays erase profits. This compliance-driven spending decouples demand from ordinary technology refresh cycles and sustains premium pricing for certified optical gear.
MACsec Bottlenecks Push Layer-1 Upgrades
At speeds beyond 100 Gbps, MACsec introduces latency and frame expansion that strain switch buffers. Operators facing congestion now off-load encryption to coherent optics that operate outside the Ethernet pipeline. The design frees up forwarding ASIC capacity, supports 800 G trunk links, and simplifies instrumentation because encryption is no longer intertwined with L2 management. Vendors that bundle encryption with DSP silicon gain bill-of-materials leverage and defend margins against commoditized grey optics. The shift compresses multi-layer security into a single photonic stage, enhancing observability without packet reassembly.
Post-quantum Crypto-agile Transport Pilots
NIST’s endorsement of ML-KEM and ML-DSA standards clears uncertainty around algorithm choice, letting transport vendors bake them into firmware.[3]National Institute of Standards and Technology, “FIPS 203, 204, 205 Final Standards,” nist.gov ETSI’s TS 104 015 hybrid-key protocol enables seamless fall-back to classical curves during migration.[4]European Telecommunications Standards Institute, “TS 104 015 Hybrid Key Exchange,” etsi.org Government networks in the Middle East and Asia Pacific demonstrate dual-stack operation that rotates keys without halting traffic, proving business-case viability for crypto-agile optics. Early adopters report smoother audits and longer asset lifecycles because hardware need not be swapped when algorithms evolve. These pilots create reference architectures that lower perceived risk for mainstream enterprises
Restraints Impact Analysis*
| Restraint | (~) % Impact on CAGR Forecast | Geographic Relevance | Impact Timeline |
|---|---|---|---|
| High capex of coherent 400 G+ optics | -1.9% | Global, pronounced in cost-sensitive markets | Medium term (2-4 years) |
| Fragmented regulatory certification | -1.3% | Worldwide, jurisdiction dependent | Short term (≤ 2 years) |
| Scarcity of entropy sources at line rate | -0.8% | High-security segments globally | Long term (≥ 4 years) |
| Supply-chain choke-points in DSPs | -1.1% | Global, centered in Asia manufacturing hubs | Medium term (2-4 years) |
| Source: Mordor Intelligence | |||
High Capex of Coherent 400 G+ Optics
Coherent transceivers still command premiums over direct-detect modules because they require indium phosphide PICs and advanced DSPs. Coherent Corp.’s move to 6-inch InP wafers aims for a 60% die-cost reduction, but commercial volumes remain 18 months away. Material export restrictions on gallium and germanium further elevate input costs, squeezing margins for suppliers that lack vertical integration. Smaller carriers may defer upgrades or adopt bandwidth-on-demand services instead of outright purchases, tempering near-term unit shipments even as long-term economics improve.
Fragmented Regulatory Certification Requirements
Optical encryption vendors juggle FIPS 140-3 Level 3 in the United States, Common Criteria NDcPP in Europe, and divergent national schemes in Asia Pacific. Hardware redesigns to satisfy mandatory multi-factor authentication and zeroization features extend certification by up to 18 months. Firms with global customer bases must maintain parallel SKUs, inflating R&D overhead and complicating supply-chain forecasting. Harmonization efforts lag, keeping barriers high for smaller entrants and slowing multi-region rollouts.
*Our forecasts treat driver/restraint impacts as directional, not additive. The impact forecasts reflect baseline growth, mix effects, and variable interactions.
Segment Analysis
By Encryption Layer: Hardware Dominance Drives Layer 1 Leadership
Layer 1 commanded 45.60% market share in 2025 and is growing at 11.55% CAGR, the strongest rate among all layers. PacketLight’s DWDM portfolio shows how quantum key distribution integrates directly into coherent channels while staying within FIPS 140-3 boundaries. The optical encryption market size for Layer 1 platforms is projected to expand steadily as hyperscalers adopt 800 G line cards. Hardware-rooted key stores, tamper evidence, and deterministic latency remain decisive advantages. Enterprises retain Layer 2 MACsec appliances for legacy 10–25 G links, but those deployments plateau amid performance ceilings. Layer 3 IPsec persists in niche WAN scenarios where application awareness outweighs raw speed; nevertheless, its incremental latency discourages adoption in AI training clusters that demand microsecond determinism.
In metro and long-haul builds, Ciena’s WaveLogic Encryption enables per-wavelength protection without external shelves, cutting rack space by 30%. Operators report simplified provisioning because DSP firmware automatically negotiates encryption parameters, boosting operational agility. The optical encryption market continues to shift budget from higher OSI layers to the photonic plane, reinforcing hardware vendors’ pricing power while compressing value for software-only suppliers.


By Data Rate: 40–100 Gbps Leads While above 100 Gbps Accelerates
The 40–100 Gbps segment accounted for 37.35% of the optical encryption market size in 2025 as 100 G coherent pluggables reached volume production. Established telco networks use these rates for metro aggregation and edge cloud on-ramps. Coherent Corp.’s industrial-temperature 100 G ZR QSFP28-DCO extends reach into harsh environments, allowing encryption at cell-tower hubs without HVAC expense. Nonetheless, >100 Gbps lanes post an 17.4% CAGR as hyperscalers transition to 400 G and 800 G for GPU cluster interconnects. Marvell’s COLORZ 800 reduces capital cost of 800 G DCI links by up to 75%, collapsing the price gap that once hampered uptake.
Under 10 Gbps links survive in brownfield control networks and industrial IoT where traffic bursts remain modest. The 10–40 Gbps tier addresses campus backbones and 25 G PON, but incremental revenue migrates upward as AI workloads reshape traffic profiles. Accordingly, suppliers reallocate R&D toward 1.6 T road-maps backed by DSP nodes at 3 nm, further tipping momentum toward higher speeds.
By Component: Hardware Appliances Lead While Coherent Modules Accelerate
Dedicated appliances captured 41.10% market share in 2025 as public-sector buyers favor tamper-proof chassis with integrated HSMs. The optical encryption market share may erode gradually, however, as coherent pluggables accelerate 15.85% CAGR on the back of silicon-photonics economies. Ciena’s WaveLogic Nano and Marvell’s 3 nm PAM4 chips demonstrate embedded security directly inside optical modules, delivering line-rate encryption without external blades. Software orchestration gains importance as fleet sizes rise; vendors now ship quantum-ready key servers that spin new post-quantum credentials in minutes.
Component miniaturization reduces power by up to 20%, an important metric as the Department of Energy anticipates tripling U.S. data-center electricity demand by 2028. Vendors that own DSP intellectual property can pivot faster to new algorithms, reinforcing entry barriers while trimming supply-chain exposure.
By Deployment Mode: On-premise Dominance Meets Cloud Acceleration
Carrier-owned, on-premise systems held 56.20% share in 2025, reflecting telco need for physical control and regulatory accountability. Yet cloud and network-as-a-service models are growing at 16.5% CAGR as hyperscalers lease managed dark fiber and retain customer-managed keys. Ciena’s Managed Optical Fiber Networks platform lets providers expose photonic APIs while customers manage encryption and telemetry. Hybrid deployment gains traction among utilities and logistics firms that combine on-site gateways with cloud-hosted key managers to balance latency and compliance.
Edge appliances remain relevant where indigenous data laws restrict foreign cloud use. Sovereign clouds in Europe and Asia South rely on regional key escrow, ensuring traffic never leaves jurisdiction unencrypted. This architectural diversity sustains revenue across OEMs, integrators, and emerging as-a-service brokers.
By End-user Vertical: Datacenter Dominance Drives AI Demand
Datacenter and cloud stakeholders generated 51.20% of 2025 revenue and will climb at 14.9% CAGR, reflecting AI training clusters that move petabytes between GPUs every second. Marvell’s PCIe Gen 6 over optics demo shows host-to-GPU encryption at 64 GT/s with no retrain penalties, a prerequisite for exascale model convergence. BFSI institutions pilot quantum-safe optics to shield high-value FX trades, while government agencies mandate FIPS 140-3 Level 3 for classified transport. In energy, Hitachi Energy’s quantum-secured grid in Oman illustrates how utilities protect SCADA flows at line rate.
Healthcare adoption grows as tele-diagnostics leverage homomorphic encryption to process MRI images in the cloud without exposing raw data. Retail and e-commerce focus on payment latency, integrating photonic encryption into edge POPs to keep tap-to-approval below 150 ms. Each vertical’s distinct latency, compliance, and key-management needs diversify supplier road-maps and dilute reliance on any single customer cohort.
Geography Analysis
North America retained 40.60% revenue share in 2025, underpinned by federal zero-trust directives and hyperscale AI cluster builds that demand secure 800 G waves. Domestic chip supply-chain incentives hasten adoption of co-packaged optics, anchoring much of the DSP value chain onshore. Canada’s quantum-communication field tests and Mexico’s expanding colocation market add incremental demand, but the United States remains the dominant buyer and R&D hub.
Asia Pacific is the fastest-growing region at 9.62% CAGR through 2031. China channels multibillion-dollar state funding into quantum-secure backbone builds, while Japan’s 402 Tbps fiber milestone proves regional depth in photonics research. India’s data-center capacity more than doubles between 2025 and 2028, spurring procurement of 100 G-ZR pluggables with built-in AES-256. South Korea extends 5 G transport to rural areas using encrypted 25 G PON, and ASEAN nations leverage regional manufacturing capacity to localize photonic assembly.
Europe’s share contracts despite world-class labs, penalized by fragmented certification regimes. National pilots such as Finland’s Telia-VTT quantum-secure network validate technology but stop short of continent-wide consensus. The EuroQCI program aims to harmonize procurement, yet roll-out lags Asian and North American peers. Middle East growth outpaces Europe on a smaller base, buoyed by UAE’s fiber-to-satellite quantum key distribution demo at GITEX 2024. Saudi Arabia’s Vision 2030 earmarks sovereign-cloud encryption as critical infrastructure, creating fresh runway for vendors with Arabic localization and local-key-custody options.

Competitive Landscape
The optical encryption market exhibits moderate concentration. Industry incumbents Nokia, Cisco, and Ciena bundle coherent transport, DSP, and security into integrated stacks. Nokia’s agreed USD 2.3 billion purchase of Infinera consolidates DSP talent and PIC capacity under one roof. Ciena’s WaveLogic 6 roadmap moves encryption into 3 nm ASICs, locking competitors out of performance leadership for at least one design cycle. Cisco leverages its routing footprint to cross-sell optical security blades, anchoring accounts with life-cycle services.
Challengers exploit silicon-photonics cost curves. Marvell delivers merchant 800 G ZR/ZR+ modules to OEMs that lack in-house optics, broadening market access. Coherent’s transition to 6-inch InP wafers shrinks die cost and allows fourfold output, key for meeting hyperscale volume. Broadcom embeds quantum-resistant algorithm agility inside Emulex HBAs, targeting ransomware mitigation in Fibre-Channel SANs.
Patent activity intensifies around photonic integration and post-quantum key exchange. Meta and Google file for hermetic PIC packaging and slanted-grating couplers to reduce insertion loss, reinforcing defensible moats. Start-ups pursuing quantum-random number generators and neuromorphic optical encryption carve niche niches beyond classical DSP scaling. Suppliers that combine vertical integration, NIST-validated algorithms, and low-power PICs stand best positioned to capture the next wave of AI-driven spending.
Optical Encryption Industry Leaders
Nokia Corporation
Huawei Technologies Co. Ltd
Broadcom Inc.
Cisco System Inc.
Ciena Corporation
- *Disclaimer: Major Players sorted in no particular order

Recent Industry Developments
- June 2025: IonQ announced the acquisition of Lightsynq Technologies, adding photonic-memory IP to bolster its quantum networking roadmap
- May 2025: IonQ completed the purchase of ID Quantique, a leading quantum key distribution vendor, strengthening its secure-communications portfolio.
- March 2025: Ciena unveiled a 1.6 Tbps WaveLogic 6 Nano pluggable optimized for short-reach data-center links.
- March 2025: Marvell demonstrated end-to-end PCIe Gen 6 over optics at OFC 2025, enabling low-latency GPU fabrics.


Research Methodology Framework and Report Scope
Market Definitions and Key Coverage
Our study defines the optical encryption market as all carrier-class hardware, pluggable modules, key-management software, and managed services that secure in-flight data through Layer 1, 2, and 3 optical links across metro, long-haul, and subsea routes. Traffic handled inside data centers, telecom backbones, and high-speed enterprise WANs is included, provided the encryption function lives on the optical layer or an integrated coherent module.
Exclusion: Inline IP appliances that encrypt only electrical packet streams without touching the optical path sit outside this scope.
Segmentation Overview
- By Encryption Layer
- Layer 1
- Layer 2
- Layer 3
- By Data Rate
- less than 10 Gbps
- 10 - 40 Gbps
- 40 - 100 Gbps
- above 100 Gbps
- By Component
- Hardware Encryption Appliances
- Coherent/Pluggable Modules and Optics
- Key-Management / Orchestration Software
- Managed Encryption Services
- By Deployment Mode
- On-Premise (Carrier-Owned)
- Cloud / Network-as-a-Service
- Edge / Remote-Site Appliances
- By End-user Vertical
- Datacenter and Cloud
- BFSI
- Government and Defense
- Healthcare
- Energy and Utilities
- Retail and E-commerce
- Other End-user Verticals
- By Geography
- North America
- United States
- Canada
- Mexico
- South America
- Brazil
- Argentina
- Rest of South America
- Europe
- Germany
- United Kingdom
- France
- Rest of Europe
- Asia Pacific
- China
- India
- Japan
- South Korea
- ASEAN
- Rest of Asia Pacific
- Middle East
- Saudi Arabia
- UAE
- Turkey
- Rest of Middle East
- Africa
- South Africa
- Rest of Africa
- North America
Detailed Research Methodology and Data Validation
Desk research
Analysts accessed open datasets such as ITU fiber-kilometer deployments, OECD broadband statistics, U.S. FCC carrier filings, Eurostat telecom investment tables, and global customs shipment logs, which map chassis and pluggable exports. Company 10-Ks, investor decks, and trade group white papers complemented these benchmarks. Paid repositories like D&B Hoovers and Dow Jones Factiva supplied revenue splits and deal flow that helped size vendor footprints. This list is illustrative; many additional public and licensed sources informed the desk phase.
Primary research
Direct conversations with optical hardware engineers, C-suite security officers, telco procurement heads, and regional systems integrators across North America, Europe, and Asia Pacific validated adoption triggers, average selling prices, and capacity upgrade road maps, closing gaps left by desk work.
Market-sizing & forecasting
Model building begins with a top-down view that reconstructs encrypted wavelength capacity from carrier capex disclosures, fiber build-out meters, and 40/100 Gbps port shipment reports, which are then priced using region-weighted ASP curves. Results are cross-checked through selective bottom-up aggregation of vendor revenue bands and channel checks. Key variables include metro data-center interconnect growth, post-quantum pilot counts, government zero-trust mandates, average link speed mix, and coherent module cost erosion. A multivariate regression fitted to these drivers generates annual forecasts; scenario analysis adjusts for policy or supply chain shocks. Where bottom-up estimates diverge, uplift or deflate factors are applied to keep totals consistent with verified usage ratios.
Data validation and update cycle
Before release, an analyst reviews variance flags, re-contacts key sources, and reconciles currency conversions. Outputs are benchmarked against independent bandwidth indices and quarterly vendor prints. The model refreshes each year, with interim updates when material events, such as spectrum auctions or export controls, alter demand baselines.
Why Mordor's Optical Encryption Baseline earns trust
Published figures often differ because firms choose dissimilar encryption layers, bundle or omit key-management software, convert currencies at varied dates, or extrapolate growth from limited regional pilots.
Key gap drivers here include whether services revenue is counted alongside hardware, how aggressively ASP compression is modeled, and the cadence at which port-shipment data is refreshed. Mordor analysts align scope tightly with deployed optical gear, apply twice-yearly price audits, and use mixed-method validation, leading to a dependable mid-case view.
Benchmark comparison
| Market Size | Anonymized source | Primary gap driver |
|---|---|---|
| USD 4.85 B (2025) | Mordor Intelligence | - |
| USD 4.50 B (2024) | Global Consultancy A | Bundles electrical IP appliances; annual currency conversion set once per study |
| USD 3.84 B (2024) | Regional Consultancy B | Excludes managed encryption services revenue and uses single-region ASP averages |
| USD 1.30 B (2024) | Trade Journal C | Counts only Layer 1 gear and applies conservative port upgrade assumptions |
The comparison shows that when scope, price erosion, and service layers are handled consistently, Mordor delivers a balanced, transparent baseline that decision-makers can trace back to clear variables and repeatable steps.


Key Questions Answered in the Report
What is driving the strong growth of the optical encryption market?
Demand for quantum-safe security, AI-led bandwidth surges, and zero-trust mandates that favor hardware-based Layer 1 solutions are collectively pushing the market toward an 8.62% CAGR through 2031.
Which segment currently leads in revenue?
Layer 1 hardware platforms dominate with 45.60% market share in 2025 because they encrypt at line rate and remove software vulnerabilities.
Why is Asia Pacific the fastest-growing region?
Large-scale quantum-technology funding, 6 G trials, and aggressive data-center builds give Asia Pacific a 9.62% CAGR, outpacing all other regions.
How are coherent pluggable modules changing the competitive landscape?
Silicon-photonic pluggables cut cost and power, posting a 15.85% CAGR that challenges traditional chassis-based appliances and expands supplier diversity.
What role do post-quantum standards play in adoption?
NIST’s final FIPS 203–205 standards remove algorithm uncertainty, prompting enterprises to budget for crypto-agile optical hardware compliant with future regulatory audits.
Are high capital costs still a barrier?
Yes, coherent 400 G+ optics remain expensive, but initiatives like Coherent’s 6-inch InP wafers are expected to lower die costs by 60% within two years, easing adoption for cost-sensitive buyers.
Page last updated on:


