India Optical Transport Network Market Size and Share
Market Overview
| Study Period | 2020 - 2031 |
|---|---|
| Forecast Data Period | 2026 - 2031 |
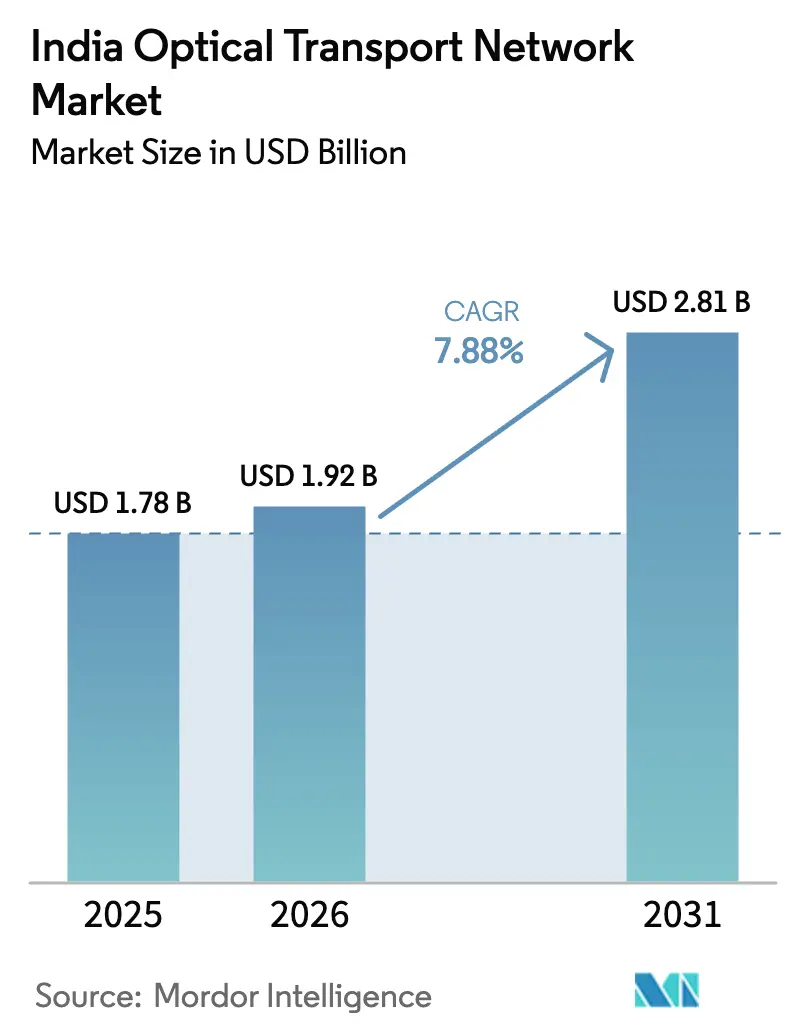
| Base Year Market Size (2025) | USD 1.78 Billion |
| Market Size (2026) | USD 1.92 Billion |
| Market Size (2031) | USD 2.81 Billion |
| Growth Rate (2026 - 2031) | 7.88% CAGR |
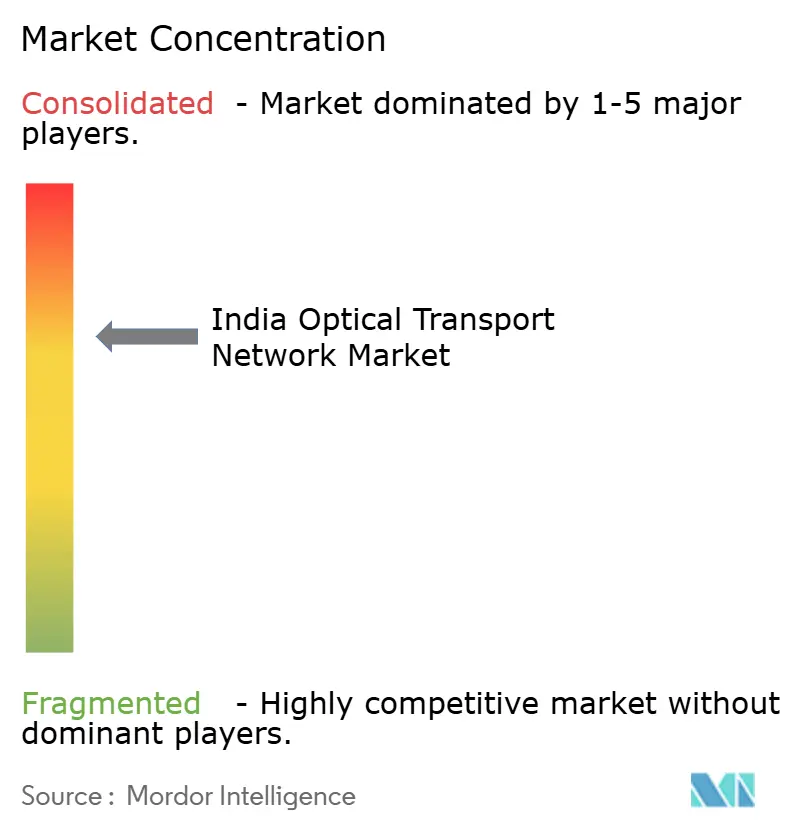
| Market Concentration | Medium |
Major Players *Disclaimer: Major Players sorted in no particular order Image © Mordor Intelligence. Reuse requires attribution under CC BY 4.0. | |
India Optical Transport Network Market Analysis by Mordor Intelligence
The India Optical Transport Network market size is expected to grow from USD 1.78 billion in 2025 to USD 1.92 billion in 2026 and is forecast to reach USD 2.81 billion by 2031 at 7.88% CAGR over 2026-2031.
Robust nationwide 5G rollouts, a fast-growing data-center footprint, and heavy government backing for rural fiber connectivity are driving steady capital outlays from telecom operators, cloud providers, and public agencies. Large deployments of 5G backhaul links, together with hyperscale data-center clusters in Mumbai, Chennai, and Delhi-NCR, require high-capacity wavelength services that only dense wavelength-division multiplexing (DWDM) and coherent optics can supply. Component revenues still dominate, but managed services are expanding quickly as operators outsource the design and operations of multi-vendor optical layers. At the same time, supply-chain friction from trade disputes and a shortage of trained optics engineers are adding cost and execution risk, even as favorable policy measures such as BharatNet Phase 3 and new international submarine cables keep long-term demand intact.
Key Report Takeaways
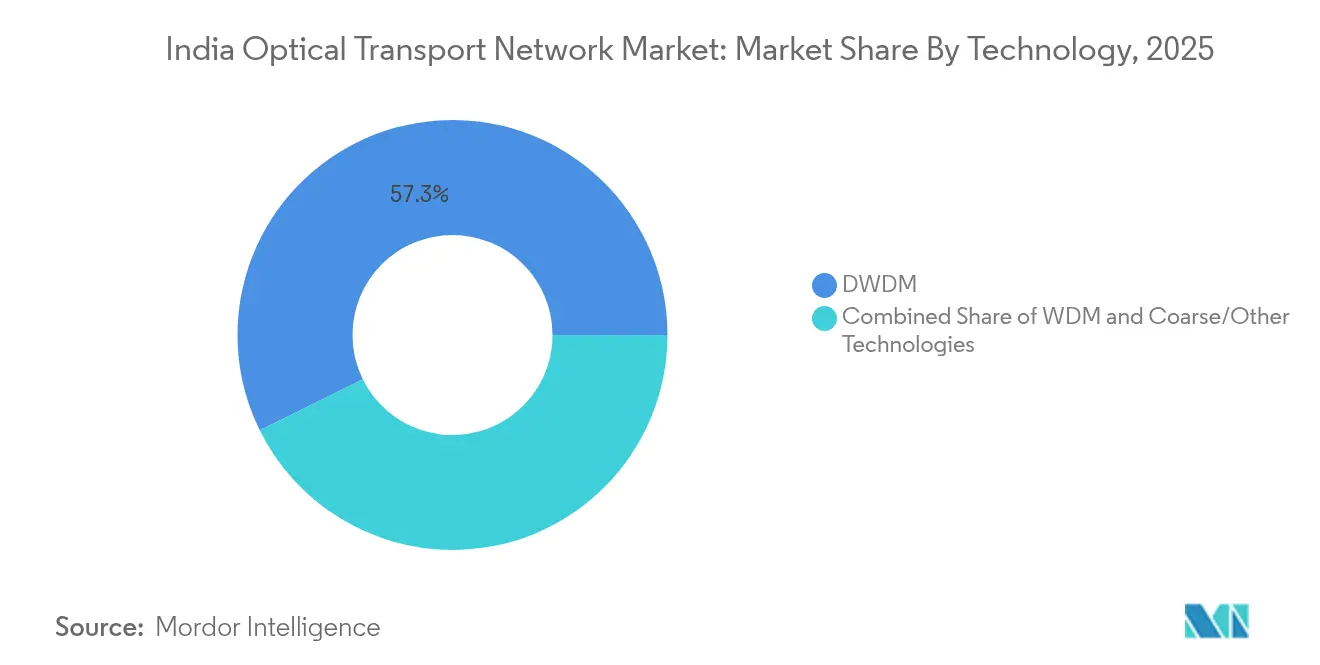
- By technology, DWDM led with 57.30% revenue share in 2025; SD-WDM & 400G+ coherent recorded the highest projected CAGR at 9.75% through 2031.
- By offering, components held 63.20% of the India optical transport network market share in 2025, while services are forecast to expand at a 9.05% CAGR to 2031.
- By end-user vertical, IT & Telecom operators commanded 45.40% of the India optical transport network market size in 2025; cloud & colocation data centers will accelerate at 10.95% CAGR between 2026-2031.
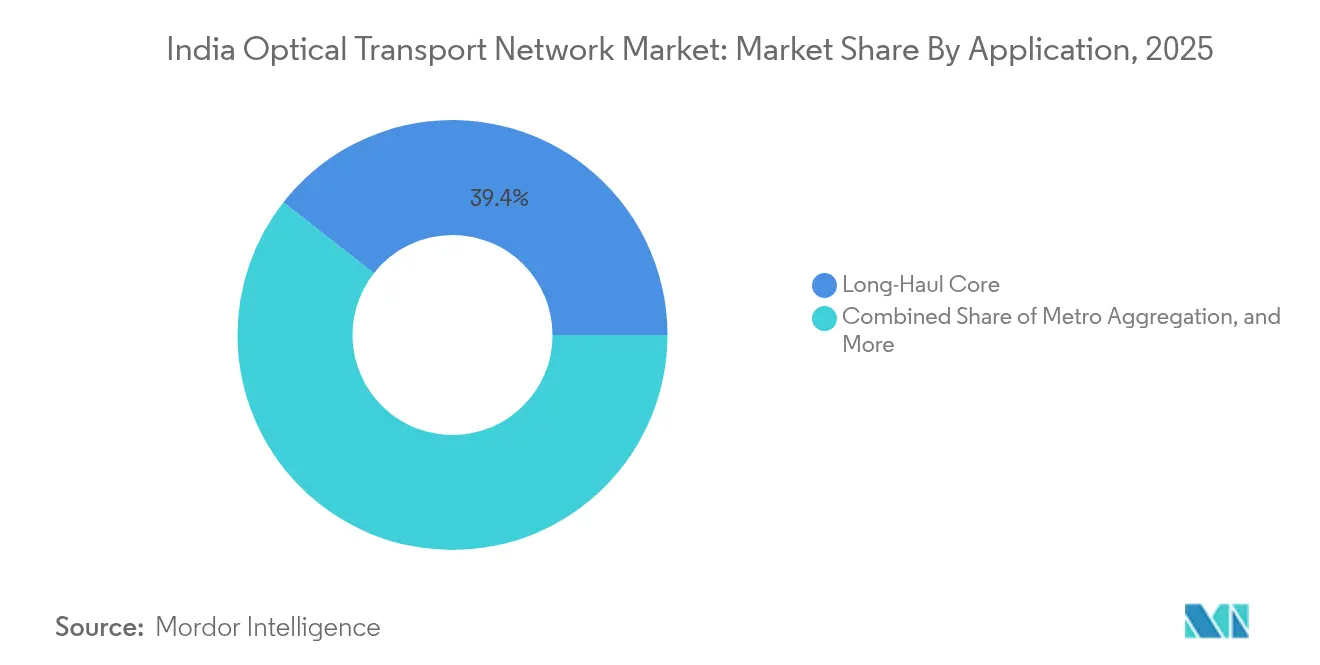
- By application, long-haul core captured 39.40% revenue share in 2025; data-center-interconnect is advancing at a 10.25% CAGR through 2031.
- By line-rate, 100-400 Gbps solutions took 57.20% share of the India optical transport network market size in 2025, whereas more than 400 Gbps technologies show the fastest 11.10% CAGR outlook.
Note: Market size and forecast figures in this report are generated using Mordor Intelligence’s proprietary estimation framework, updated with the latest available data and insights as of 2026.
Worldwide, activity is shaped by contributions from multiple countries and regions, with India representing one among them. The global report on optical transport network market by Mordor Intelligence reflects how these countries and regional layers combine into a single system.
India Optical Transport Network Market Trends and Insights
Drivers Impact Analysis*
| Driver | (~) % Impact on CAGR Forecast | Geographic Relevance | Impact Timeline |
|---|---|---|---|
| Surge in 5G rollouts & fiber backhaul densification | 2.10% | Metros & tier-1 cities | Medium term (2–4 years) |
| Enterprise demand for ultra-low-latency DCI | 1.80% | Mumbai, Chennai, Delhi-NCR, Bangalore, Hyderabad | Short term (≤ 2 years) |
| BharatNet & other digital-inclusion programs | 1.50% | Rural & semi-urban India | Long term (≥ 4 years) |
| New submarine cables quadrupling international bandwidth | 1.20% | Coastal states | Medium term (2–4 years) |
| Source: Mordor Intelligence | |||
Surge in 5G roll-outs & fiber backhaul densification
India’s 5G launch multiplied monthly fiber laying six-fold to 101,550 km, while only 38.44% of cell sites are fiberized. Operators therefore face a sizeable gap as 5G needs roughly 10× more backhaul bandwidth than 4G, pushing multi-terabit optical upgrades in metro rings and long-haul corridors. Reliance Jio alone has activated more than 1 million 5G cells spanning 85% of the population[1]Ray Le Maistre, “Reliance Jio reaches 95% population coverage,” Light Reading, lightreading.com. Bharti Airtel’s deployment of 600G/800G photonic infrastructure nearly tripled backbone capacity, illustrating how coherent optics underpin nationwide 5G reach.
Enterprise demand for ultra-low-latency data-center-interconnect
India’s data-center inventory will expand from 1,255 MW today to 2,070 MW by end-2025. Hyperscalers now aggregate AI clusters across multiple buildings, creating intense “east-west” traffic that requires deterministic latency under 1 ms between campuses in Mumbai, Chennai, and Noida. Sify, CtrlS, and other providers are rolling out 600G and soon 1.6T wavelengths to support this surge, while Reliance Industries is investing USD 20-30 billion in a 3 GW green data center in Jamnagar.
BharatNet and other government fiber programs
The INR 1.39 lakh-crore BharatNet Phase 3 targets 6.5 lakh villages and 15 million FTTH lines by March 2027. More than 692,000 km of optical cable have already linked 214,000 gram panchayats. Domestic suppliers such as HFCL and RVNL won INR 6,925 crore contracts for turnkey builds. The program guarantees multi-year demand for passive fiber, optical transport gear, and wholesale bandwidth services across rural India.
New submarine cable landings quadrupling international bandwidth (2025-27)
2Africa Pearls, India-Asia-Express, and India-Europe-Express will lift lit capacity from 180 Tbps to over 720 Tbps. Airtel has already landed SEA-ME-WE-6 in Chennai[2]“SEA-ME-WE-6 cable lands in Chennai,” Total Telecom, totaltele.com. Gujarat and West Bengal are developing new landing stations to avoid over-reliance on Mumbai and Chennai, necessitating terrestrial optical trunks to ferry bandwidth to inland metros.
Restraints Impact Analysis*
| Restraint | (~) % Impact on CAGR Forecast | Geographic Relevance | Impact Timeline |
|---|---|---|---|
| High capex for metro/long-haul 400G+ upgrades | -1.80% | Nationwide, tier-2/3 cities are most affected | Medium term (2–4 years) |
| Scarcity of OTN-skilled workforce | -1.20% | Rural & semi-urban areas | Long term (≥ 4 years) |
| Source: Mordor Intelligence | |||
High capex for metro/long-haul 400G+ upgrades
Airtel’s quarterly capex jumped to INR 10,400 crore in FY25 as it modernised optical layers. Currency depreciation and new customs duties on PCBAs add 3-4% to import costs, and operators still struggle to monetise 5G with ARPUs of INR 146-209.
Scarcity of OTN-skilled workforce
Telecom Sector Skills Council projects a 2.41 million talent gap by 2030 for transport, IoT, and AI integration. Attrition rates of 35-40% strain deployment timelines, especially in BharatNet clusters, where fiber rollouts hinge on local technicians.
*Our forecasts treat driver/restraint impacts as directional, not additive. The impact forecasts reflect baseline growth, mix effects, and variable interactions.
Segment Analysis
By Technology: DWDM Dominance Faces Coherent Disruption
DWDM retained 57.30% share of the India optical transport network market in 2025 by enabling cost-efficient spectrum utilisation on the existing fiber plant. Operators prefer DWDM for metro and long-haul builds because the installed base supports smooth in-service upgrades without trenching new fiber. Yet SD-WDM and next-generation 400G+ coherent solutions are scaling at a 9.75% CAGR as hyperscalers demand programmable bandwidth and higher spectral efficiency. Nokia’s sixth-generation super-coherent optics deliver 1.2 Tbps per wavelength, halving the number of modules needed on New Delhi-Mumbai routes. This shift will gradually compress DWDM share but also grow total capacity, sustaining the India optical transport network market.
The migration path involves plug-and-play coherent pluggables that slide into existing line systems, letting operators augment capacity in 100 Gbps slices. Coherent Corp.’s silicon-photonics 1.6T modules using 3 nm DSPs illustrate how die-shrink economics will widen adoption. Meanwhile, coarse WDM remains relevant for access rings in BharatNet because the lower upfront cost outweighs the spectral limits. Taken together, coherent acceleration ensures the India optical transport network market size receives a fresh demand wave as 5G and AI traffic grow at double-digit rates.


By Offering Type: Services Growth Outpaces Components
Components generated 63.20% of total revenue in 2025 because 5G backhaul and data-center construction required large volumes of optical line systems, ROADMs, and transponders. However, service-centric contracts are expanding 9.05% annually as operators seek design, automation, and field maintenance under outcome-based models. Integrated build-operate-transfer deals signed by Airtel and Vodafone Idea illustrate the pivot from pure CapEx to life cycle OpEx. This shift creates recurring revenue streams but also raises vendor responsibilities for performance KPIs.
Network design and consulting services now bundle AI-driven planning to predict wavelength demand, while managed network-as-a-service packages guarantee latency and uptime SLA levels critical for financial trading and telemedicine. In parallel, makers of optical platform controllers embed open APIs so operators can orchestrate optical and IP layers via a single software stack, aligning with government mandates for secure, vendor-agnostic networks. As service sophistication rises, the India optical transport network market continues to pivot from hardware centricity toward an integrated lifecycle model that reinforces multiyear customer lock-in.
By End-user Vertical: Cloud Data Centers Accelerate Past Telecoms
IT & Telecom carriers still anchor 45.40% of spending because they own national rights-of-way and large mobile bases requiring scale backhaul. Yet hyperscale and colocation data-center operators are on a sharper 10.95% CAGR trajectory as AI inference workloads balloon. The India optical transport network industry now sees cloud providers contracting directly with equipment vendors to build private dark-fiber rings between campuses in Mumbai and Chennai, bypassing traditional carriers to secure deterministic 400G links at predictable cost.
Government and defense networks, including BSNL’s 4G/5G nationwide rollout, continue to issue tender-based procurements that favour domestic content. Edge compute in healthcare and media verticals further diversifies uptake, demonstrated by Huawei’s Campus OptiX, reducing hospital network maintenance workload by 60%. With enterprise cloud adoption surging and BharatNet improving last-mile reach, vertical diversification ensures the India optical transport network market maintains a balanced customer mix that can weather cyclical telecom ARPU swings.
By Application: DCI Emerges as Growth Leader
Long-haul core routes connecting Mumbai-Delhi-Chennai-Kolkata form the backbone of the internet and thus hold 39.40% revenue share. These routes also carry future submarine capacity surges, reinforcing their strategic importance. At the same time, data-center-interconnect (DCI) is expected to outpace all other use cases at a 10.25% CAGR as AI training clusters rely on ultra-low-latency fiber within a single metro. Constl is rolling out an 800G-ready national long-distance mesh to meet DCI growth.
5G backhaul remains a solid volume driver as small cells and edge compute proliferate across densifying metro grids. Access/edge builds in rural FTTH under BharatNet also spur steady demand for sub-100 Gbps optics, ensuring full spectrum utilisation across the India optical transport network market spectrum.
By Line-Rate Capacity: More than 400 Gbps Technologies Lead Innovation
Mainstream 100-400 Gbps links deliver 57.20% of current shipments because they integrate smoothly with incumbent ROADM nodes and IP routers. Yet more than 400 Gbps lanes grow fastest at 11.10% CAGR on the back of AI storage replication, 5G aggregation, and dense 4K/8K streaming traffic. Airtel’s live 800 Gbps backbone build leveraged Ciena WaveLogic 5 Extreme to triple capacity per fiber. Cisco forecasts 800 G pluggables overtaking 400 G by 2025 in AI back-end fabrics. To manage power budgets, vendors explore liquid-cooled line cards and 3D-stacked DSPs that deliver 0.25 pJ/bit efficiency, ensuring that capacity scale does not undermine sustainability targets.
Geography Analysis
In metro hubs, Mumbai hosts the most submarine cable landings and therefore accounts for the largest slice of the India optical transport network market. Chennai now rivals Mumbai after SEA-ME-WE-6 and IAX cables boosted international connectivity. Delhi-NCR leverages proximity to federal institutions and fintech firms, necessitating high availability optical grids between Noida, Gurugram, and Manesar. Bangalore and Hyderabad anchor the southern corridor for SaaS exporters, with cloud campuses demanding diverse, latency-guaranteed fiber paths.
Tier-2 cities such as Pune, Kochi, and Jaipur are emerging nodes as data-center operators pursue regional latency and energy efficiency. CtrlS’ expansion into tier-2 locations underscores this pivot. BharatNet’s rural build brings backbone rings to district headquarters, allowing ISPs to light fiber to 110,000 new villages by 2027. Coastal Gujarat and West Bengal will add new cable landing stations at Digha and Mandvi, creating fresh long-haul routes via Jaipur and Ahmedabad that bypass congested Mumbai.
5G coverage across all 779 districts strengthens nationwide demand. Reliance Jio’s intense small-cell densification in urban cores compels fiber densification down every street in India’s largest 100 cities. Meanwhile, industrial corridors such as Delhi-Mumbai and Chennai-Bangalore require dedicated optical systems for logistics tracking, smart manufacturing, and real-time analytics. The confluence of metro densification, rural inclusion, and corridor digitisation ensures every region contributes to the growth of the India optical transport network market.
Competitive Landscape
Global majors Nokia, Ciena, Huawei, and Cisco dominate technology roadmaps through patented coherent DSPs, photonic engine advances, and integrated IP-optical solutions. Domestic vendors Tejas Networks and Sterlite Technologies leverage cost competitiveness and local sourcing incentives. Nokia’s USD 2.3 billion purchase of Infinera positions the firm with 20% worldwide optical share, elevating its bargaining power when bidding for Indian multi-year tenders[3]Rajesh Gopinathan, “Nokia–Infinera deal wins EU nod,” Telecom Lead, telecomlead.com. Vendors agreed to discounts of 30-40% below global benchmarks for recent contracts because of India’s scale, illustrated by Vodafone Idea’s INR 30,000 crore multi-vendor deal.
Strategic partnerships are shifting competition from box sales toward joint AI-centric solutions. Jio’s alliance with AMD, Cisco, and Nokia for a Telecom AI Platform shows carriers betting on automated optical capacity planning. Microsoft extends its router supply pact with Nokia for Azure, underscoring cloud-provider influence over optical R&D. Make-in-India subsidies stimulate indigenous component projects, such as silicon photonics fabs in Tamil Nadu that will supply domestic coherent pluggables by 2028. While geopolitical tensions cloud Huawei’s prospects, the vendor remains a price leader in private enterprise projects.
Looking ahead, service differentiation around lifecycle management, security (quantum-safe encryption), and sustainability will define competitive edges. Global players with cross-layer IP-optical automation and domestic firms with agile manufacturing capacity are both well-positioned to tap the multi-faceted growth story of the India optical transport network market.
India Optical Transport Network Industry Leaders
Nokia Corporation
Cisco Systems Inc.
Huawei Technologies Co. Ltd
ZTE Corporation
Fujitsu Limited
- *Disclaimer: Major Players sorted in no particular order

Recent Industry Developments
- May 2025: Nokia secured a USD 120 million IP backhaul deal from Vodafone Idea, deploying 7750 SR and 7250 IXR series gear to raise 4G & 5G capacity.
- March 2025: Nokia completed Vodafone Idea’s optical upgrade using 1830 PSS and CDC-F 2.0 switching, reducing carbon footprint while boosting flexibility.
- February 2025: Nokia gained EU approval to acquire Infinera for USD 2.3 billion, forming the world’s second-largest optical vendor.
- December 2024: Ericsson extended its multi-billion deal with Bharti Airtel for 4G/5G RAN expansion, including Open RAN-ready radios.


Research Methodology Framework and Report Scope
Market Definitions and Key Coverage
Our study defines the India optical transport network (OTN) market as all revenue generated inside the country from purpose-built equipment, transport shelves, optical switches, packet-optical platforms, and the associated design, maintenance, and managed services that move multiplexed light signals between aggregation, metro, and long-haul nodes. Each unit must comply with ITU-T G.709 framing to be counted.
Scope Exclusions: Passive dark-fiber leases and purely electronic transponders that never enter the optical layer are kept outside this assessment.
Segmentation Overview
- By Technology
- WDM
- DWDM
- Coarse/Other Technologies (SD-WDM, O-band)
- By Offering Type
- Components
- Optical Transport Equipment
- Optical Switch
- Optical Platform/Controller
- Services
- Network Design and Consulting
- Maintenance, Managed and Support
- Components
- By End-user Vertical
- IT and Telecom Operators
- Cloud and Colocation Data Centers
- Government and Defence Networks
- Financial Services
- Healthcare and Lifesciences
- Media and Entertainment
- By Application
- Long-Haul Core
- Metro Aggregation
- Access/Edge and 5G Back-haul
- Data-Center-Interconnect (DCI)
- By Line-Rate Capacity
- Less than Equal to 100 Gbps
- 100 - 400 Gbps
- More than 400 Gbps
Detailed Research Methodology and Data Validation
Primary Research
We validated desk findings through structured calls with network planners at tier-1 telecom operators, regional data-center integrators, and optical-component OEM product managers across Mumbai, Bengaluru, and Delhi. Interviews and short surveys provided live insights on deployment pacing, 5G backhaul fiberization, and expected pricing for 800 G upgrades, bridging information gaps and tightening assumptions.
Desk Research
Mordor analysts first map the demand pool through freely available tier-1 datasets such as TRAI's annual Telecom Performance Indicators, DoT's BharatNet rollout dashboards, the Reserve Bank of India's payment-volume statistics, and International Telecommunication Union fiber-route inventories. Industry papers from associations like TEMA, scholarly articles indexed on IEEE Xplore, and company filings on the Ministry of Corporate Affairs portal sharpen technology adoption curves. Paid intelligence from D&B Hoovers and Dow Jones Factiva fills corporate-level gaps on revenue mix and deal flow.
Government customs import ledgers, spectrum-auction filings, and peer-reviewed optical-physics journals then anchor component volumes, while news archives benchmark typical 400 G coherent port prices before the data is ingested into our model. The sources listed are illustrative; many additional references support data capture, cross-checks, and clarification.
Market-Sizing & Forecasting
A top-down build starts from TRAI-reported lit-fiber kilometers and international bandwidth statistics, which are then multiplied by penetration-rate based demand pools for 100 G, 400 G, and 800 G wavelengths. Selective bottom-up roll-ups of supplier shipments and sampled ASP × volume validate totals. Key input variables include annual 5G base-station count, incremental data-center rack additions, average coherent-port price erosion, and route-km covered under BharatNet Phase 3. A multivariate regression with ARIMA refinement projects each driver five years forward; scenario analysis adjusts for currency swings and silicon-photonics adoption speed. Data voids in bottom-up estimates are bridged through guarded interpolation, subsequently re-verified with experts.
Data Validation & Update Cycle
Outputs pass two in-house peer reviews, variance checks against external indicators, and anomaly screens. Any gap wider than ±7 percent triggers re-contact of key respondents. Reports refresh annually, with interim mini-updates whenever capex guidance, large spectrum auctions, or regulatory changes materially affect the baseline.
Why Mordor's India Optical Transport Network Baseline Figures Earn Trust
Published estimates often diverge because firms choose different inclusion rules, price assumptions, and refresh cadences. Some track only hardware, others fold in services, and a few extrapolate India values from Asia-Pacific ratios.
Key gap drivers here stem from scope breadth (hardware + services vs hardware alone), base year selection, and the frequency with which input prices are rebased. Mordor's model, anchored in 2024 audited data and refreshed each year, incorporates managed-service revenues and local ASP surveys, whereas other publishers rely on global averages or infrequent updates.
Benchmark comparison
| Market Size | Anonymized source | Primary gap driver |
|---|---|---|
| USD 1.78 B (2025) | Mordor Intelligence | - |
| USD 1.64 B (2025) | Regional Consultancy A | India value back-calculated from Asia totals; limited primary validation |
| USD 0.91 B (2023) | Global Consultancy B | Tracks only hardware; excludes design and support services and uses older base year |
Taken together, the comparison shows that when service revenues, current-year ASPs, and verified deployment timelines are folded in, Mordor Intelligence delivers a balanced, transparent baseline that decision-makers can trace back to clear variables and repeatable steps.


Key Questions Answered in the Report
What is the current size of the India optical transport network market?
The market stands at USD 1.92 billion in 2026 and is projected to cross USD 2.81 billion by 2031, reflecting a 7.88% CAGR over 2026-2031.
Which segment is growing the fastest?
Data-center-interconnect applications are set to grow at 10.25% CAGR as hyperscale and AI clusters require ultra-low-latency fiber links.
How big is DWDM’s share of the market?
DWDM technology holds 57.30% revenue share in 2025, thanks to its mature footprint in long-haul and metro networks.
Why are services becoming more important?
Operators increasingly outsource network design and management, pushing service revenues to a 9.05% CAGR as optical layers grow more complex.
What challenges could slow market growth?
High 400G+ upgrade capex and a shortage of trained optical professionals add cost and timing risks that could trim near-term ROI.
Which regions inside India are seeing the highest deployment intensity?
Metro hubs such as Mumbai, Chennai, and Delhi-NCR lead due to data-center concentration and submarine cable landings, while BharatNet drives rural fiber expansion.
Page last updated on:


