United States Dark Fiber Network Market Size and Share
Market Overview
| Study Period | 2020 - 2031 |
|---|---|
| Forecast Data Period | 2026 - 2031 |
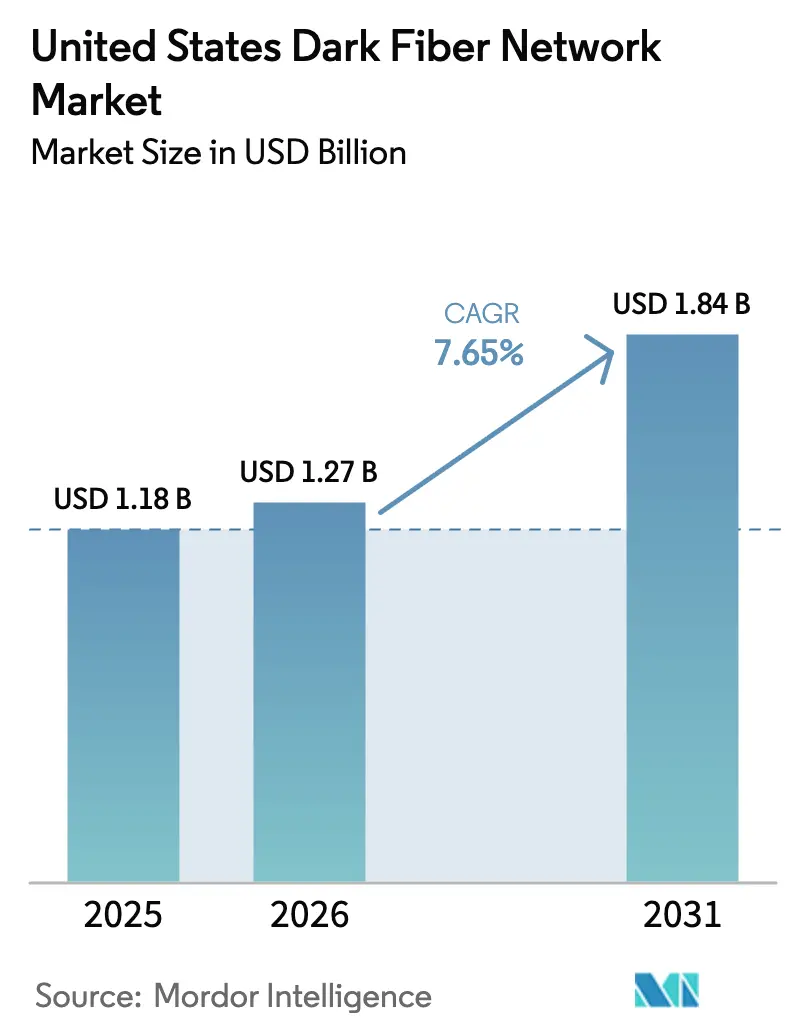
| Base Year Market Size (2025) | USD 1.18 Billion |
| Market Size (2026) | USD 1.27 Billion |
| Market Size (2031) | USD 1.84 Billion |
| Growth Rate (2026 - 2031) | 7.65% CAGR |
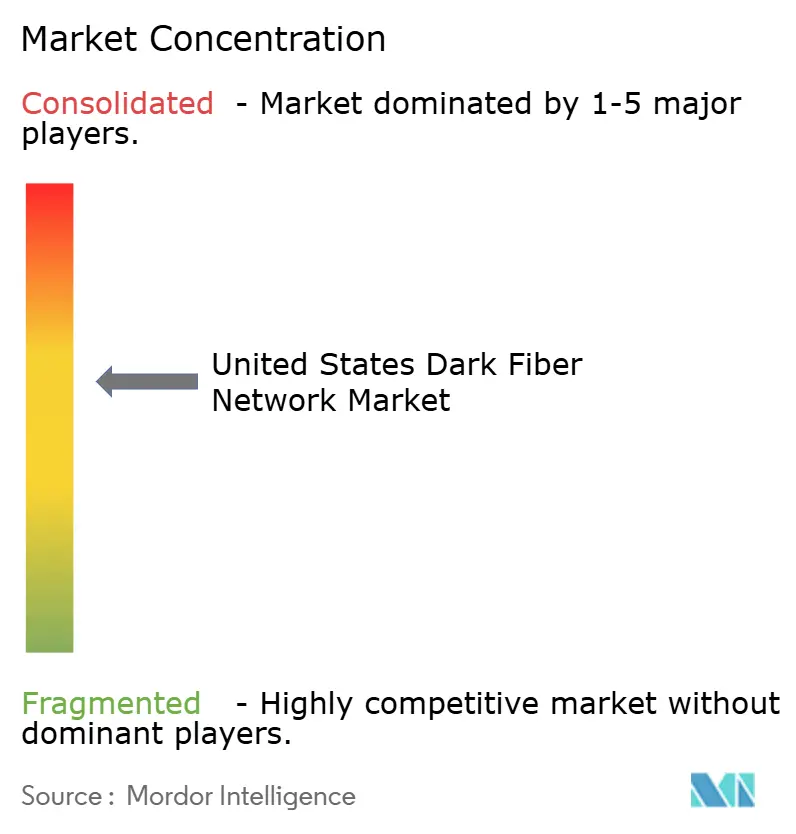
| Market Concentration | Medium |
Major Players *Disclaimer: Major Players sorted in no particular order Image © Mordor Intelligence. Reuse requires attribution under CC BY 4.0. | |
United States Dark Fiber Network Market Analysis by Mordor Intelligence
The United States dark fiber network market size was valued at USD 1.18 billion in 2025 and estimated to grow from USD 1.27 billion in 2026 to reach USD 1.84 billion by 2031, at a CAGR of 7.65% during the forecast period (2026-2031). Accelerating demand from AI-enabled hyperscale data centers, 5G backhaul, and enterprise cloud migrations is driving sustained capacity upgrades across long-haul and metro routes, with operators steadily raising fiber counts per span. Hyperscalers are ordering 12-48 fiber pairs per route to secure diversity and headroom, a sharp increase from the four-pair norm observed only a few years ago. Federal Broadband Equity, Access, and Deployment grants are channeling capital toward underserved corridors, narrowing the urban-rural connectivity gap while expanding wholesale leasing opportunities for regional carriers. At the same time, 400G and 800G coherent optics enable service providers to light previously idle strands at far higher spectral efficiency, thereby elevating the strategic utility of unlit fiber even in mature metropolitan areas.
Key Report Takeaways
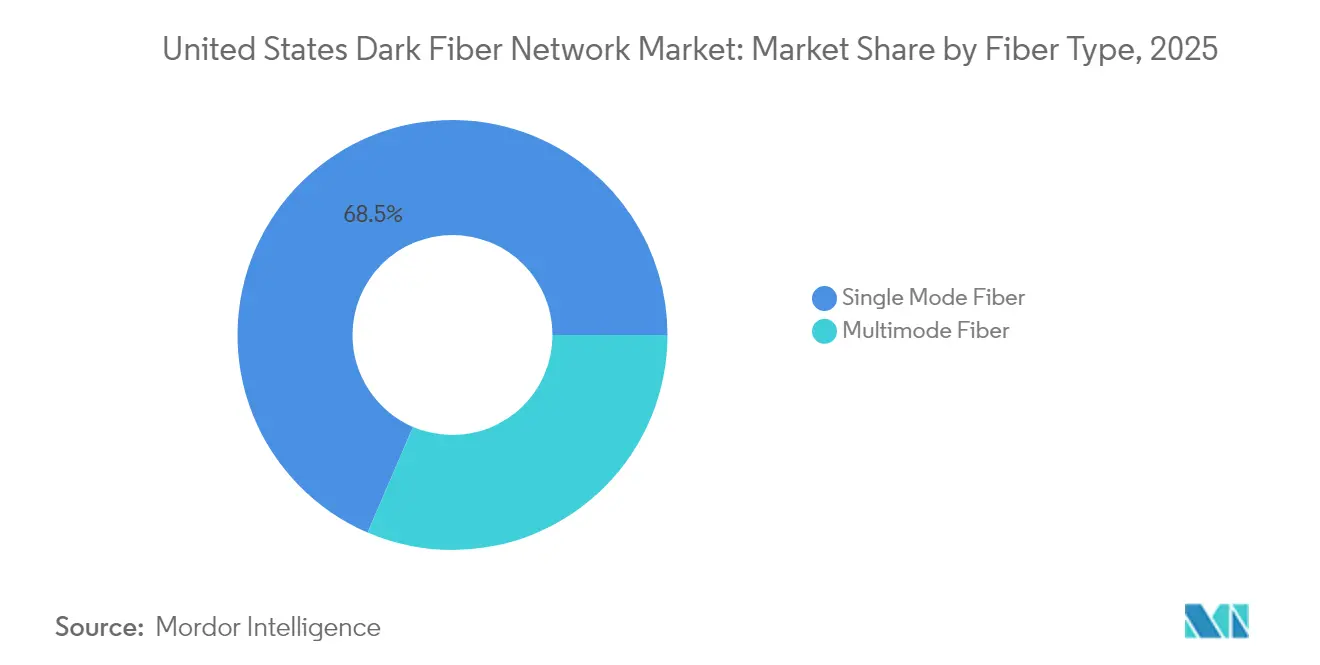
- By fiber type, single-mode fiber led with a 68.54% market share in the United States dark fiber network in 2025, whereas multimode fiber is projected to advance at a 9.67% CAGR through 2031.
- By network type, metro deployments captured a 64.58% revenue share in 2025; long-haul routes are expected to record the fastest growth, with a 9.64% CAGR to 2031.
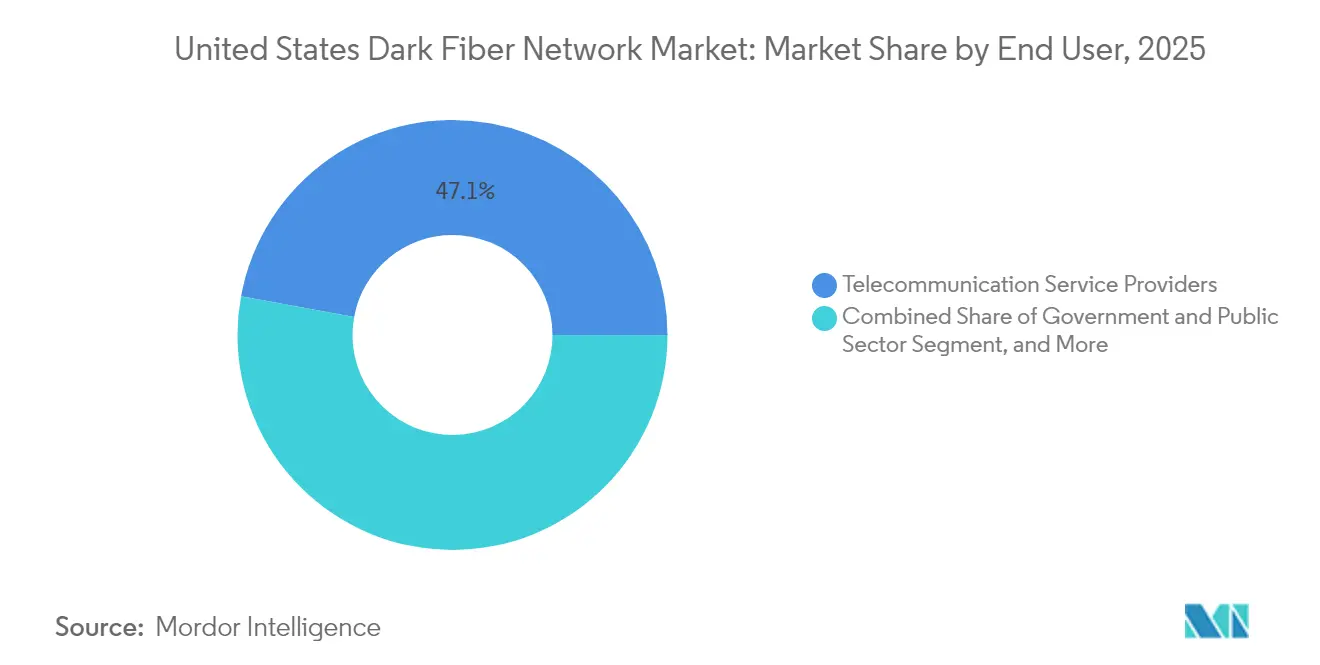
- By end user, telecommunication service providers commanded 47.11% of the United States dark fiber network market size in 2025, while the government and public sector segment is forecast to expand at an 8.41% CAGR.
- By application, communication services accounted for a 34.12% share of the United States dark fiber network market size in 2025, and secure networks and storage are anticipated to grow the quickest at an 8.52% CAGR.
Note: Market size and forecast figures in this report are generated using Mordor Intelligence’s proprietary estimation framework, updated with the latest available data and insights as of 2026.
United States Dark Fiber Network Market Trends and Insights
Drivers Impact Analysis*
| Driver | (~) % Impact on CAGR Forecast | Geographic Relevance | Impact Timeline |
|---|---|---|---|
| Surge in Bandwidth Demand from 5G Backhaul | +2.1% | National, with early gains in major metro areas | Medium term (2-4 years) |
| Proliferation of Hyperscale Data Centers | +2.8% | Regional clusters: Northern Virginia, Dallas, Chicago, Silicon Valley | Short term (≤ 2 years) |
| Cloud Service Providers' Shift to Dedicated Connectivity | +1.9% | National, concentrated in data center hubs | Medium term (2-4 years) |
| Rising Interest from Electric Utilities to Monetize Rights-of-Way | +1.2% | Rural and suburban corridors nationwide | Long term (≥ 4 years) |
| Municipal Digital Equity Initiatives Enabling Open-Access Dark Fiber | +1.4% | Urban and suburban municipalities | Medium term (2-4 years) |
| Tax Incentives for Rural Broadband Infrastructure in CARES Act Extensions | +0.8% | Rural areas, particularly underserved regions | Long term (≥ 4 years) |
| Source: Mordor Intelligence | |||
Surge in Bandwidth Demand from 5G Backhaul
Mobile operators are replacing microwave links with fiber to satisfy 5G’s ultra-low-latency and enhanced broadband requirements. The 2024 Communications Marketplace Report confirms that carriers prioritized dense fiber builds around small-cell clusters, often securing excess dark fiber to future-proof capacity.[1]Federal Communications Commission, “2024 Communications Marketplace Report,” fcc.gov Each 5G macro-site now requires at least two dark strands for primary and secondary backhaul, while dense urban zones may need a dozen. The push is most pronounced in New York, Los Angeles, and Dallas, where spectrum holdings above 3.5 GHz require fiber to fully exploit massive MIMO. Vendors report a 27% year-over-year increase in fiber-connected radio sites, and neutral-host wholesalers are increasingly bundling dark fiber IRUs with 25-year terms to secure anchor tenants. As edge-computing nodes proliferate alongside small cells, contiguous metro rings become indispensable, propelling the United States dark fiber network market forward.
Proliferation of Hyperscale Data Centers
The International Energy Agency estimates that United States data centers consumed roughly 180 TWh in 2024, accounting for 45% of global usage, and projects a 130% rise by 2030, led by AI training clusters.[2]International Energy Agency, “Energy and AI,” iea.org Hyperscalers routinely demand 12-48 fiber pairs per corridor to interconnect availability zones, a six-fold jump over 2021 norms. Northern Virginia’s 5 GW campus density illustrates the magnitude: operators there bid for any dark strands along diverse routes toward Ashburn to mitigate single-point failures. Providers such as Lumen offer 432-fiber cables with dual sheath construction, allowing customers to lease geographically redundant conduits. Continual scaling of large language model training sets makes unlit fiber a hedge against optical upgrade cycles, lifting route-mile valuations and accelerating build-outs in secondary hubs like Columbus and Omaha.
Cloud Service Providers’ Shift to Dedicated Connectivity
Cloud providers are migrating away from wavelength-based wholesale agreements toward indefeasible rights of use on dark fiber, citing cost, security, and determinism advantages. Cisco calculates that owning or leasing unlit strands can lower total network TCO by 48% over a five-year horizon compared with managed bandwidth services.[3]Cisco Systems, “Beyond the Data Center - High-Performance Networks for AI,” cisco.com Maryland’s Department of Information Technology realized USD 111 million in annual opex savings after migrating mission-critical workloads onto leased dark routes, freeing budget for cybersecurity and edge-compute initiatives. Adoption has accelerated as 400G ZR and 800G pluggable optics enable direct-detect line cards within spine switches, eliminating the need for external transport shelves. This architectural flattening intensifies demand for low-loss G. 652. D-compliant single-mode fiber reels, underpinning the steady climb of the United States' dark fiber network market.
Rising Interest from Electric Utilities to Monetize Rights-of-Way
Rural electric cooperatives and investor-owned utilities possess tens of thousands of pole-line miles that overlap broadband desert census tracts. By overlaying optical composite conductors onto transmission spurs, utilities can unlock incremental revenue without requiring significant additional right-of-way negotiation. The Fiber Broadband Association recorded 14 state-level utility-led middle-mile projects in 2024, up from six in 2022. Alabama Fiber Network illustrates the model, leasing 400 Gbps open-access channels to ISPs across 38 counties. Utility involvement shortens permitting cycles as power easements are already secured, shifting the economics in favor of dark fiber over microwave relays for rural backhaul. Given the long asset lives of utility poles, cooperatives favor 20- to 30-year IRUs, which aligns with public subsidy timelines, thereby strengthening rural contributions to the United States' dark fiber network market.
Restraints Impact Analysis*
| Restraint | (~) % Impact on CAGR Forecast | Geographic Relevance | Impact Timeline |
|---|---|---|---|
| High Capital Expenditure Requirement | -1.8% | National, more pronounced in rural/low-density areas | Medium term (2-4 years) |
| Complex Permitting and Right-of-Way Acquisition | -1.2% | Urban areas and environmentally sensitive corridors | Short term (≤ 2 years) |
| Increasing Availability of Virtual Fiber via Wavelength Services | -0.9% | Metro areas with dense fiber infrastructure | Medium term (2-4 years) |
| Supply Chain Volatility in Specialty Fiber Preforms | -0.7% | National, affecting all deployment types | Short term (≤ 2 years) |
| Source: Mordor Intelligence | |||
High Capital Expenditure Requirement
Underground construction averages USD 16.25 per foot nationally, while aerial builds come in at nearly USD 6.49; both figures increased by double digits between 2023 and 2024 due to labor scarcity and resin costs. Labor constitutes more than two-thirds of total spend, stretching project IRR thresholds into the mid-teens. Small regional carriers are struggling to secure financing now that benchmark interest rates hover near 5%, prompting some to consider entering joint ventures or open-access consortia. Longer payback horizons reduce the appetite for speculative builds beyond established data center alleys, curtailing the near-term expansion of the United States' dark fiber network market. Operators have responded by standardizing micro-trenching in sympathetic municipalities, trimming civil works outlays by up to 40% for metro laterals; yet, the aggregate capex barrier remains substantial.
Complex Permitting and Right-of-Way Acquisition
Fiber deployments traverse a patchwork of federal, state, county, and city jurisdictions, each with its own unique environmental and historical review requirements. Pole-attachment make-ready work can cost USD 500-USD 5,000 per pole when relocations are required, and timelines often double in dense downtown districts where underground ducts are congested. The Federal Communications Commission adopted streamlined one-touch-make-ready policies; however, implementation varies, leaving carriers to negotiate numerous bilateral arrangements. Environmental impact analyses along wetlands or tribal lands prolong the construction of long-haul corridors, deterring routes that could relieve congestion along Interstate-heavy alignments. These administrative frictions suppress the velocity of new dark fiber supply, tempering growth in the United States dark fiber network market until uniform permitting reforms gain traction nationally.
*Our forecasts treat driver/restraint impacts as directional, not additive. The impact forecasts reflect baseline growth, mix effects, and variable interactions.
Segment Analysis
By Fiber Type: Single Mode Holds Dominance but Multimode Gains Short-Reach Favor
Single-mode fiber accounted for a 68.54% market share of the United States' dark fiber network in 2025, as its low-attenuation profile supports 400G-800G coherent optics across trans-regional spans. Hyperscalers sourcing long-haul pipes between Ashburn and Chicago regularly demand 432-fiber-count cables, reinforcing the segment’s primacy. Suppliers have shortened lead times on bend-insensitive G.657.A2 variants, spurring adoption for metro laterals as well. Multimode fiber, although smaller in aggregate value, is projected to achieve a 9.67% CAGR through 2031, driven by the growth of AI clusters within data halls, where a 50-meter reach is sufficient.
The power savings of multimode transceivers, estimated at 1-2 watts below comparable single-mode pluggables, translate into measurable opex relief for facilities running tens of thousands of GPUs. New IEEE 802.3db specifications targeting 200G links further brighten the outlook. Conversely, the sharp uptick in single-mode strand count per route underwrites steady revenue expansion, ensuring the United States dark fiber network market size benefits from both categories.


By Network Type: Metro Supremacy with Long-Haul Ascending
Metro rings held 64.58% of 2025 spending because carriers must interconnect dense clusters of data centers, small cells, and enterprise POPs within sprawling conurbations like Dallas-Fort Worth and Northern New Jersey. Municipalities encourage conduit sharing through dig-once ordinances, lowering entry barriers for competitive providers leasing metro dark pairs. Long-haul, however, will log the fastest 9.64% CAGR as AI workloads push overflow traffic toward power-rich secondary markets such as Omaha and Des Moines.
Projects like Ziply Fiber’s 400G Northern Link illustrate the pivot to diversity-rich inter-regional paths, creating incremental demand for new sheath builds over legacy ROWs. With hyperscalers often insisting on at least three unique physical routes, carriers willing to shoulder capex find receptive anchor tenants. Consequently, both segments contribute to the growth trajectory of the United States' dark fiber network market.
By End User: Telecommunications Lead, Public Sector Accelerates
Telecommunication service providers represented 47.11% of the United States dark fiber network market size in 2025, leveraging expansive footprints to wholesale unlit strands to mobile operators and large enterprises. Competitive dynamics prompt incumbents to overbuild legacy copper corridors with high-count cables in an effort to stave off challengers offering flatter pricing models. Government and public agencies, catalyzed by Broadband Equity, Access, and Deployment funding, will grow the fastest at an 8.41% CAGR, channeling grant dollars toward county-wide middle-mile rings and anchor-institution laterals.
Beyond BEAD, defense and homeland security initiatives mandate dedicated, private fiber for classified traffic, further elevating demand. Electric utilities, universities, and health networks round out the segment mix, each valuing the deterministic performance that dark fiber affords. This expanding diversity of customer verticals reinforces resilience within the United States dark fiber network market.
By Application: Communication Services Dominate While Security-Driven Uses Surge
Communication services accounted for 34.12% of 2025 revenue, encompassing carrier-grade voice, IP transit, and wholesale transport that rely on dark fiber for scale economics. The rise of 800G coherent pluggables allows incumbents to light additional lambdas on decades-old glass, stretching asset life and augmenting sellable capacity. Secure networks and storage will post the strongest 8.52% CAGR as zero-trust postures drive agencies and Fortune 500s to segregate data flows physically.
Dedicated fiber linking sovereign cloud regions or disaster-recovery vaults sidesteps shared infrastructure risks, a priority underscored by recent ransomware incidents against health systems. IoT backbones for smart grids and traffic-signal synchronization add niche but fast-growing bandwidth pockets. The multiplicity of use cases ensures steady utilization rates, a key factor for long-horizon investments in the United States' dark fiber network market.
Geography Analysis
The South held a commanding share of 2025 revenue thanks to pro-business regulations, abundant land for hyperscale campuses, and legacy carrier hotel density in Atlanta and Northern Virginia. Utility cooperatives expedite aerial deployment along distribution lines, compressing build cycles for last-mile laterals. Dallas-to-Houston corridors also benefit from oil-and-gas telemetry backhaul, which leases dark strands for latency-sensitive SCADA loops.
Growth momentum is shifting westward. The West is expected to log a better growth rate through 2031 as Silicon Valley, Reno, and Phoenix absorb AI cluster spillover from saturated eastern hubs. Nevada’s 2,500-mile open-access middle-mile network exemplifies state-backed initiatives that pair wholesale dark fiber with attractive IRU terms, luring cloud providers seeking desert-sited campuses with renewable power. Mountainous terrain inflates per-mile buried costs, yet hyperscalers pay premiums for low-latency trans-Pacific routes, justifying capex.
The Northeast and Midwest post steady, mid-single-digit gains. Dense urban duct grids in New York and Boston enable sheath overlays without requiring fresh trenching, thereby keeping the cost per activated mile low. Meanwhile, the Midwest’s role as a cross-continental aggregation zone intensifies; carriers add diverse paths through Minneapolis and Chicago to circumvent overtaxed legacy conduits along I-70. State-led programs, such as Maine’s 530-mile MOOSE Net, confirm the public's appetite for open-access models that expand the total addressable market for the United States' dark fiber network market.
Competitive Landscape
The United States dark fiber network industry exhibits moderate consolidation. Zayo, Lumen, and Crown Castle control many high-fiber-count, long-haul corridors; yet, regional specialists and municipal consortia continue to erode their share in secondary metros. Lumen asserts that replicating its 400,000 route-mile asset base would cost USD 150 billion, underscoring high barriers to entry. Its Private Connectivity Fabric overlays transport with SDN control, bundling on-demand bandwidth and dark fiber IRUs to deepen account stickiness with hyperscalers.
Zayo pursues an aggressive build strategy, adding 5,000 route miles across five new long-haul paths to meet AI-driven capacity requests. This contrasts with Crown Castle’s metro-centric focus, which targets small-cell backhaul and edge-compute clusters in the top 30 markets. Electric-co-op ventures such as Alabama Fiber Network introduce a low-cost model that leverages existing rights-of-way, offering 400 Gbps open-access capabilities that resonate with rural telcos lacking capex for parallel builds.
Supplier dynamics also matter. Corning and Prysmian dominate fiber preforms, while hardware vendors such as Ciena and Cisco hustle to supply 800G-class optics. Deployment partners are increasingly bundling civil works and maintenance, presenting turnkey options to venture funds that are attracted to fiber’s utility-like cash flows. The resulting competitive tapestry maintains a healthy rivalry while avoiding cut-throat pricing, a balance that sustains investment in the United States' dark fiber network market.
United States Dark Fiber Network Industry Leaders
Zayo Group Holdings, Inc.
Crown Castle Fiber LLC
Lumen Technologies, Inc.
FiberLight, LLC
Uniti Group Inc.
- *Disclaimer: Major Players sorted in no particular order

Recent Industry Developments
- March 2025: Lumen Technologies secured a USD 500 million commitment from institutional investors to speed AI-focused fiber construction, targeting 2,000 new route miles by 2026 along key data-center corridors and emerging edge-computing hubs.
- February 2025: Crown Castle finalized a USD 180 million expansion that added 850 route miles of 400G-ready dark fiber across three large metropolitan areas, strengthening 5G backhaul and hyperscale data-center connectivity.
- January 2025: The Federal Communications Commission launched a fresh rule-making process aimed at streamlining dark-fiber access and lowering regulatory barriers for wholesale fiber services, acting on findings from its 2024 Communications Marketplace Report.
- January 2025: Zayo Group detailed a plan to deploy more than 5,000 additional long-haul route miles over the next five years to meet surging AI bandwidth needs, citing over USD 1 billion in 2024 AI contracts and a USD 3 billion opportunity pipeline.


United States Dark Fiber Network Market Report Scope
| Single Mode Fiber |
| Multimode Fiber |
| Long-Haul |
| Metro |
| Telecommunication Service Providers |
| Internet Service Providers |
| Enterprises |
| Government and Public Sector |
| Other End User |
| Communication Services |
| Cable Television |
| Data Center Interconnect |
| Secure Networks and Storage |
| Other Application |
| By Fiber Type | Single Mode Fiber |
| Multimode Fiber | |
| By Network Type | Long-Haul |
| Metro | |
| By End User | Telecommunication Service Providers |
| Internet Service Providers | |
| Enterprises | |
| Government and Public Sector | |
| Other End User | |
| By Application | Communication Services |
| Cable Television | |
| Data Center Interconnect | |
| Secure Networks and Storage | |
| Other Application |


Key Questions Answered in the Report
What is the projected value of the United States dark fiber network market in 2031?
The market is forecast to reach USD 1.84 billion by 2031, growing at a 7.65% CAGR.
Which fiber type currently dominates spending?
Single mode fiber holds 68.54% share due to its suitability for long-haul 400G-800G applications.
Which region is expected to grow the fastest through 2031?
The West is projected to expand at an better CAGR as hyperscalers add capacity in Silicon Valley, Reno, and Phoenix.
Why are cloud providers shifting to dark fiber?
Dedicated dark strands lower five-year network TCO by nearly 48% compared with managed wavelength services and improve security.
How are utilities influencing rural fiber deployment?
Electric cooperatives leverage existing pole lines to build middle-mile routes, shortening permitting cycles and supplying open-access dark fiber.
What are the main barriers to new builds?
High construction costs and complex, multi-jurisdictional permitting processes remain the biggest hurdles for prospective entrants.
Page last updated on:


