
Passive Optical Network (PON) Equipment Market Size and Share
Market Overview
| Study Period | 2020 - 2031 |
|---|---|
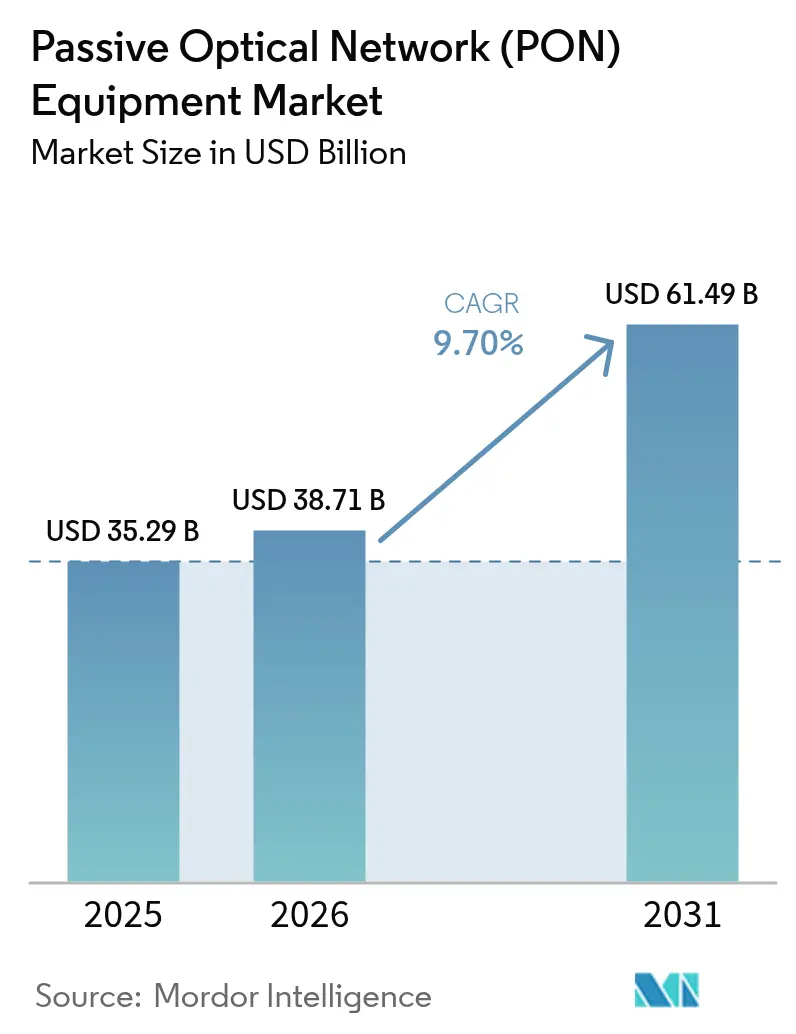
| Market Size (2026) | USD 38.71 Billion |
| Market Size (2031) | USD 61.49 Billion |
| Growth Rate (2026 - 2031) | 9.70 % |
| Fastest Growing Market | Asia Pacific |
| Largest Market | Asia Pacific |
| Market Concentration | Medium |
Major Players-equipment-market/passive-optical-network-(pon)-equipment-market_1591159407616_MP_Passive_Optic_Network_(PON)_Equipment_Market.webp) *Disclaimer: Major Players sorted in no particular order Image © Mordor Intelligence. Reuse requires attribution under CC BY 4.0. | |
Passive Optical Network (PON) Equipment Market Analysis by Mordor Intelligence
The Passive Optical Network Equipment market size was valued at USD 35.29 billion in 2025 and estimated to grow from USD 38.71 billion in 2026 to reach USD 61.49 billion by 2031, at a CAGR of 9.70% during the forecast period (2026-2031). Continued shifts from copper and hybrid fiber-coaxial loops toward all-fiber access, the formalization of 50G-PON specifications, and government-subsidized rural buildouts give the Passive Optical Network Equipment market durable tailwinds. Aggressive XGS-PON upgrade rounds among North American incumbents, sustained FTTR roll-outs in China, and emerging demand for low-latency 5G transport further reinforce growth prospects. Vendors that offer combo-PON line cards, disaggregated OLT systems, and cloud-native management suites are best positioned as operators seek flexibility, power efficiency, and supply-chain resilience. Meanwhile, rising enterprise interest in passive optical LAN and disaggregated OLT platforms broadens the customer base beyond traditional telecom operators, accelerating the Passive Optical Network Equipment market’s opportunity landscape.[1]Federal Communications Commission, “Infrastructure Investment and Jobs Act Broadband Programs,” FCC.GOV
Key Report Takeaways
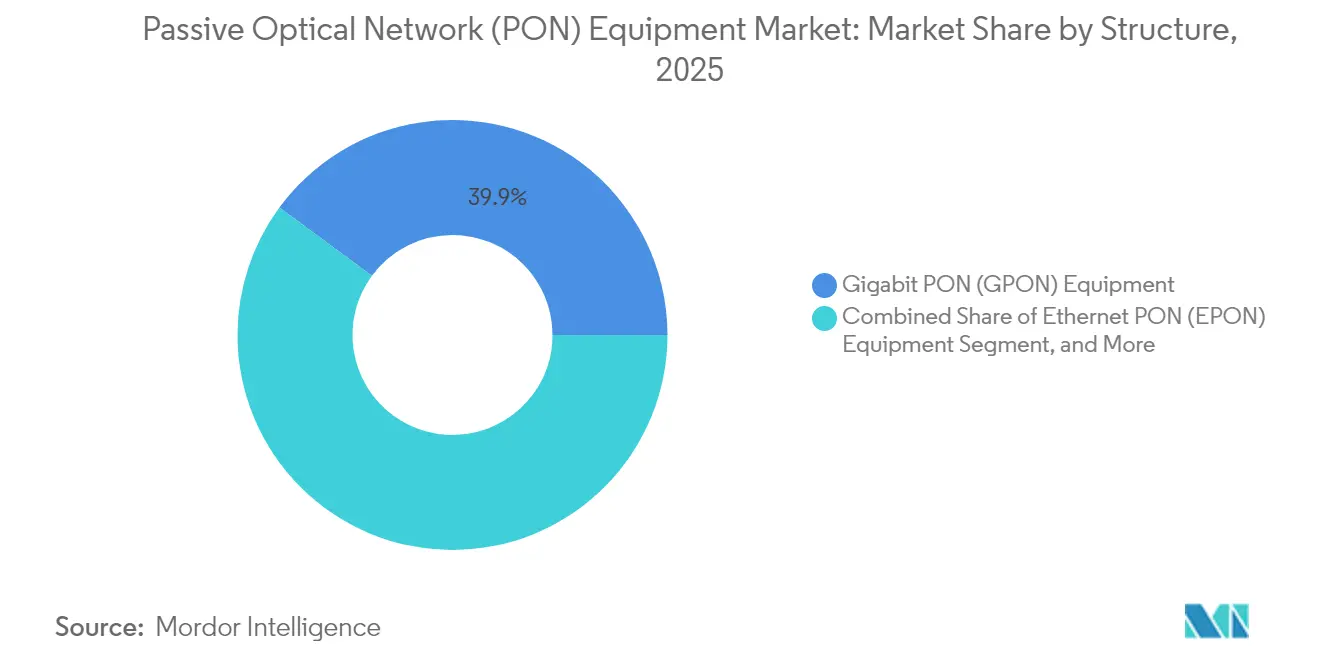
- By structure, GPON led with 39.90% of Passive Optical Network Equipment market share in 2025, while 50G-PON/NG-PON2 platforms are projected to expand at a 10.55% CAGR to 2031.
- By component, OLT systems accounted for 46.05% of the Passive Optical Network Equipment market size in 2025, and ONT units are advancing at an 10.88% CAGR through 2031.
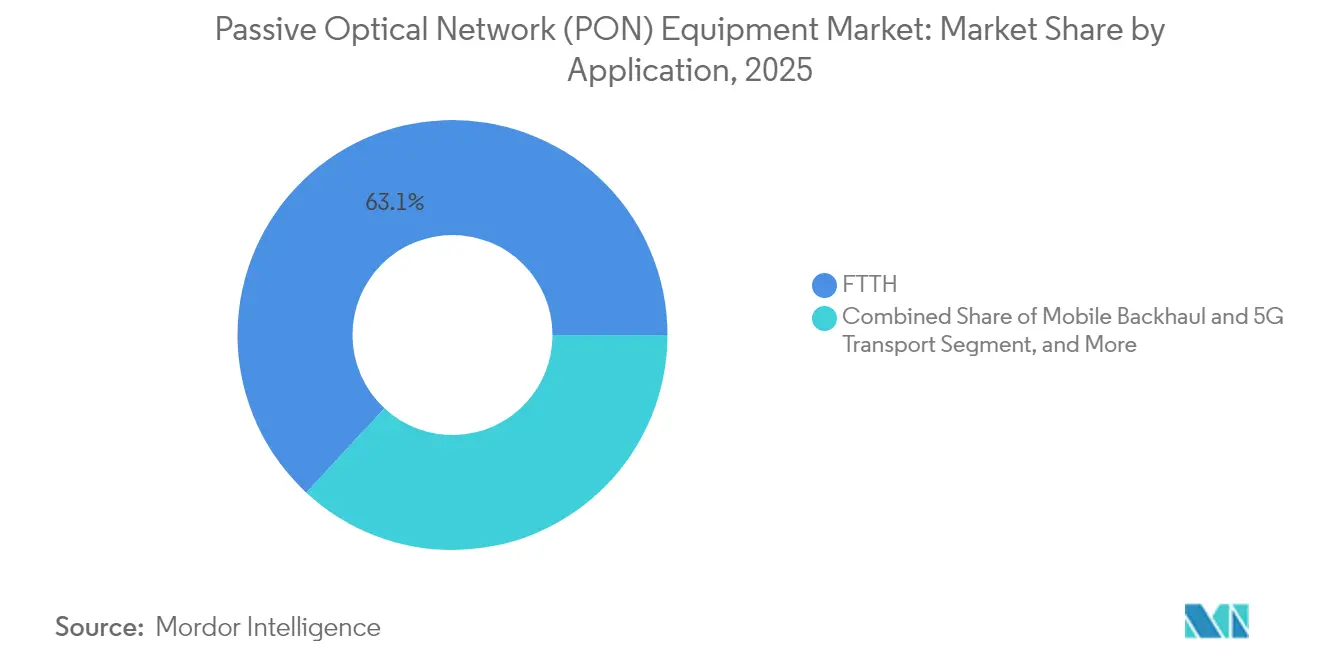
- By application, FTTH captured 63.10% revenue share in 2025 in the Passive Optical Network Equipment market; mobile backhaul is set to grow at an 10.95% CAGR to 2031.
- By end-user, telecom operators retained 70.10% share of the Passive Optical Network Equipment market size in 2025, while enterprises and data centers post the fastest 11.02% CAGR.
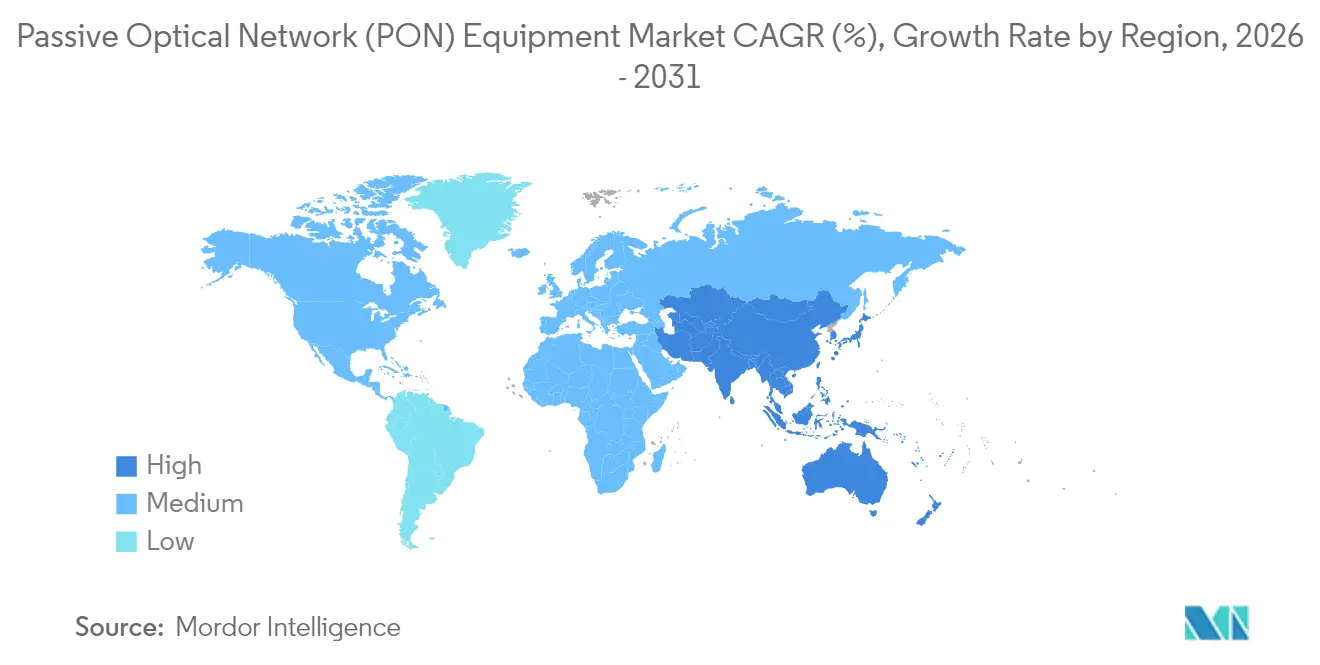
- By geography, Asia Pacific held 38.40% of 2025 revenues in the Passive Optical Network Equipment market and is forecast to register a leading 10.32% CAGR through 2031.
Note: Market size and forecast figures in this report are generated using Mordor Intelligence’s proprietary estimation framework, updated with the latest available data and insights as of 2026.
Global Passive Optical Network (PON) Equipment Market Trends and Insights
Drivers Impact Analysis*
| Driver | (~) % Impact on CAGR Forecast | Geographic Relevance | Impact Timeline |
|---|---|---|---|
| Accelerating XGS-PON upgrades in North America | +2.1% | North America, with spillover to Europe | Short term (≤ 2 years) |
| Government-funded rural FTTH roll-outs | +2.8% | Global, concentrated in North America, Europe, and emerging Asia Pacific markets | Medium term (2-4 years) |
| 50G-PON standardization and early trials | +1.9% | Asia Pacific core, expanding to North America and Europe | Medium term (2-4 years) |
| Energy-efficient "Combo-PON" OLT designs | +1.4% | Global, with emphasis on Europe due to sustainability regulations | Long term (≥ 4 years) |
| Private POL adoption in campuses and data-centres | +1.6% | North America and Europe, emerging in Asia Pacific | Medium term (2-4 years) |
| Rapid uptake of cloud-managed disaggregated OLTs | +1.2% | Global, led by North America | Short term (≤ 2 years) |
| Source: Mordor Intelligence | |||
Accelerating XGS-PON Upgrades Drive North American Modernization
U.S. carriers such as AT&T, Verizon, and Brightspeed have placed XGS-PON at the center of their future fixed-access blueprints, citing symmetric 10 Gbps throughput and combo optics that coexist with installed GPON lines.[2]AT&T Inc., “Fiber Expansion Strategy and Timeline,” ATT.COM Procurement spans chassis, line cards, and ONTs, enabling premium-tier offerings that lift average revenue per user. The Passive Optical Network Equipment market benefits directly because each new fiber location requires both central-office and customer-premises gear. Standardized coexistence optics minimize service disruption during cutovers. Coupled with federal broadband subsidies, the momentum pulls forward capital outlays and cements North America as an early adopter hub.
Government-Funded Rural FTTH Programs Reshape Demand
Public programs exceeding USD 100 billion globally in 2024 moved unserved rural households to the front of fiber deployment queues. Open-access rules and domestic-content clauses favor regional vendors and higher split ratios. Extended-reach optics and hardened outdoor ONTs gain relevance as operators confront long loops and sparse populations. Funding schedules also compress build timelines, propelling order volumes earlier in project cycles. The Passive Optical Network Equipment market therefore sees geographic demand redistribution from dense metros to rural fringes, creating a fresh competitive arena for mid-tier suppliers.
50G-PON Standardization Accelerates Next-Generation Planning
Finalization of the ITU-T G.9804 series provides a stable blueprint for commercial 50G-PON hardware. Field trials in Egypt and South Africa validate 25 Gbps symmetric throughput over legacy ODN, preserving outside-plant investments. Coexistence wavelengths allow operators to upgrade organically as bandwidth thresholds are crossed. The standards align with maturing 25 G optics and DSP advancements that lower cost-per-bit. Consequently, the Passive Optical Network Equipment market prepares for an inflection as operators schedule procurements for 2026 mass roll-outs.
Energy-Efficient Combo-PON Designs Address Sustainability Mandates
Europe’s Energy Efficiency Directive pressures carriers to trim network power draw. Unified line cards able to serve GPON, XGS-PON, and 50G-PON on one port reduce consumption by as much as 35% compared with discrete cards. Dynamic sleep modes and AI-driven load balancing lower watts per subscriber, shrinking opex and carbon footprints. Energy performance thus becomes a formal RFP metric, pushing vendors to sharpen design competitiveness. Over time, efficiency scores influence global buying criteria, raising the profile of suppliers with strong eco-credentials.
Restraints Impact Analysis*
| Restraint | (~) % Impact on CAGR Forecast | Geographic Relevance | Impact Timeline |
|---|---|---|---|
| Short-term XGS-PON ONU supply shortages | -1.8% | Global, most acute in North America and Europe | Short term (≤ 2 years) |
| Skilled-labour scarcity for fibre splicing in developing regions | -2.2% | Emerging markets in Asia Pacific, MEA, and South America | Medium term (2-4 years) |
| Legacy copper/HFC asset write-off risk | -1.5% | North America and Europe, particularly cable MSO markets | Long term (≥ 4 years) |
| Cyber-security concerns around vendor-specific OLT firmware | -1.1% | Global, heightened in government and defense networks | Medium term (2-4 years) |
| Source: Mordor Intelligence | |||
Supply-Chain Bottlenecks Constrain ONU Availability
Global semiconductor imbalances stretch lead times for advanced 10G optics and SoCs, pushing delivery windows for XGS-PON ONUs past one year. Smaller ISPs lacking procurement clout queue behind tier-1 carriers, holdup subscriber activations, and postpone revenue. Some operators hedge by ordering higher-cost combo-PON ONTs, raising bill-of-materials. As geopolitical tensions linger, the Passive Optical Network Equipment market contends with elevated inventory buffers and re-shoring initiatives aimed at stabilizing output.
Skilled-Labor Shortages Slow Fiber Builds
Fiber plant construction in India, Nigeria, and Brazil is hampered by a 40% technician shortfall, reflecting limited training pipelines and high migration of skilled workers. Splicing precision and safety norms require certification, inflating labor costs and elongating project schedules. Vendors that bundle turnkey services and training curricula differentiate themselves. Yet until workforce capacity catches up, the Passive Optical Network Equipment market endures project-timing volatility.
*Our forecasts treat driver/restraint impacts as directional, not additive. The impact forecasts reflect baseline growth, mix effects, and variable interactions.
Segment Analysis
By Structure: Transition Toward High-Capacity Platforms Intensifies
Current revenues reflect GPON’s entrenched footprint, yet operators are strategically funding next-gen platforms. In 2025, GPON captured the largest 39.90% slice of Passive Optical Network Equipment market size. Demand is still healthy for greenfield homes-passed targets, but bandwidth growth curves push carriers to schedule XGS-PON overlays and, increasingly, pilot 50G-PON for dense metros. Vendors that ship combo optics on a single line card help operators balance cost with roadmap certainty, sustaining the Passive Optical Network Equipment market’s multi-standard equilibrium. Over the outlook period, 50G-PON/NG-PON2 equipment scales at a 10.55% CAGR, a pace that recalibrates forecast share mixes by 2031.
Operators leverage wavelength coexistence to run GPON and XGS-PON concurrently, preserving splitters and ONTs until churn aligns with customer upgrade plans. Asia Pacific leads 50G-PON proof-of-concepts, while U.S. providers eye trials starting 2026 to keep ahead of upstream traffic deltas. Policy mandates for symmetrical broadband also steer technology selections. Consequently, the Passive Optical Network Equipment market exhibits a layered architecture path rather than wholesale swap-outs, favoring modular chassis with hot-swappable optics.



By Component: Central-Office Intelligence Drives Revenue Weighting
In 2025, OLT chassis and line cards realized 46.05% of Passive Optical Network Equipment market size, underscoring their pivotal role as aggregation intelligence. Each OLT port serves up to 128 premises, translating to outsized dollar contribution despite lower unit counts. Feature differentiation now centers on open APIs, SDN agents, and AI-powered power scaling, attributes that boost software attach rates inside the Passive Optical Network Equipment market. ONT/ONU shipments rise at an 10.88% CAGR as fiber builds expand footprints and device refresh cycles shorten.
The component landscape tilts toward merchant-silicon designs and pluggable optics, enabling white-box vendors to gain share. Disaggregated OLT architectures decouple control and data planes, allowing operators to source merchant blades and third-party software, a model already proven in data centers. Passive splitters, attenuators, and WDM couplers remain essential but commoditize rapidly, channeling margin pool shifts toward intelligent silicon and control software. As a result, the Passive Optical Network Equipment market rewards suppliers offering end-to-end ecosystems with open interfaces.
By Application: 5G Transport Becomes High-Growth Use Case
FTTH retained a dominant 63.10% share in 2025, yet mobile backhaul emerges as the fastest climber at 10.95% CAGR. Macro-cell densification and small-cell proliferation stress microwave links, propelling fiber access to towers and rooftop sites. Passive optical splitters efficiently feed clustered radios, underpinning new sales for ruggedized OLTs. The Passive Optical Network Equipment market also gains from passive optical LAN roll-outs in airports, healthcare campuses, and manufacturing plants, where simplified layer-one design trims operational overhead.
Smart-city sensor networks, ubiquitous Wi-Fi offload, and V2X corridors hint at future applications that value low latency and symmetrical throughput. Municipalities eye shared fiber corridors that handle civic services and wholesale capacity leases, further widening addressable demand. Over the forecast horizon, diversified applications cushion cyclicality inherent in residential build programs and anchor the Passive Optical Network Equipment market in broader digital-infrastructure budgets.
By End-User: Enterprise and Data Center Uptake Accelerates
Telecom operators remain the primary buyers with 70.10% share in 2025; however, private enterprises and hyperscalers record an 11.02% CAGR as they deploy passive optical LAN inside campuses and adopt PON for rack-level interconnect. Simplified cabling, lower power per port, and centralized management resonate with IT teams seeking leaner footprints. Meanwhile, cable MSOs stagger fiber migration because of legacy DOCSIS amortization timelines, yet early-adopter MSOs already switch greenfield neighborhoods straight to XGS-PON. As enterprises contract directly with equipment suppliers or system integrators, the Passive Optical Network Equipment market diversifies away from carrier capex cycles, fostering smoother revenue line trends.
Geography Analysis
Asia Pacific contributed the largest 38.40% share of 2025 revenues, buoyed by China’s nationwide FTTR push that already counts 30 million subscribers. Regional policies that classify fiber as strategic infrastructure extend tax incentives and low-interest financing, giving domestic vendors scale advantages. India and Indonesia follow China’s template, targeting double-digit home-pass-adds annually through 2030, which sustains double-digit shipment volumes for the Passive Optical Network Equipment market.
North America enjoys a funding-fueled surge as the Infrastructure Investment and Jobs Act allocates USD 65 billion toward broadband builds. Tier-1 carriers accelerate XGS-PON roll-outs to rural and urban fringe areas, while utility cooperatives deploy PON to diversify revenue. Vendor diversification is a salient theme; operators split awards across at least two suppliers to mitigate geopolitical and supply-chain risk. Sustainability metrics, such as watt-per-subscriber and recyclability, now factor into RFP scoring, influencing vendor roadmaps across the Passive Optical Network Equipment market.
Europe maintains steady growth, supported by European Investment Bank loans and an emphasis on green network design. Open-access mandates stimulate wholesale fiber models, encouraging competitive ISPs to rent OLT ports. In emerging MEA and Latin American corridors, governments draft digital-economy blueprints that prioritize fiber backbones, but currency constraints and technician shortages temper near-term volumes. Nevertheless, pilot projects in Gulf Cooperation Council nations showcase gigabit communities that will scale regionally, adding diverse growth legs for the Passive Optical Network Equipment market.

Regulatory Landscape
Regulatory requirements and standards updates continue to shape PON equipment specifications, interoperability, and procurement rules across major regions. In the European Union, the Gigabit Infrastructure Act (Regulation (EU) 2024/1309) creates a structural pull for fiber access infrastructure by requiring fiber-ready physical infrastructure in new buildings and major renovations from February 12, 2026, while also pushing member states to adopt national standards for in-building fiber connectivity by November 12, 2025. These measures expand the addressable installation base for PON-compatible in-building connectivity and increase the coordination needed among builders, access providers, and equipment vendors.
On the standards side, ITU-T updates support multi-generation coexistence planning, including ITU-T G.9804.3 Amendment 2 (March 2024) that refines the PMD layer for 50G-PON and ITU-T G.9807.1 Amendment 1 (May 2025) that provides TC-layer consistency updates for XGS-PON, which in turn influence vendor test plans and operator RFP language. China also strengthened national interoperability alignment via GB/T 44816.1-2024 and GB/T 44816.2-2024, implemented February 1, 2025, covering XG-PON and XGS-PON system interoperability requirements used in domestic deployments. In the United States, BEAD-funded subgrantees face performance testing obligations aligned with FCC methodologies and NTIA thresholds, linking equipment selection and optical budget assumptions to compliance during funded buildouts.
Competitive Landscape
The top five manufacturers controlled roughly 70% of 2024 shipments, signaling moderate concentration. Huawei leads with 31% share, leveraging end-to-end portfolios and in-house optical-component fabrication. Nokia at 14% and Ericsson at 13% emphasize software-defined access and standards leadership. ZTE and FiberHome round out the top tier. Rising vendors such as Adtran, Calix, and CommScope position disaggregated OLTs and open-source control stacks as alternatives, nudging the Passive Optical Network Equipment market toward multi-vendor ecosystems.
Strategic differentiation increasingly centers on supply-chain resilience and cybersecurity assurances. European carriers now ask for SBOM documentation and third-party penetration testing, tilting opportunities toward Western and open-source-friendly suppliers.[4]National Institute of Standards and Technology, “Cybersecurity Framework for Network Equipment,” NIST.GOV In parallel, Chinese vendors hedge geopolitical exposure by expanding manufacturing in Southeast Asia. Partnerships between optical-component specialists and ODM hardware makers accelerate time-to-market for white-box solutions, resetting pricing benchmarks across the Passive Optical Network Equipment market.
M&A activity focuses on vertical integration and software capability expansion. Verizon’s late-2024 acquisition of Frontier’s fiber holdings consolidated purchasing power, while CommScope’s 2025 partnership with Altice Labs introduced cloud-native orchestration atop bare-metal OLTs. Suppliers offering turnkey training, financing, and managed-service overlays cultivate defensible propositions as customers balance capex with operational simplicity. The net result is a competitive arena where scale, openness, and security co-define success trajectories within the Passive Optical Network Equipment market.
Passive Optical Network (PON) Equipment Industry Leaders
ADTRAN, Inc.
Calix, Inc.
Huawei Technologies Co., Ltd.
Mitsubishi Electric Corporation
Motorola Solutions, Inc.
- *Disclaimer: Major Players sorted in no particular order


Market Opportunities and Future Outlook
Near-term whitespace concentrates on multi-generation, standards-aligned platforms that reduce upgrade friction across GPON, XGS-PON, and emerging 25G/50G roadmaps. Operators and vendors increasingly reference formalized specifications, including ITU-T guidance for XGS-PON and 50G-PON, along with ongoing study work within ITU-T SG15 on Very High Speed PON (beyond 50 Gbit/s), which keeps demand focused on modular OLT architectures, coexistence-friendly optics, and software that can manage mixed PON generations at scale. The most addressable opportunity is centered on central-office and hub aggregation upgrades (OLT chassis and line cards) paired with ONT refresh cycles, particularly where operators are balancing supply-chain risk through dual-sourcing and disaggregated procurement approaches.
Publicly funded and program-driven builds continue to shape large tender pipelines. In the United States, BEAD program funding (USD 42.45 billion) supports fiber deployment in hard-to-reach areas and pushes equipment choices that can pass performance testing regimes over time. More concrete procurement and build signals are also emerging in 2026 activity, including Golden State Fiber issuing an RFP (2026-GSCA-RFP-002, July 2026) for PON equipment supply for California deployments, and Nokia being selected by altafiber (January 2026) for fiber expansion in Ohio and Hawaii using 25G PON and multi-gigabit optical solutions. Outside last-mile access, large optical modernization programs, such as Eletronet selecting NEC and Nokia (February 2026) to extend and modernize its network toward 25,000 km total reach with additional routes and edge sites, reinforce adjacent demand for coherent backbone and edge capacity that supports higher-speed PON access rollouts and management-stack upgrades.
Recent Industry Developments
- June 2026: Huawei unveiled multiple AI-optical network products at MWC Shanghai 2026, including a high-density 50G-PON service board. The launch reinforces the vendor push toward higher-density access platforms aligned with 50G-era capacity needs and frames 50G-PON as an access-layer building block for AI-era traffic patterns.
- May 2026: Calix announced an extension of its Calix One platform to support standards-based 50G-PON, highlighting the AXOS E7-2 line card for residential, business, and MDU deployments. This expands upgrade options for operators looking for higher speeds while retaining existing outside plant and operational tooling across mixed PON generations.
- May 2025: ADTRAN and Netomnia completed the United Kingdom's first commercial 50G-PON deployment using the SDX 6400 Series. The deployment moves 50G-PON from trials into a live commercial environment and provides a reference architecture for coexistence-focused upgrades without wholesale access-network rebuilds.


Research Methodology Framework and Report Scope
Market Definition and Coverage
For this study, the market covers revenue earned from passive optical network (PON) equipment used to build and upgrade fiber access networks, from the central office to the customer site. It includes active endpoints and supporting optical elements that enable shared fiber distribution.
Scope exclusions: We exclude civil works and installation services, fiber trenching, and ongoing managed services revenues that sit outside equipment sales.
Segmentation Overview
- By Structure
- Ethernet PON (EPON) Equipment
- Gigabit PON (GPON) Equipment
- 10 G PON / XGS-PON Equipment
- 50 G PON and NG-PON2 Equipment
- By Component
- Optical Line Terminal (OLT)
- Optical Network Terminal (ONT/ONU)
- Wavelength Division Mux/Demux
- Optical Power Splitters and Couplers
- Optical Cables and Passive Connectivity
- By Application
- FTTH / FTTx
- Mobile Backhaul and 5G Transport
- Passive Optical LAN (POL) / Enterprise
- Smart City and IoT Infrastructure
- Other Applications
- By End-User Vertical
- Telecom Operators and ISPs
- Cable MSOs transitioning to fibre
- Enterprises and Data Centres
- Government and Defense Networks
- Other End-User Verticals
- By Geography
- North America
- South America
- Europe
- Asia Pacific
- Middle East and Africa
Data Sources, Market Sizing, and Validation
Desk Research
Desk research helped us set the demand backdrop for fiber builds and upgrades, before the market model was finalized. We mainly used public telecom and broadband indicators, such as the ITU, OECD broadband statistics, FCC broadband data for the US, and national regulator releases in large fiber markets. Standards and rollout direction were checked using sources such as ITU-T and IEEE publications, because PON generations and upgrade paths often change how quickly spending shifts from one technology to another.
We also reviewed company annual reports, earnings transcripts, and investor presentations to understand product mix comments, regional momentum, and pricing direction for access equipment. Where we needed quick cross checks on shipments, trade movement, patents, and public contract activity, we used our paid subscriptions for company financials and intelligence, news and financials, patent databases, import and export shipment-level data, and global contracts and tenders. The desk sources listed here are illustrative, and many other public documents were used to collect, validate, and clarify inputs.
Primary Interviews and Surveys
Primary work focused on validating what is being bought, when upgrades happen, and how budgets are split across PON layers. We spoke with a mix of network operators and service providers, equipment suppliers and channel partners, and technical roles that track OLT and ONT/ONU deployments, as well as passive optical distribution needs. Since this is a global market, our coverage was balanced across key fiber build regions so assumptions could be adjusted where rollout speed and pricing differ.
Distribution of primary research fieldwork respondents
| Company type | Respondent position | Region |
|---|---|---|
| Top tier: 39% | CXOs: 14% | APAC: 41% |
| Mid tier: 44% | Functional/Unit leaders: 32% | EMEA: 36% |
| Smaller Players: 17% | Managers: 54% | Americas: 23% |
Market-Sizing & Forecasting
Our sizing starts with a top-down build where fiber access expansion and upgrade cycles are reconstructed using broadband connection additions, FTTH/FTTx rollout programs, and PON generation transitions at the operator level. Those demand signals are then converted into equipment spending using mix assumptions across OLT, ONT/ONU, and optical distribution parts, followed by price normalization in USD so year to year comparisons stay consistent.
To keep the totals realistic, we corroborated the outputs with selective bottom-up approximations, such as sampled ASP times unit volumes for ONT/ONU, channel checks on OLT chassis and line card attach rates, and supplier side revenue splits by region. Key model inputs included GPON to XGS-PON upgrade timing, port density and utilization at the OLT, subscriber adds that drive ONT/ONU volumes, split ratios that influence passive component intensity, and spending differences between greenfield builds versus overbuild or refresh projects. When a country or application lacked clean public datapoints, gaps were handled by using proxy indicators (fiber homes passed, broadband penetration trend, and operator capex direction), which were then pressure-tested through interviews.
For forecasting, we used scenario analysis anchored on rollout speed and upgrade adoption, because regulatory funding cycles, 5G transport needs, and multi-gigabit service launches can accelerate or delay spending. The final forecast path was adjusted only after expert feedback aligned on pricing erosion and mix shift between legacy GPON and newer 10G and 50G-ready deployments.
Data Validation & Update Cycle
Validation was done in layers so outliers could be caught early and fixed before the final cut. We compared modeled totals against independent signals like operator capex commentary, known fiber build targets, and observed shifts in PON generation adoption, and then investigated any large variances by region or component. If a number moved outside expected ranges, respondents were re-contacted to confirm whether the change was driven by pricing, timing, or a genuine demand swing.
Before sign-off, the work is reviewed in multiple analyst passes, where assumptions, calculations, and unit conversions are checked again for consistency. Reports are refreshed annually, with interim updates when material events occur, and right before delivery we do a final pass to make sure clients receive the latest updated view.
Mordor Intelligence's Passive Optical Network Pon Equipment Market Size Versus Other Published Estimates
Published market sizes for PON equipment often vary because groups define what counts as equipment differently and they do not always treat upgrades and replacements the same way. The year chosen as the starting point also matters, especially when large fiber programs create a temporary spike in OLT purchases or a surge in ONT/ONU volumes.
The benchmark table shows a wide spread mainly because some estimates fold in broader optical access and transmission items, while others count only a narrow set of endpoints. In Mordor Intelligence's model, the 2025 value is tied to defined PON equipment categories across OLT, ONT/ONU, and optical distribution elements, and it is kept aligned with upgrade cadence inputs and USD normalization timing rather than applying a single blended growth factor.
Benchmark comparison
| Source | Market Size | Gaps in Research Methodology |
|---|---|---|
| Mordor Intelligence | USD 35.29 B (2025) | |
| Trade Journal A | USD 19.79 B (2024) | Uses a different base year and appears to emphasize core access gear, which can undercount passive optical distribution elements and the upgrade-driven replacement cycle that lifts spend in active endpoints. |
| Regional Consultancy B | USD 7.54 B (2024) | Likely applies a narrower equipment definition and may exclude parts of the optical distribution network and higher-speed PON upgrade spending, which reduces the addressed revenue pool versus a full PON equipment stack. |
Taken together, the comparison suggests that scope boundaries and base-year timing drive most of the gap, not a single growth assumption. By keeping the model traceable to operator rollout signals, component intensity, and price progression by equipment type, we can explain each step and update it cleanly as new deployment data comes in.


Key Questions Answered in the Report
How large is the Passive Optical Network Equipment market in 2026?
The Passive Optical Network Equipment market size stands at USD 38.71 billion in 2026 with a forecast to reach USD 61.49 billion by 2031.
What is the expected growth rate for Passive Optical Network equipment through 2031?
The market is projected to grow at a 9.70% CAGR during 2026-2031.
Which region leads in Passive Optical Network deployments?
Asia Pacific accounts for 38.40% of global revenue, driven by expansive FTTR and FTTH programs endorsed by public policy.
Which Passive Optical Network technology segment is growing the fastest?
50G-PON and NG-PON2 equipment exhibits the highest 10.55% CAGR owing to rising bandwidth demand and finalized ITU standards.
Why are enterprises adopting passive optical LAN?
Enterprises favor passive optical LAN for simplified cabling, lower power draw, and centralized management versus traditional Ethernet architectures.
Page last updated on:


 Your data is secure and never sold or shared.


