Optical Transceiver Market Size and Share
Market Overview
| Study Period | 2020 - 2031 |
|---|---|
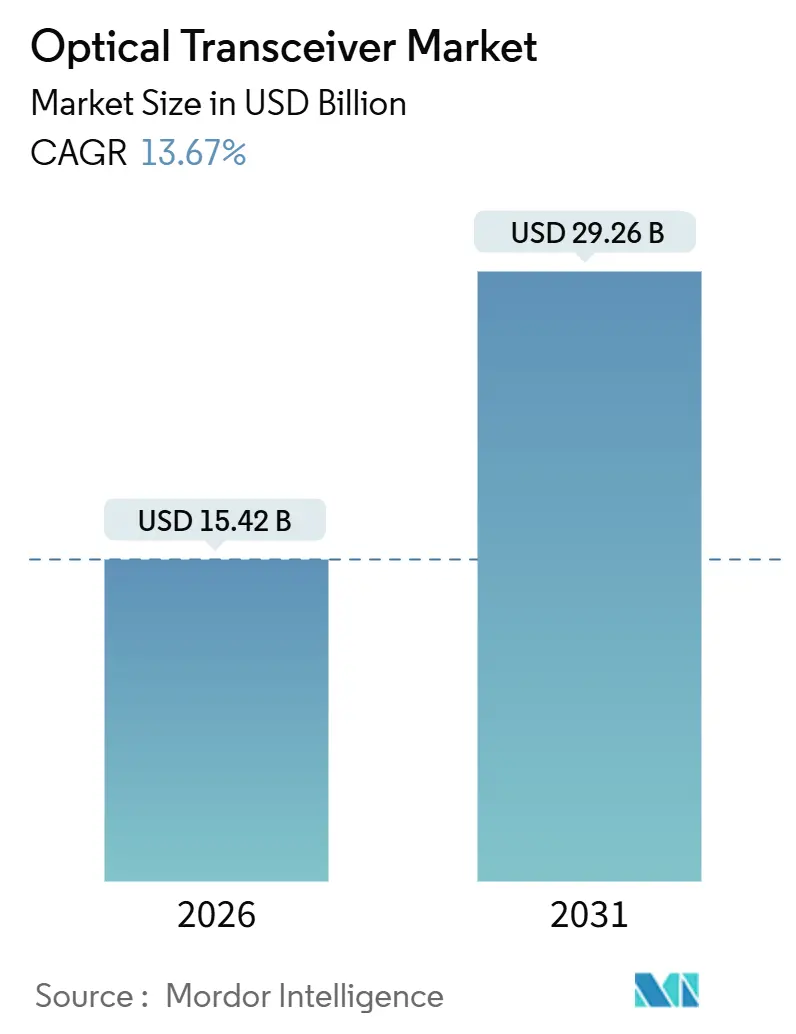
| Market Size (2026) | USD 15.42 Billion |
| Market Size (2031) | USD 29.26 Billion |
| Growth Rate (2026 - 2031) | 13.67% CAGR |
| Fastest Growing Market | Asia Pacific |
| Largest Market | North America |
| Market Concentration | Medium |
Major Players
*Disclaimer: Major Players sorted in no particular order Image © Mordor Intelligence. Reuse requires attribution under CC BY 4.0. |
|
Optical Transceiver Market Analysis by Mordor Intelligence
The optical transceiver market size reached USD 15.42 billion in 2026 and is projected to climb to USD 29.26 billion by 2031, reflecting a brisk 13.67% CAGR. The growing adoption of 400G and 800G Ethernet, the spread of artificial-intelligence clusters, and the rise of edge micro-data centers are reshaping demand patterns. Hyperscale operators are driving volume through dual-sourcing strategies that reward vendors meeting stricter power and thermal budgets. Carrier spending is shifting toward coherent wavelength-division multiplexing that maximizes spectral efficiency on constrained fiber pairs, while enterprise buyers continue incremental upgrades from 10G to 100G links. At the same time, Chinese vertically integrated suppliers are compressing bill-of-material costs by bundling lasers, modulators, and photodetectors on a single substrate, intensifying competitive pressure on incumbents.
Key Report Takeaways
- By protocol, Ethernet led with 45.79% of the optical transceiver market share in 2025, while coherent DWDM modules are projected to expand at a 14.88% CAGR through 2031.
- By data rate, the 100-400 Gbps band captured 39.16% of the market in 2025, while modules above 400 Gbps are set to grow at a 14.69% CAGR through 2031.
- By form factor, QSFP28 and QSFP-DD devices held 38.72% share in 2025, while OSFP packages are on course for a 14.83% CAGR to 2031.
- By fiber type, single-mode optics dominated with 62.37% of the optical transceiver market share in 2025, while multi-mode variants are forecast to advance at a 14.27% CAGR through 2031.
- By reach distance, short-reach modules commanded 45.61% of the optical transceiver market share in 2025, while medium-reach designs are poised for a 14.21% CAGR through 2031.
- By application, data centers led with a 55.82% revenue share in 2025 and are projected to grow at a 14.43% CAGR through 2031.
- By geography, North America accounted for 33.91% of 2025 revenue, while Asia-Pacific is projected to expand at a 14.66% CAGR through 2031.
Note: Market size and forecast figures in this report are generated using Mordor Intelligence’s proprietary estimation framework, updated with the latest available data and insights as of January 2026.
Global Optical Transceiver Market Trends and Insights
Drivers Impact Analysis*
| Driver | (~) % Impact on CAGR Forecast | Geographic Relevance | Impact Timeline |
|---|---|---|---|
| Hyperscale Data-Center Expansion | +3.2% | Global, concentrated in North America and Asia-Pacific | Medium term (2-4 years) |
| Migration to 400G and 800G Ethernet | +3.5% | Global, led by North America hyperscalers | Medium term (2-4 years) |
| 5G Fronthaul and Backhaul Fiber Build-Out | +2.1% | Asia-Pacific core, Europe and Middle East secondary | Short term (≤ 2 years) |
| Growing Cloud AI/ML Clusters Adopting CPO | +2.4% | North America and Asia-Pacific | Long term (≥ 4 years) |
| Temperature-Hardened Modules for LEO Satellites | +0.8% | Global, early adoption in North America and Europe | Long term (≥ 4 years) |
| Rise of Linear Pluggable Optics | +1.7% | Global, strongest in North America data centers | Short term (≤ 2 years) |
| Source: Mordor Intelligence | |||
Hyperscale Data-Center Expansion
Record capital expenditures by Meta, Google, Microsoft, and Amazon Web Services are lifting unit volumes for 400G and 800G modules, as each graphics processing unit in training clusters demands multiple high-speed links.[1]Meta Platforms, “Meta Reports Fourth Quarter and Full Year 2024 Results,” investor.fb.com Operators are standardizing on OSFP packages to unlock additional thermal headroom. Rapid scaling places pressure on suppliers to deliver lower power per bit, which, in turn, accelerates innovation in silicon photonics integration. Inter-availability-zone fabrics that rely on 400ZR and 800ZR coherent interfaces further boost demand for metro-reach pluggables. As hyperscalers move inference workloads closer to end users, short-reach linear optics are also gaining favor to minimize energy draw inside racks.
Migration to 400G and 800G Ethernet
The IEEE 802.3df standard finalized 800 Gbps physical layers, setting the stage for mainstream deployments. Broadcom shipped more than 500,000 800G-capable switch ASICs in 2024, confirming that price points have fallen below key adoption thresholds.[2]Broadcom Inc., “Broadcom Announces Fourth Quarter and Fiscal Year 2024 Financial Results,” investors.broadcom.com The Optical Internetworking Forum’s 800ZR specification allows operators to light 120 km metro spans without external transponders, cutting the total cost of ownership by roughly one-quarter. Early field trials show revenue-grade performance, prompting carriers to pull forward upgrade roadmaps. Module vendors able to package 8 × 100 Gbps electrical lanes and advanced forward-error correction inside an air-cooled envelope are best positioned to win design slots.
5G Fronthaul and Backhaul Fiber Build-Out
China Mobile alone has installed more than 4 million 25 Gbps transceivers for 5G fronthaul links.[3]China Mobile Ltd., “Annual Report 2024,” chinamobileltd.com ITU-T Recommendation G.698.4 defines wavelength parameters for multiplexing 16 radio units onto a single fiber pair, reducing demand for single-mode modules in dense urban corridors. Ericsson and Nokia have both introduced temperature-hardened pluggables that operate from −40 °C to +85 °C, a prerequisite for outdoor radios. In backhaul, 100G and 200G coherent pluggables aggregate multiple cell sites onto fewer wavelengths, reducing amplifier count and fiber leasing costs. The net result is a steady pull for medium-reach optics across Asia-Pacific and emerging markets.
Growing Cloud AI/ML Clusters Adopting CPO
Ayar Labs shipped optical I/O chiplets that bond directly onto compute substrates, eliminating electrical retimers and lowering power budgets by several watts per 100 Gbps. Nvidia’s roadmap signals co-packaged optics on future NVLink fabrics, unlocking 1.6 Tbps per lane and slashing serialization latency. Corning qualified ultra-low-loss multicore fiber with sub-0.15 dB connector losses, safeguarding link budgets inside thermally constrained enclosures. Early hyperscale pilots show a 30% reduction in rack-level energy consumption compared to pluggable alternatives. Successful commercialization is likely to redirect a share of intra-data-center volume away from classic transceiver vendors toward switch and GPU makers.
Restraints Impact Analysis*
| Restraint | (~) % Impact on CAGR Forecast | Geographic Relevance | Impact Timeline |
|---|---|---|---|
| High Power Consumption of greater than 800G Modules | -2.1% | Global, concentrated in North America and Asia-Pacific | Short term (≤ 2 years) |
| CAPEX Burden to Upgrade Legacy Fiber Plants | -1.8% | Europe and South America, secondary in Africa | Medium term (2-4 years) |
| Laser-Diode and DSP Supply Constraints | -1.4% | Global, acute in Asia-Pacific manufacturing hubs | Short term (≤ 2 years) |
| IP Licensing Barriers for Second-Source Vendors | -0.9% | Asia-Pacific and emerging markets | Long term (≥ 4 years) |
| Source: Mordor Intelligence | |||
High Power Consumption of greater than 800G Modules
An 800 Gbps OSFP can dissipate 50 W, and a fully populated top-of-rack switch with eight such modules approaches 800 W, pushing the limits of air cooling. Liquid cooling adds USD 500-1,000 per rack, stretching payback periods for operators on tight budgets. The Open Compute Project set a 15 W per 100 Gbps ceiling, a target that current designs exceed by up to 40%. While linear pluggable optics cut draw to roughly 12 W, their 2 km reach confines them to campus or single-site fabrics. Prolonged qualification cycles, now trending at nine months, slow revenue recognition for smaller vendors.
CAPEX Burden to Upgrade Legacy Fiber Plants
Upgrading from G.652.D to G.654.E fiber can cost USD 50,000-100,000 per route-kilometer in dense urban settings. Several Tier-2 carriers deferred long-haul builds, overlaying an additional 100 Gbps of wavelengths rather than adopting 400 Gbps or 800 Gbps coherent optics. Corning’s retrofit connectors reduce insertion loss by 0.3 dB, extending 400 Gbps reach by up to 30 km, yet they still require service interruptions and field labor. Regulatory price caps in Europe limit carriers’ ability to pass costs to wholesale customers, prolonging the life of older gray optics. The resulting bifurcation favors Tier-1 operators that can fund state-of-the-art coherent gear, widening the technology gap.
*Our forecasts treat driver/restraint impacts as directional, not additive. The impact forecasts reflect baseline growth, mix effects, and variable interactions.
Segment Analysis
By Protocol: Ethernet Dominates, Coherent DWDM Gains Traction
Ethernet accounted for 45.79% of the optical transceiver market share in 2025, reflecting its ubiquity across leaf-spine fabrics and aggregation layers. Coherent DWDM solutions, though smaller today, are forecast to register a 14.88% CAGR through 2031, propelled by metro and long-haul operators extending 400ZR and 800ZR pluggables into production. InfiniBand retains a niche in high-performance computing where RDMA latency is critical, while Fibre Channel evolves to Gen 7 speeds in storage-area networks. Passive optical network modules remain essential in broadband rollouts, particularly where regulators mandate fiber-to-the-home coverage.
Ethernet’s breadth spans 25G campus uplinks to 800G hyperscale backbones, creating economies of scale that depress per-port pricing. Coherent DWDM climbs faster because carriers see spectral efficiency gains of 25-40% compared with discrete transponders. InfiniBand’s roadmap toward 1.6 Tbps EDR maintains a performance moat that justifies premium pricing. Fibre Channel’s carefully staged bandwidth jumps keep backward compatibility for mission-critical SANs. PON optics monetize civil works already sunk into last-mile fiber, giving suppliers a stable revenue stream even as data center spending fluctuates.


By Data Rate: Sub-400G Matures, Beyond-800G Emerges
Transceivers between 100 Gbps and 400 Gbps held a 39.16% share in 2025, underpinned by QSFP28 and QSFP-DD volumes. The optical transceiver market for modules above 400 Gbps is on track for a 14.69% CAGR, aided by IEEE 802.3df and the forthcoming 802.3dj frameworks. Below 40 Gbps, shipments stabilize as enterprises sweat legacy assets rather than undertake wholesale upgrades.
Cost curves for 400 Gbps have fallen sufficiently that some hyperscalers skip 100 Gbps altogether in new halls. Early engineering samples of 1.6 Tbps pluggables appear in 2026 lab trials, leveraging 200 Gbps electrical lanes. At the opposite end, SFP-based 1 Gbps and 10 Gbps modules still ship in millions to industrial and broadband CPE markets. Overall, the optical transceiver market continues its historical cadence of quadrupling bandwidth every five to six years, with silicon photonics and advanced DSPs extending that trendline.
By Form Factor: QSFP Variants Lead, OSFP Accelerates
QSFP28 and QSFP-DD accounted for 38.72% of the market in 2025, thanks to backward-compatible cages and broad switch support. OSFP is the fastest riser with a projected 14.83% CAGR, because its wider housing accommodates greater thermal mass and 8-lane electrical interfaces at 100 Gbps per lane. Legacy CFP formats are receding as DSP integration enables QSFP-DD and OSFP to match the reach once reserved for bulkier modules.
Operators favor QSFP variants for mixed-speed environments that blend 100 Gbps, 200 Gbps, and 400 Gbps ports. OSFP’s superior airflow path makes it the logical choice at 800 Gbps and above. SFP and SFP+ stay relevant in access switches, industrial controllers, and PON ONTs. The optical transceiver market benefits from the coexistence of multiple form factors, ensuring smooth migration rather than disruptive forklift upgrades.

By Fiber Type: Single-Mode Prevails, Multi-Mode Gains in AI Clusters
Single-mode optics captured a 62.37% share in 2025, sustaining long reaches required by campus, metro, and long-haul links. Multi-mode shipments, however, are forecast to rise at a 14.27% CAGR through 2031 as artificial-intelligence pods adopt cost-optimized intra-row connectivity. OM5 wideband fiber supports 400 Gbps over 150 m, aligning with rack-scale architectures inside hyperscale halls.
Single-mode remains non-negotiable for coherent 400ZR and 800ZR spans where chromatic dispersion must be tightly controlled. Multi-mode excels when the reach is under 100 m, and operators prize lower laser costs. Together, they allow data center designers to right-size links by distance, balancing capital expense and operating power.
By Reach Distance: Short-Reach Dominates, Medium-Reach Expands
Short-reach modules below 10 km secured 45.61% share in 2025, driven by leaf-spine fabrics and campus cores. Medium-reach optics with 10-40 km reach are advancing at a 14.21% CAGR as edge micro-data centers link suburban locations with regional aggregation points. Long-reach coherent modules remain indispensable for inter-city and submarine routes where spans stretch beyond 1,000 km.
Linear pluggable optics trim power under 2 km while coherent 400ZR collapses metro stages up to 120 km. Operators thus mix reach classes to optimize cost per transported bit. The optical transceiver market rewards suppliers that offer uniform firmware, diagnostics, and thermal envelopes across all distance tiers.

By Application: Data Centers Lead, Telecommunications Follows
Data centers held a 55.82% share in 2025 and are on course for a 14.43% CAGR through 2031, fueled by AI training clusters that demand full-bisection bandwidth. Telecommunications ranks second as carriers densify 5G sites and upgrade metro cores with coherent DWDM. Enterprise and campus networks are progressing steadily, migrating from 10 Gbps to 100 Gbps as videoconferencing and SaaS workloads grow. Industrial and other uses grow modestly but require ruggedized modules certified for shock, vibration, and extreme temperatures.
Data-center spending patterns now hinge on accelerator attach rates: every GPU added to a pod multiplies optical port counts. Telecom investment is driven by spectrum scarcity, with 800ZR enabling fiber reuse. Campus buyers' time refreshes around multiyear depreciation cycles, offering vendors a steady counter-cyclical revenue stream.
Geography Analysis
North America accounted for 33.91% of 2025 revenue, anchored by hyperscale capital outlays exceeding USD 200 billion across 2025-2026. Meta alone plans to deploy over 1 million GPUs, each tied to multiple 400G or 800G links. Amazon Web Services is qualifying co-packaged optics to trim power by roughly 30%, pushing component vendors toward tighter integration. Tier-1 carriers such as AT&T and Verizon have deployed 400ZR in metro rings, eliminating the need for external transponders and reducing provisioning costs. Canada and Mexico contribute incremental volume through rural broadband mandates and early 5G standalone builds.
Asia-Pacific is the fastest-growing region, with a 14.66% CAGR projection through 2031. Innolight shipped more than 500,000 400G modules in the first half of 2024, underscoring domestic hyperscale demand. Chinese OEMs ramp 800G QSFP-DD ahead of global peers, while Indian operators deploy tens of thousands of 25G fronthaul modules during nationwide 5G rollouts. Japan, South Korea, and Australia press forward with coherent upgrades in core networks, often leapfrogging 100 Gbps stages entirely.
Europe grows at a moderate pace, constrained by wholesale access price caps but bolstered by submarine cable projects that specify 800 Gbps coherent optics. Deutsche Telekom connected 10 million premises to FTTH by year-end 2024, driving demand for XGS-PON transceivers. The Middle East pursues sovereign cloud builds, with UAE and Saudi operators lighting 400G metro rings. South America faces currency pressure yet relies on FTTH deployments in São Paulo and Buenos Aires to sustain PON volumes. Africa remains nascent, with South African and Nigerian carriers prioritizing open-RAN fronthaul optics.
Mordor Intelligence provides coverage of the optical transceiver market across other key regional markets. Detailed country-level analysis extends to Brazil incorporating local coverage and market participation, as required.


Competitive Landscape
The five largest suppliers, Coherent Corp., Lumentum, Broadcom, Accelink, and Innolight, captured roughly 50% of 2025 revenue, signaling a moderately concentrated field. Silicon-photonics leaders exploit captive fabs to compress cycle times for 800G and 1.6 Tbps modules, while vertically integrated Chinese peers leverage scale to price 20-25% below Western incumbents. Hyperscalers mitigate vendor risk by certifying at least three sources per speed grade, forcing challengers to meet identical power, thermal, and reliability targets.
Co-packaged optics threatens the pluggable status quo. Broadcom and Nvidia intend to embed photonics directly on switch and GPU substrates, potentially bypassing transceiver vendors inside racks. Patent cross-licensing shapes competitive entry: royalties can reach 8% of the average selling price for firms outside standards consortia, discouraging smaller contenders. Yet white-space areas such as temperature-hardened LEO satellite links, 50G-PON, and linear pluggable optics remain open to agile innovators like POET Technologies and Credo Technology.
Mergers and partnerships reflect a pivot toward vertical integration. Lumentum’s 2025 bookings show 800G coherent modules eclipsing 100G for the first time, validating its early move into indium-phosphide DSP hybrids. Innolight scales 800G QSFP-DD on the back of domestic wafer capacity, shortening lead times for North American cloud imports. Overall, the optical transceiver market balances cost leadership from Chinese entrants with innovation velocity from silicon photonics pioneers.
Optical Transceiver Industry Leaders
-
Coherent Corp.
-
Lumentum Holdings
-
Broadcom Inc.
-
Accelink Technologies
-
Sumitomo Electric Industries
- *Disclaimer: Major Players sorted in no particular order

Recent Industry Developments
- December 2025: Applied Optoelectronics received a multi-million-dollar order for 800G OSFP modules from a North American hyperscale operator, with first shipments slated for Q1 2026.
- November 2025: Lumentum reported that 800G coherent bookings surpassed 100G orders for the first time.
- October 2025: Corning qualified ultra-low-loss multicore fiber for co-packaged optics, now in field trials with three hyperscale customers.
- September 2025: Innolight shipped 500,000+ 400G modules in H1 2024 and plans volume 800G QSFP-DD production in Q4 2025.


Research Methodology Framework and Report Scope
Market Definitions and Key Coverage
Our study defines the optical transceiver market as all pluggable, board-mounted electro-optical modules across SFP, QSFP, CFP, OSFP, and emerging form factors that convert electrical signals to light and back for data center, telecom, and enterprise links operating on single-mode or multi-mode fiber. Devices embedded inside system-on-chip packages or discrete laser/driver sub-assemblies sold separately from finished modules stay outside this scope.
Modules integrated permanently on switch line cards or passive copper/direct-attach cables are excluded.
Segmentation Overview
-
By Protocol
- Ethernet
- InfiniBand
- Fibre Channel
- CWDM / DWDM
- FTTx / PON
- Other Protocols
-
By Data Rate
- Less than 10 Gbps
- 10 – 40 Gbps
- 40 – 100 Gbps
- 100 – 400 Gbps
- Greater than 400 Gbps
-
By Form Factor
- SFP / SFP+
- QSFP / QSFP+
- QSFP28 / QSFP-DD
- CFP / CFP2 / CFP4
- OSFP
- Other Form Factors
-
By Fiber Type
- Single-Mode
- Multi-Mode
-
By Reach Distance
- Short-Reach (Less than 10 km)
- Medium-Reach (10 – 40 km)
- Long-Reach (Greater than 40 km)
-
By Application
- Data Centers
- Telecommunications
- Enterprise / Campus
- Industrial and Other Applications
-
By Geography
-
North America
- United States
- Canada
- Mexico
-
Europe
- Germany
- United Kingdom
- France
- Russia
- Rest of Europe
-
Asia-Pacific
- China
- Japan
- India
- South Korea
- Australia
- Rest of Asia-Pacific
-
Middle East and Africa
-
Middle East
- Saudi Arabia
- United Arab Emirates
- Rest of Middle East
-
Africa
- South Africa
- Egypt
- Rest of Africa
-
Middle East
-
South America
- Brazil
- Argentina
- Rest of South America
-
North America
Detailed Research Methodology and Data Validation
Primary Research
Mordor analysts held structured interviews with optical component engineers, contract manufacturers, and Asian distributor managers, and we surveyed data center network architects in North America and Europe. Insights from these discussions verified realistic 400 G/800 G ramp rates, regional ASP discounts, and typical module replacement cycles that secondary sources rarely quantify.
Desk Research
We began with public datasets such as ITU optical port statistics, OECD fiber-to-home penetration tables, and TeleGeography bandwidth price trackers, which ground regional traffic and port demand. Standards drafts on IEEE 802.3 and OIF project logs informed protocol adoption timelines, while trade data from Volza outlined cross-border module shipments by speed grade. Company 10-Ks, supplier presentations, and filings captured average selling price (ASP) curves, and filings were cross-checked in D&B Hoovers to validate revenue splits. Subscription feeds from Dow Jones Factiva supplemented news on hyperscale procurements and fab expansions. This list is indicative; many other open and paid sources supported data checks and clarification.
Market-Sizing & Forecasting
A top-down demand pool was reconstructed from installed fiber links and incremental port additions across telecom, colocation, and enterprise networks, then multiplied by verified module penetration and refresh factors. Select bottom-up roll-ups of listed suppliers' optical revenue and sampled ASP x volume checks served as guardrails before totals were aligned. Key variables like hyperscale server rack count, 5Gmid-haul fiber runs, 400 G price erosion, silicon-photonics yield gains, and data center capex drive our multivariate regression forecast through 2030. Gaps in supplier disclosure were bridged by triangulating shipment proxies from customs data and weighted expert inputs.
Data Validation & Update Cycle
Outputs pass variance screens versus TeleGeography capacity growth, MIIT fiber deployment, and quarterly supplier revenue. An analyst team reviews anomalies, and numbers refresh annually, with interim tweaks if chip shortages, new protocols, or macro shocks materially shift demand. Each report is re-checked just before release so clients receive the latest view.
Why Mordor's Optical Transceiver Baseline Commands Reliability
Published estimates often differ because firms pick divergent form-factor mixes, ASP assumptions, or omit fast-growing 800 G shipments.
Key gap drivers include narrower application scope, static ASP curves, or less frequent refreshes that miss rapid price drops. Mordor updates module speeds every six months and folds verified distributor discounts into our base case, whereas others rely on historical averages or extrapolate from small samples.
Benchmark comparison
| Market Size | Anonymized source | Primary gap driver |
|---|---|---|
| USD 13.57 B | Mordor Intelligence | - |
| USD 13.6 B (2024) | Global Consultancy A | Scope omits enterprise campus links; uses uniform 8 % ASP decline |
| USD 12.62 B (2024) | Trade Journal B | Counts only <400 G modules; forecast built on two-year-old port data |
| USD 10.4 B (2024) | Industry Tracker C | Lacks primary checks; derives volumes solely from customs codes |
These comparisons show that once variable visibility, speed class coverage, and refresh cadence are aligned, Mordor's disciplined blend of verified traffic indicators and live price intelligence yields a balanced, transparent baseline that decision makers can trace and replicate.


Key Questions Answered in the Report
What is the current value of the optical transceiver market and its expected growth by 2031?
The market is valued at USD 15.42 billion in 2026 and is forecast to reach USD 29.26 billion by 2031, registering a 13.67% CAGR.
Which protocol segment leads revenue today?
Ethernet leads with 45.79% optical transceiver market share in 2025, supported by widespread use across data-center and campus fabrics.
Why are 800 Gbps modules gaining traction in data centers?
800 Gbps optics align with AI cluster bandwidth needs and, when combined with OSFP form factors, provide the thermal headroom hyperscalers require.
Which region is the fastest-growing consumer of optical transceivers?
Asia-Pacific is projected to expand at a 14.66% CAGR through 2031, driven by hyperscale buildouts in China and 5G fiber rolls in India.
How are power constraints influencing module design?
High draw from 800 Gbps pluggables is spurring adoption of linear pluggable optics and co-packaged approaches that cut watts per bit and ease cooling loads.
What opportunities exist for new entrants?
White-space areas include temperature-hardened LEO satellite optics, 50G-PON for dense FTTH, and linear pluggable modules for short-reach AI fabrics.
Page last updated on:


