Market Overview
| Study Period | 2020 - 2031 |
|---|---|
| Market Size (2026) | USD 14.22 Billion |
| Market Size (2031) | USD 22.74 Billion |
| Growth Rate (2026 - 2031) | 9.84% CAGR |
| Fastest Growing Market | Middle East |
| Largest Market | Asia Pacific |
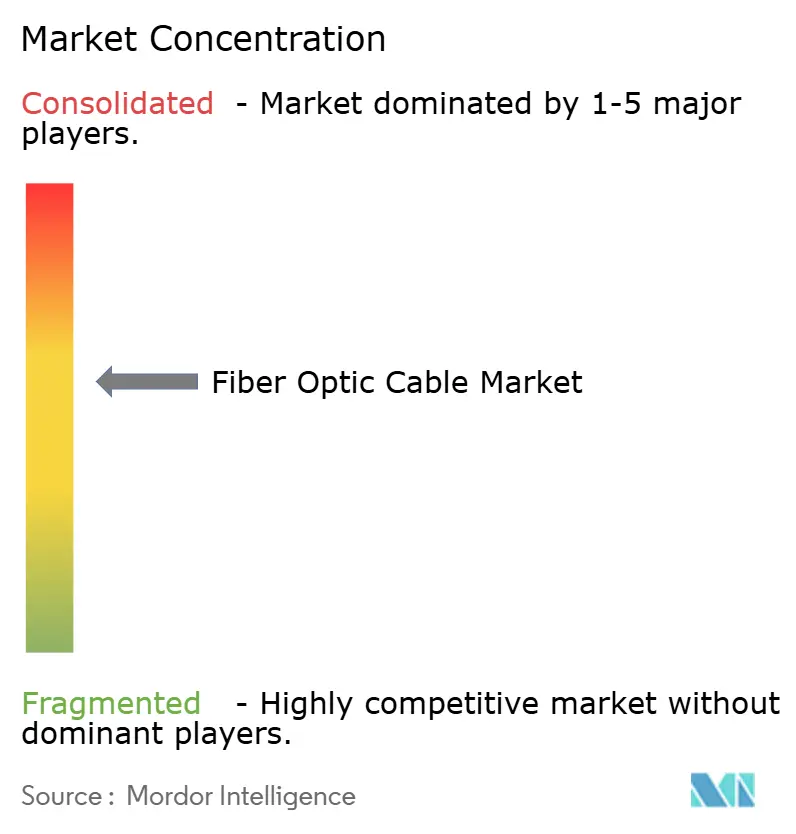
| Market Concentration | Medium |
Major Players *Disclaimer: Major Players sorted in no particular order Image © Mordor Intelligence. Reuse requires attribution under CC BY 4.0. | |
Fiber Optic Cable Market Analysis by Mordor Intelligence
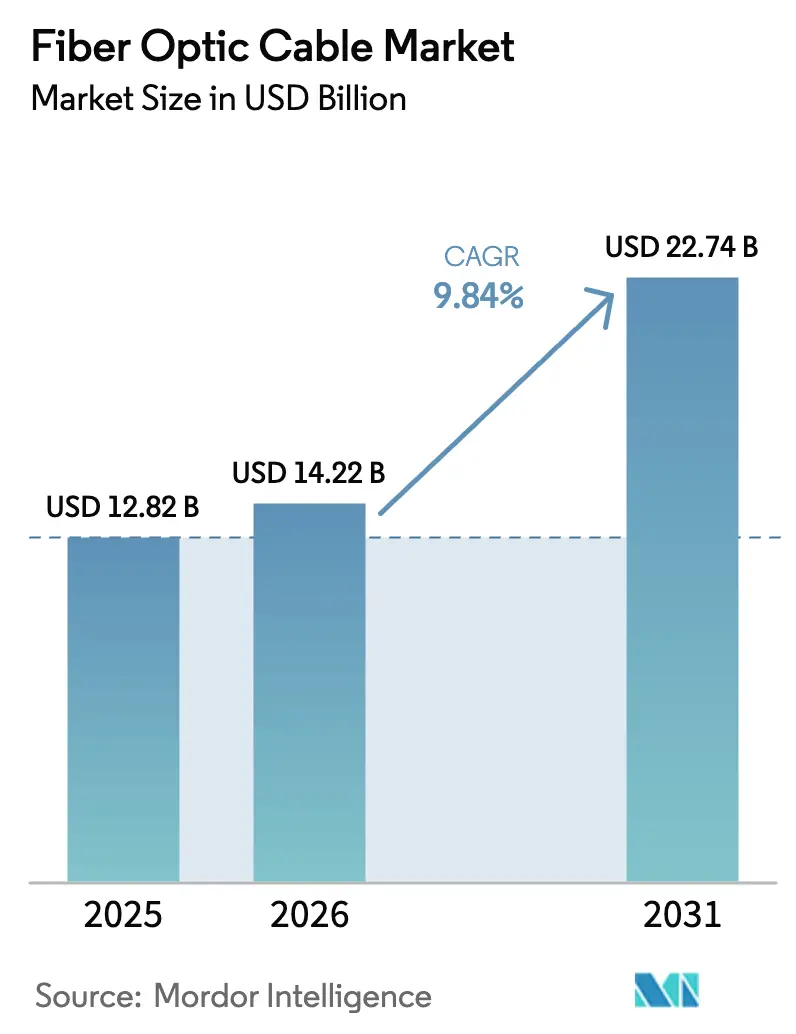
The Fiber Optic Cable Market size was valued at USD 12.82 billion in 2025 and is estimated to grow from USD 14.22 billion in 2026 to reach USD 22.74 billion by 2031, at a CAGR of 9.84% during the forecast period (2026-2031).
Underscoring a steady expansion in data-transport infrastructure worldwide. Rising backbone upgrades for 5G, sustained hyperscale data-center builds, and government-funded rural broadband programs continue to reinforce demand for high-capacity glass fiber links, while steady declines in preform costs improve project economics. Enterprise migration to cloud platforms, smart-grid automation, and low-latency edge workloads are further broadening the use cases, prompting cable makers to scale production footprints and diversify product portfolios. Submarine route diversification for geopolitical resiliency, widespread FTTx mandates, and sustainability goals that favour low-carbon fiber over copper form additional growth layers. Conversely, stubborn civil-works costs in dense metros, helium price swings, and elongated permitting cycles temper near-term momentum but are not expected to derail the long-run trajectory.
Key Report Takeaways
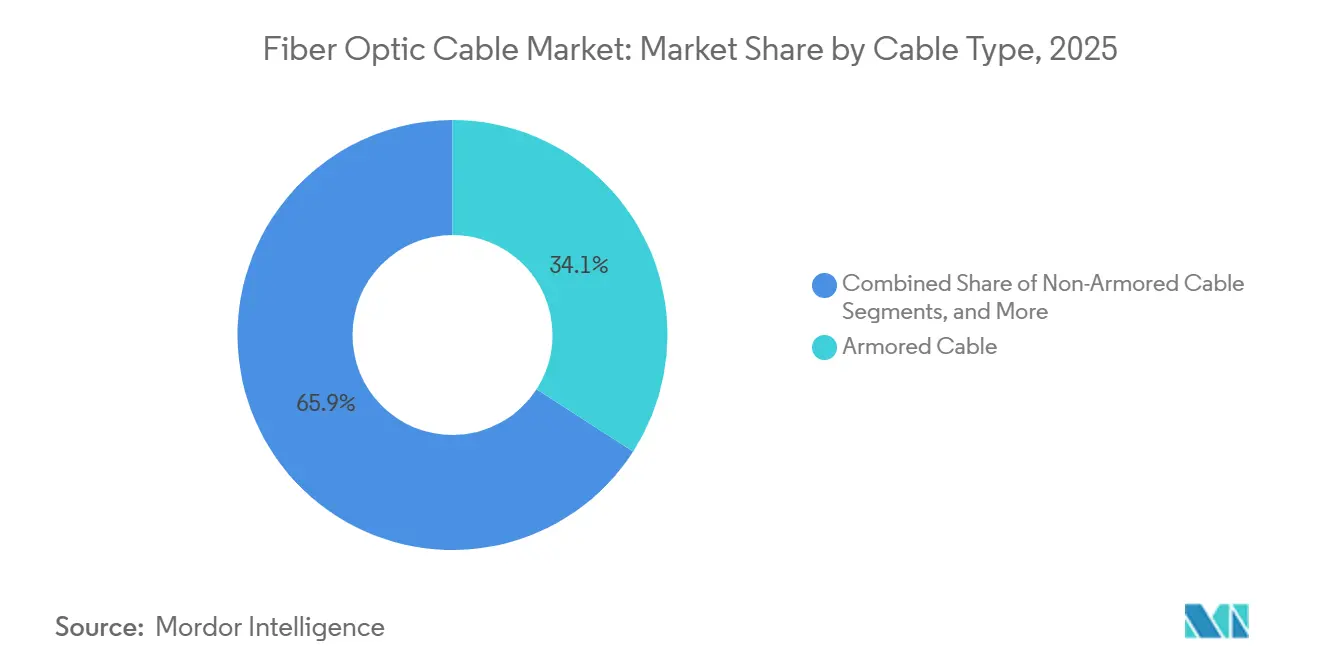
- By cable type, armored products led with 34.11% revenue share in 2025 while ribbon designs are forecast to expand at a 10.58% CAGR through 2031.
- By fiber mode, single-mode accounted for 72.38% of the 2025 fiber optic cable market size, whereas multi-core and few-mode variants are advancing at a 10.21% CAGR.
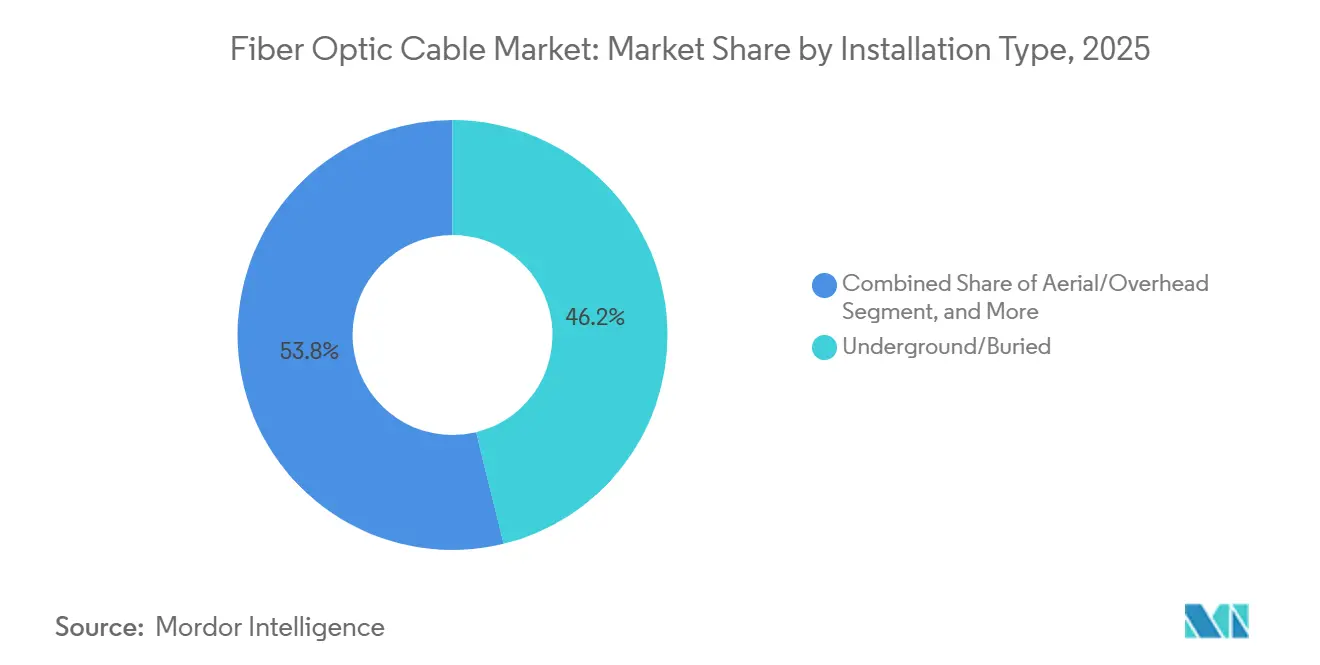
- By installation type, underground and buried links captured 46.19% of global revenue in 2025, yet submarine routes are projected to post the fastest 10.89% CAGR through 2031.
- By end-user industry, telecommunications held 60.23% of 2025 revenue, while data centers recorded the highest 10.57% forecast CAGR, signaling a sharp demand pivot toward hyperscale operators.
- By geography, Asia Pacific commanded 35.84% of 2025 revenue; the Middle East is projected to be the fastest-growing region at a 10.91% CAGR to 2031.
Note: Market size and forecast figures in this report are generated using Mordor Intelligence’s proprietary estimation framework, updated with the latest available data and insights as of January 2026.
Global Fiber Optic Cable Market Trends and Insights
Drivers Impact Analysis*
| Driver | (~) % Impact on CAGR Forecast | Geographic Relevance | Impact Timeline |
|---|---|---|---|
| Increasing penetration of high-speed internet and global data-traffic surge | +2.3% | Global, notably Asia Pacific and North America | Medium term (2-4 years) |
| Accelerated 5G roll-outs and fiber-deep FTTx deployments | +2.1% | Asia Pacific, North America, Europe | Short term (≤ 2 years) |
| Expanding hyperscale data-center interconnect demand | +1.9% | North America, Europe, emerging Asia Pacific hubs | Medium term (2-4 years) |
| Government-backed rural broadband and digital-inclusion programs | +1.6% | North America, Europe, India, Southeast Asia | Long term (≥ 4 years) |
| Sub-sea route diversification for geopolitical resiliency | +1.2% | Asia Pacific, Middle East, Africa | Long term (≥ 4 years) |
| Sustainability push replacing copper with low-carbon glass fiber | +0.7% | Europe, North America, select Asia Pacific markets | Long term (≥ 4 years) |
| Source: Mordor Intelligence | |||


High-Speed Internet Penetration and Data-Traffic Surge
Global IP traffic climbed to 4.8 zettabytes in 2025 and is on pace to exceed 7.2 zettabytes by 2028, overwhelming legacy copper loops and fueling last-mile fiber conversions. Japan’s household fiber penetration surpassed 85% in 2025, prompting operators to pursue fiber-to-the-room retrofits to eliminate in-building bottlenecks.[1]NTT Corp., “1-Petabit Transmission Using 4-Core Fiber,” ntt.co.jp Telkom Indonesia deployed 12 million new fiber drops in 2025, extending reach to suburban zones where mobile networks could not satisfy remote-work bandwidth needs. Preform automation trimmed manufacturing costs by 15% between 2024 and 2025, improving project returns and accelerating network rollouts. Open-access mandates under the European Electronic Communications Code further lower barriers for smaller ISPs, fostering competitive build-outs.
Accelerated 5G Roll-Outs and Fiber-Deep FTTx
Mid-band 5G radios require sub-10-millisecond backhaul latency that only dedicated fiber can supply.[2]GSMA, “5G Backhaul Requirements,” gsma.com China Mobile activated 1.2 million fiber-fed 5G sites in 2025, placing optical plant within 500 meters of each tower. T-Mobile USA’s acquisition of regional metro fiber trimmed leased-dark-fiber costs by 20%, reallocating capital toward rural 5G expansion. Fiber-deep architectures are displacing distributed-antenna systems in crowded downtowns because they remove costly repeaters and simplify operations. Building codes in South Korea and Singapore now specify fiber-to-the-curb as a minimum standard for new housing, locking in steady long-range demand.
Hyperscale Data-Center Interconnect Demand
Hyperscale operators commissioned 180 GW of new data-center capacity in 2025, a 35% jump over 2024, each campus demanding dedicated fiber routes for redundancy and ultra-low latency. AWS activated its Fastnet submarine link in 2025, shaving latency between Virginia and Dublin to below 60 milliseconds. Microsoft’s production deployment of hollow-core fiber on U.K. routes delivered a 30% latency reduction for real-time workloads. Ribbon cables with 3,456 fibers per sheath, commercially unavailable before 2024, are now standard in many new builds, maximizing conduit use and avoiding costly duct upgrades. Data-residency regulations across the European Union and Middle East compel hyperscalers to procure in-region fiber circuits, further lifting regional demand.[3]European Commission, “Electronic Communications Code,” ec.europa.eu
Government-Backed Rural Broadband Programs
The United States Department of Agriculture awarded USD 1.7 billion in ReConnect grants in 2025, prioritizing fiber-to-the-premises deployments in low-income counties. India’s BharatNet connected 250,000 gram panchayats with fiber by end-2025, enabling telemedicine and digital-payment services in previously unserved villages. Australia subsidized fiber links to 1,200 remote communities in 2025, halving per-premises lifecycle costs versus satellite alternatives. The United Kingdom mandated symmetrical gigabit capability for all government-funded builds from 2026 onward, eliminating hybrid fiber-copper architectures. Subsidies open competitive tenders to regional players that can now viably challenge entrenched incumbents.
Restraints Impact Analysis*
| Restraint | (~) % Impact on CAGR Forecast | Geographic Relevance | Impact Timeline |
|---|---|---|---|
| High civil-works cost and right-of-way complexities | -1.4% | Global, acute in North America and Europe metros | Short term (≤ 2 years) |
| Price volatility in raw materials and helium supply constraints | -0.9% | Global, with manufacturing concentration in Asia Pacific | Medium term (2-4 years) |
| Delays in environmental permitting for submarine routes | -0.6% | Coastal zones worldwide | Medium term (2-4 years) |
| Plateauing telco capex in saturated metro markets | -0.5% | North America, Western Europe, Japan, South Korea | Long term (≥ 4 years) |
| Source: Mordor Intelligence | |||
High Civil-Works Cost and Right-of-Way Complexity
Trenching and conduit work represent up to 75% of urban fiber project budgets, and labor shortages pushed New York City permit cycles to an average 14 months in 2025. Micro-trenching, though 40% cheaper, faces opposition in several European cities over road-integrity concerns, forcing operators back to deeper, costlier digs. Aerial deployment is cheaper but pole-attachment fees in the United States rose 12% in 2025, eroding cost advantages. Right-of-way litigation can stall competitive entrants for up to two years in markets that lack clear open-access rules, delaying revenue and inflating interest costs.
Raw-Material Price Volatility and Helium Supply
Helium spot prices soared to USD 15 per m³ in 2025 as the U.S. Federal Helium Reserve neared depletion, raising preform costs.[4]Bureau of Land Management, “Helium Reserve Status,” blm.gov Japanese and Chinese makers boosted helium-recovery rates and adopted nitrogen blends to cut consumption by 20%. Polymer jacket compounds mandated by IEC fire-safety codes rose 8-10% in 2025, compressing assembler margins. Prysmian’s 2024 preform acquisition in North America provided insulation from spot-helium spikes, a strategy smaller rivals cannot easily replicate.
*Our forecasts treat driver/restraint impacts as directional, not additive. The impact forecasts reflect baseline growth, mix effects, and variable interactions.
Segment Analysis
By Cable Type: Density Prioritized Over Ruggedness
Armored designs held 34.11% of 2025 revenue as offshore wind farms, utility corridors, and subsea links demanded mechanical protection, securing the largest fiber optic cable market share for ruggedized products. Ribbon architectures, however, are forecast to expand at a 10.58% CAGR, well above the overall fiber optic cable market, as data-center operators chase splice-time savings and conduit-fill efficiency. Corning’s rollable ribbon enables 3,456 fibers within a 2-inch duct, a game-changer for congested metro pathways. Mass-fusion splicing trims labor hours by 70%, a critical metric amid chronic technician shortages, while bend-insensitive single-mode glass reduces break risk during high-density pulls.
Beyond hyperscale environments, ribbon designs are winning rural projects where contractors prefer time-compressed builds financed by tight-deadline grants. Meanwhile, armored variants remain irreplaceable undersea and in harsh terrains; Nexans supplied 450 km of double-armored cable to the North Sea Wind Power Hub in 2025 to withstand trawler strikes and seabed abrasion. As a result, the fiber optic cable market size for armored lines will keep expanding, though at a slower rate than high-density ribbon.


By Fiber Mode: Single-Mode Reigns While Multi-Core Gains Mindshare
Single-mode maintained 72.38% of global shipments in 2025, cementing its status as the workhorse for long-haul, metro, and fiber-to-the-premises projects. The enormous installed base safeguards backward compatibility with legacy transceivers, preserving its large fiber optic cable market share. Research-stage multi-core and few-mode strands, however, are recording a 10.21% CAGR, reflecting operator trials aimed at postponing wavelength upgrades on congested corridors. NTT achieved a 1-petabit-per-second field trial on a Tokyo-Osaka route using 4-core glass in 2025, underscoring the scalability path.
Multi-mode continues to serve short-reach campus links, but 400G and 800G optics increasingly favor single-mode even inside data halls, narrowing multi-mode’s long-term footprint. Plastic optical fiber retains niche roles in automotive lidar and factory automation, prized for electromagnetic immunity despite limited bandwidth. Overall, single-mode will stay dominant through 2031, but spatial-division multiplexing pilots indicate an evolutionary path toward multi-core adoption in ultra-capacity backbones.
By Installation Type: Submarine Routes Accelerate in the Wake of Geopolitics
Underground and buried networks captured 46.19% of 2025 revenue, reflecting city FTTx rollouts and rural builds funded by subsidies. Yet submarine systems, the fastest subsegment, are projected to post a 10.89% CAGR as hyperscalers and sovereign clouds seek redundant ocean paths. Google’s Blue-Raman link, operational in 2025, bypasses Red Sea bottlenecks and delivers 450 Tbit/s of capacity, advancing the fiber optic cable market size for undersea infrastructure. The 45,000 km 2Africa ring equalized wholesale bandwidth costs across 33 countries, illustrating the outsized strategic value of new wet routes.
Aerial runs remain common where pole infrastructure is widespread; India leveraged overhead plant to cut per-kilometer costs to USD 3,000 on BharatNet extensions, one-quarter of underground alternatives. Indoor and drop-cable demand is growing as operators retrofit fiber-to-the-room in multi-dwelling units, adopting bend-insensitive glass that tolerates 5 mm radii without attenuation penalties.
By End-User Industry: Hyperscalers Outpace Telcos
Telecommunications operators, while still accounting for a significant 60.23% of the 2025 revenue, are witnessing a plateau in spending, particularly in saturated metropolitan markets. In contrast, data centers and cloud providers are on an upward trajectory, boasting a robust forecast CAGR of 10.57%. This growth is evident in their expanding inter-region replication and edge-node footprints. Notably, Amazon Web Services (AWS) made a significant move in 2025 by commissioning 28 new clusters, each equipped with dedicated ribbon fiber trunks, underscoring the company's aggressive expansion strategy.
Beyond telecommunications, a diverse array of sectors is driving demand in the fiber optic cable industry. Utilities, defense, industrial automation, healthcare, and oil and gas are increasingly embedding fiber optics into critical applications. These range from smart grids and avionics to process-control loops and real-time medical imaging workflows. Highlighting this trend, German grid operators took a significant step in 2025 by installing 12,000 km of fiber along high-voltage corridors, a move aimed at enabling millisecond-level fault detection.
Geography Analysis
Asia Pacific remained the largest region at 35.84% of 2025 revenue as China’s fiber-to-the-room mandates, India’s BharatNet expansion, and Japan’s in-building upgrades sustained large volume pulls. China Mobile’s deployment of 1.2 million fiber-connected 5G sites underscores the scale advantage enjoyed by the region’s carriers. BharatNet’s village links have reduced average kiosk downtime, reinforcing project ROI and encouraging additional state allocations.
The Middle East ranks as the fastest-growing geography at a 10.91% CAGR to 2031. Saudi Arabia’s NEOM and broader Vision 2030 programs, the UAE’s fiber-to-the-unit mandate, and Egypt’s emerging data-center clusters created 450,000 new fiber premises in 2025. CommScope’s joint venture for a Riyadh assembly plant exemplifies supply-chain localization to serve this demand burst.
North America and Europe exhibit mid-single-digit growth. Saturation in dense metros is balanced by USDA ReConnect grants and Eastern European Gigabit Infrastructure Act projects. Rural U.S. deployments averaged USD 8,500 per premise in 2025, offering lower lifecycle cost than competing wireless or satellite options. South America concentrates in Brazil and Argentina where urban fiber-to-the-building upgrades displace coax networks; Vivo alone added 8 million FTTH lines in 2025.
Africa’s trajectory hinges on new wet cables and inland backhaul corridors. The 2Africa system cut wholesale prices by up to 60%, enabling local ISPs to expand service tiers and stimulating terrestrial build-outs from coastal landing points. Across all regions, the fiber optic cable market benefits from converging policy support for digital inclusion and data-sovereignty requirements.


Competitive Landscape
The market is moderately fragmented. The top five suppliers, Prysmian, Corning, Sumitomo Electric, Furukawa (now Proterial), and YOFC, collectively held roughly 45% of 2025 revenue, leaving ample share for regional specialists. Chinese manufacturers leverage scale and vertically integrated preform capacities to undercut international rivals by 15-20%, prompting Western firms to differentiate via service bundles and specialty designs.
Strategic moves focus on vertical integration and localized capacity. Prysmian’s North American preform acquisition shields the firm from helium volatility, while Corning’s USD 1 billion Arizona plant captures Build America, Buy America premiums. Proterial’s 2025 merger pooled 18% of global preform output, accelerating multi-core research funded at JPY 50 billion (USD 335 million).
Technology partnerships also reconfigure competition. Microsoft’s 2022 purchase of Lumenisity positions hollow-core fiber as a premium low-latency option for cloud interconnects. Patent portfolios around bend-insensitive glass create royalty streams for early filers, imposing cost hurdles on latecomers. Standards-body influence remains a soft power play; firms active in IEC and IEEE working groups shape specifications that align with their manufacturing strengths, establishing durable moats.
Fiber Optic Cable Industry Leaders
Corning Inc.
Sumitomo Electric Industries Ltd
Prysmian Group
Yangtze Optical Fiber & Cable (YOFC)
Furukawa Electric Co. Ltd.
- *Disclaimer: Major Players sorted in no particular order

Recent Industry Developments
- December 2025: ZTT Group launched low-smoke zero-halogen cables compliant with IEC 60332-3 Category C, targeting high-rise and transit-hub installations.
- November 2025: YOFC partnered with Wuhan University on multi-core fiber featuring embedded distributed acoustic sensing, backed by CNY 120 million (USD 16.5 million) in state funding.
- October 2025: Nexans secured ISO 14001 certification for its Halden, Norway submarine-cable plant after cutting water use 30% and eliminating hazardous solvents.
- September 2025: OFS introduced bend-insensitive multimode fiber supporting 400 Gbit Ethernet over 150 m links, aimed at high-density data-center racks.


Research Methodology Framework and Report Scope
Market Definitions and Key Coverage
Our study defines the global fiber-optic cable market as all newly produced glass or plastic core cables, armored, ribbon, drop, subsea, and aerial, that carry digital signals via modulated light for telecom, data center, industrial, energy, and defense uses.
Scope exclusion: Legacy copper wires, active optical transceivers, and other discrete fiber-optic components are left outside our valuation.
Segmentation Overview
- By Cable Type
- Armored Cable
- Non-Armored Cable
- Ribbon Cable
- Other Cable Type
- By Fiber Mode
- Single-Mode Fiber
- Multi-Mode Fiber
- Plastic Optical Fiber
- By Installation Type
- Aerial / Overhead
- Underground / Buried
- Submarine / Under-Water
- Indoor / Drop Cables
- By End-User Industry
- Telecommunications
- Data Centers and Cloud Providers
- Power Utilities and Smart Grid
- Defense and Aerospace
- Industrial Automation and Control
- Healthcare and Medical
- Oil and Gas and Offshore
- Other End-User Industry
- By Geography
- North America
- United States
- Canada
- Mexico
- South America
- Brazil
- Argentina
- Rest of South America
- Europe
- Germany
- United Kingdom
- France
- Italy
- Spain
- Rest of Europe
- Asia Pacific
- China
- Japan
- India
- South Korea
- Rest of Asia Pacific
- Middle East
- Saudi Arabia
- United Arab Emirates
- Turkey
- Rest of Middle East
- Africa
- South Africa
- Nigeria
- Egypt
- Rest of Africa
- North America
Detailed Research Methodology and Data Validation
Primary Research
Mordor analysts next conducted structured interviews with fiber manufacturers, installers, wholesale carriers, and municipal network chiefs across Asia-Pacific, North America, Europe, and the Gulf. These discussions tested assumed rollout speeds, verified average selling prices, and captured on-ground constraints such as trenching permit delays and supply bottlenecks, allowing us to refine adoption curves.
Desk Research
We began with extensive desk work, pulling yearly route kilometer deployments, fiber price indices, and household FTTH penetration from tier-1 public sources such as the International Telecommunication Union, TeleGeography's Cable Map, the OECD Broadband Portal, the Federal Communications Commission, and the International Cable Protection Committee. Company filings, investor decks, and regulatory consultations added shipment volume, capex outlook, and subsidy details that anchor regional demand.
Subscription datasets accessed through D&B Hoovers and Dow Jones Factiva supplied vendor revenue splits, recent contract wins, and macro triggers (for example, spectrum auctions or utility right-of-way tenders). This list is illustrative; many additional open and paid sources fed baseline estimates, validation loops, and clarification checks.
Market-Sizing & Forecasting
The 2025 base value is first built through a bottom-up, top-down blend: route kilometer builds and average price per kilometer totals are reconciled with national import/export logs and reported vendor revenues, which are then stress tested against installed 5G base station counts and hyperscale data center fiber needs. Key model drivers include (1) kilometers of new fiber laid, (2) 5G small cell backhaul density, (3) FTTH household reach, (4) data center interconnect traffic growth, (5) submarine cable kilometers contracted, and (6) quarterly weighted ASP movements. A multivariate regression forecast projects each driver through 2030 using historical cycles and policy pipelines discussed with experts; where bottom-up gaps exist, sampled supplier roll-ups guide corrective factors.
Data Validation & Update Cycle
Outputs undergo three-layer review: analyst self-audit, senior peer variance checks against exogenous indicators, and a methodology board sign-off. Models refresh annually, with mid-cycle updates triggered by material events, for instance, fiber procurement shocks or major government broadband tenders, so clients receive the latest vetted view before delivery.
Why Mordor's Fiber Optic Cable Baseline Earns Stakeholder Trust
Published figures often diverge because firms choose different cable inclusions, price assumptions, and refresh cadences. Recognizing this, we lock scope to physical cables only, apply transparent driver series, and update every twelve months, ensuring numbers stay current yet stable for planning.
Benchmark comparison
| Market Size | Anonymized source | Primary gap driver |
|---|---|---|
| USD 13.92 B (2025) | Mordor Intelligence | - |
| USD 84.15 B (2025) | Global Consultancy A | Bundles passive components and legacy replacements, relies on single macro scaling factor |
| USD 13.00 B (2024) | Trade Journal B | Earlier base year and no adjustment for 5G acceleration in 2025 |
| USD 15.00 B (2024) | Industry Association C | Uses historical fiber kilometer rollouts without current ASP reconciliation |
The comparison shows that estimates drift when scope widens, years differ, or price paths stay unchecked. By grounding our baseline in clearly defined boundaries, multi-source variables, and timely validations, Mordor Intelligence delivers a balanced, decision-ready market view clients can rely on.


Key Questions Answered in the Report
How large is the fiber optic cable market in 2026 and what is the growth outlook?
The fiber optic cable market reached USD 14.22 billion in 2026 and is forecast to attain USD 22.74 billion by 2031, translating to a 9.84% CAGR.
Which cable type is expanding the fastest?
Ribbon designs are projected to grow at a 10.58% CAGR to 2031 as hyperscale data-center operators prioritize high-fiber-count density and reduced splice labor.
Why are submarine cables gaining momentum?
Geopolitical route diversification, hyperscale self-build strategies, and lower installation costs are driving a 10.89% CAGR for undersea systems through 2031.
Which region holds the largest share and which is growing fastest?
Asia Pacific leads with 35.84% of 2025 revenue, while the Middle East is the fastest-growing region at a projected 10.91% CAGR to 2031.
What is the main restraint facing new fiber deployments?
High civil-works costs and right-of-way complexities, especially in dense urban corridors, remain the foremost barrier, trimming the forecast CAGR by an estimated 1.4%.
How concentrated is supplier competition?
The top five manufacturers control around 45% of global revenue, giving the market a moderately fragmented structure.
Page last updated on:


