On-demand Warehousing Market Size and Share
Market Overview
| Study Period | 2020 - 2031 |
|---|---|
| Market Size (2026) | USD 19.67 Billion |
| Market Size (2031) | USD 39.85 Billion |
| Growth Rate (2026 - 2031) | 15.17% CAGR |
| Fastest Growing Market | Asia Pacific |
| Largest Market | North America |
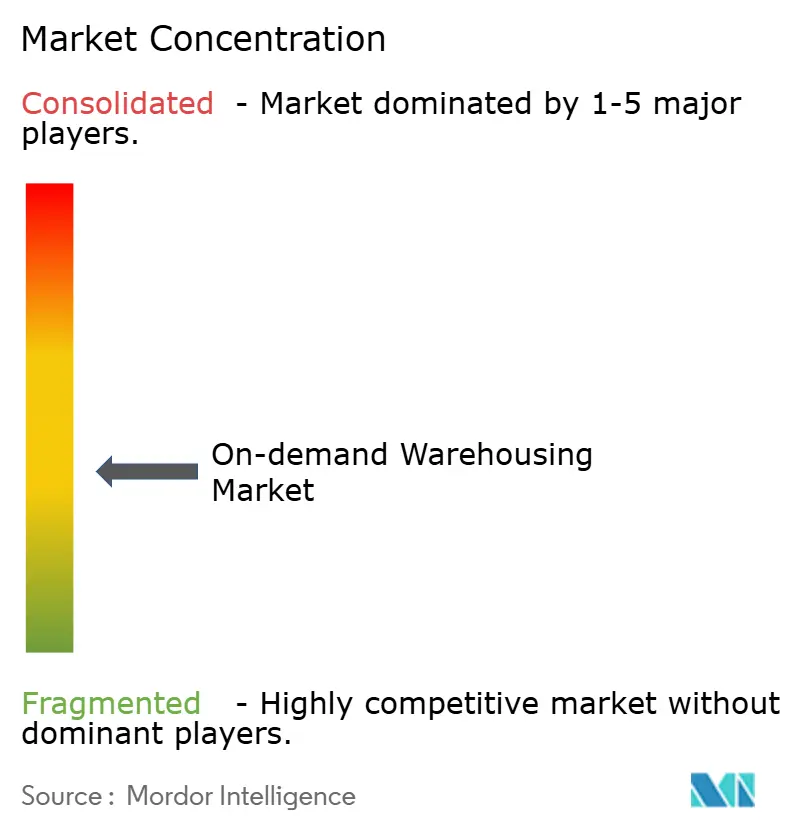
| Market Concentration | Medium |
Major Players *Disclaimer: Major Players sorted in no particular order Image © Mordor Intelligence. Reuse requires attribution under CC BY 4.0. | |
On-demand Warehousing Market Analysis by Mordor Intelligence
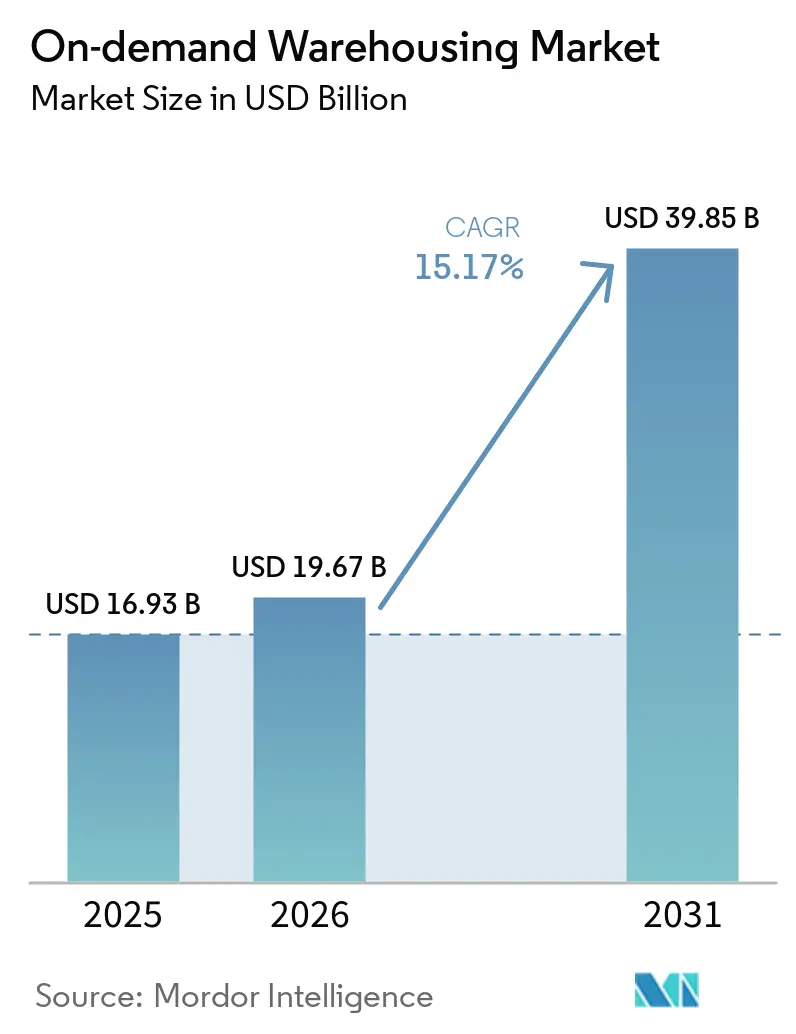
The on-demand warehousing market is projected to expand from USD 16.93 billion in 2025 and USD 19.67 billion in 2026 to USD 39.85 billion by 2031, registering a 15.17% CAGR between 2026 and 2031.
Surging adoption of variable-cost capacity in response to inflation-linked lease volatility, coupled with mandates for post-pandemic resiliency buffers, is keeping demand elevated even as credit conditions tighten. Short-duration contracts now dominate procurement strategies as enterprises seek to hedge against unpredictable occupancy costs while retaining the ability to scale footprints for promotions, seasonal peaks, or supply disruptions. Technology platforms that match micro-seasonal capacity to granular demand forecasts continue to unlock latent space, lowering entry barriers for smaller brands and enabling landlords to monetize idle square footage. Meanwhile, ESG-aligned Scope 3 reporting is pushing firms toward shared facilities that trim carbon footprints through higher utilization levels, intensifying platform network effects.
Key Report Takeaways
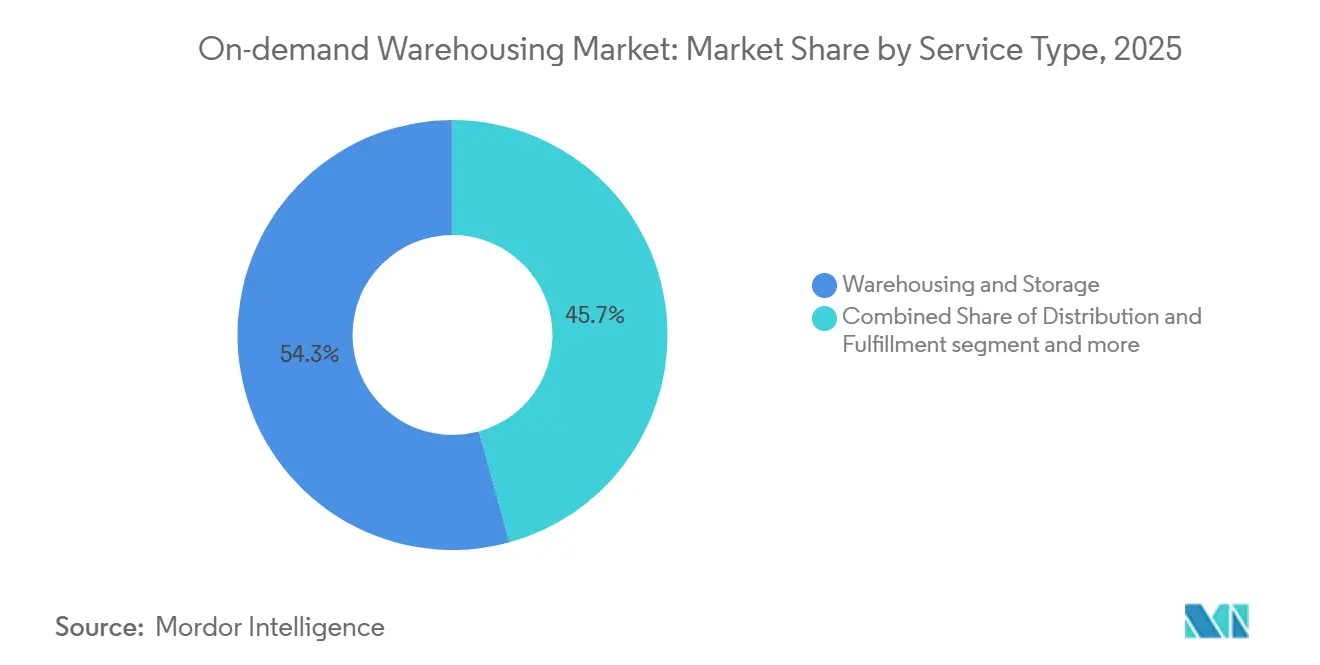
- By service type, warehousing and storage led with 54.28% of on-demand warehousing market share in 2025, while value-added services recorded the highest projected CAGR at 17.80% through 2031.
- By storage duration, short-term storage under one month accounted for 52.11% of the on-demand warehousing market size in 2025 and is advancing at a 16.24% CAGR to 2031.
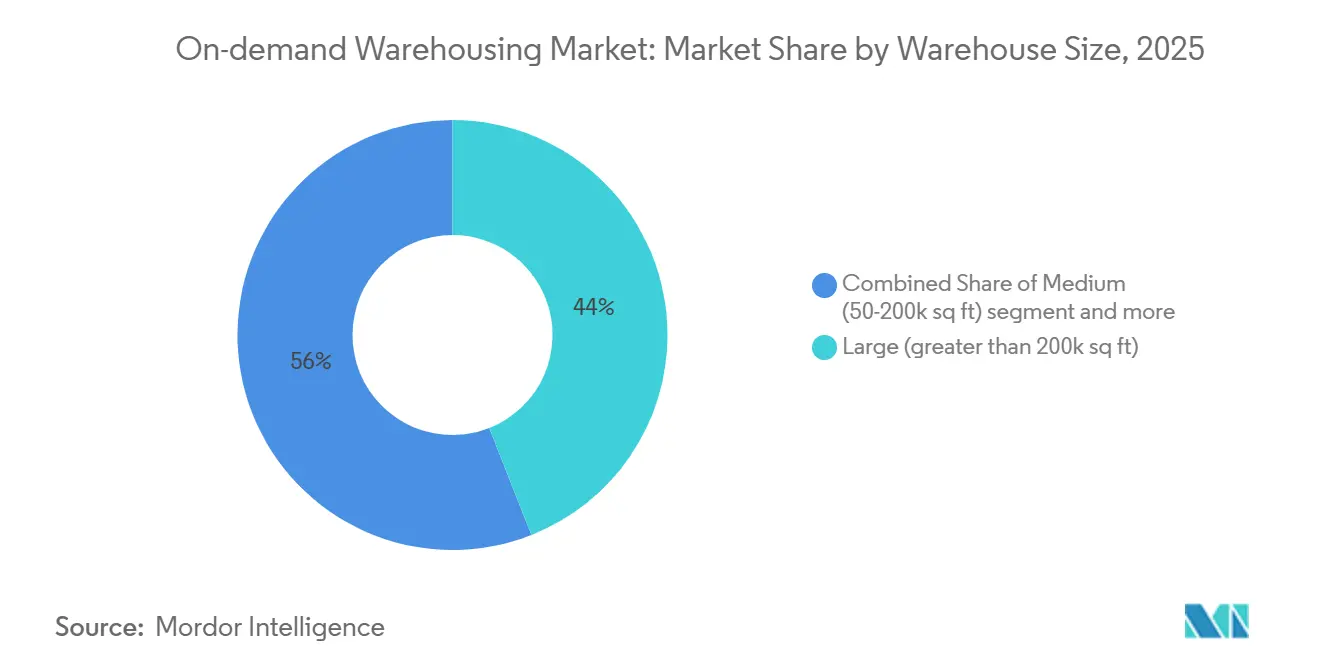
- By warehouse size, large facilities above 200,000 sq ft held 44.02% share of the on-demand warehousing market in 2025; small urban warehouses below 50,000 sq ft are expanding at 16.35% CAGR over the same horizon.
- By industry vertical, e-commerce and retail represented 37.42% of the on-demand warehousing market in 2025, whereas healthcare and pharma show the fastest trajectory at a 19.09% CAGR to 2031.
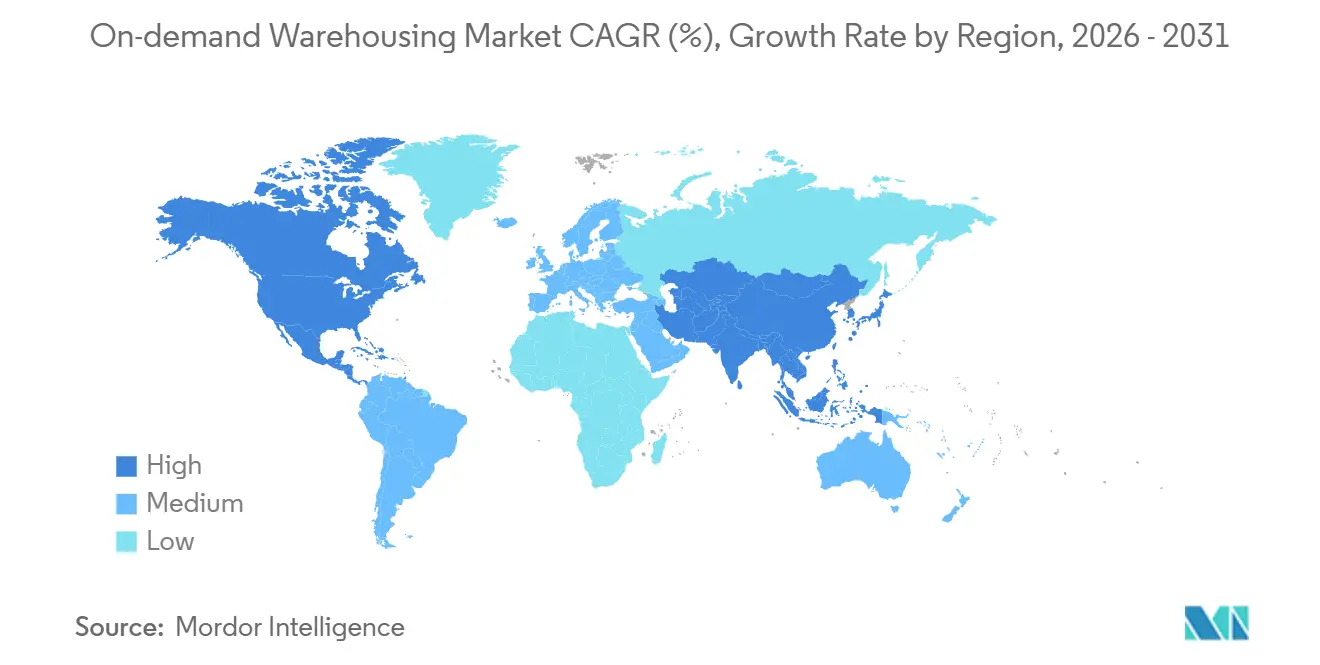
- By geography, North America commanded 35.06% on-demand warehousing market in 2025; Asia Pacific is projected to grow at 17.57% CAGR through 2031.
Note: Market size and forecast figures in this report are generated using Mordor Intelligence’s proprietary estimation framework, updated with the latest available data and insights as of January 2026.
Global On-demand Warehousing Market Trends and Insights
Drivers Impact Analysis*
| Driver | (~) % Impact on CAGR Forecast | Geographic Relevance | Impact Timeline |
|---|---|---|---|
| Post-pandemic resiliency agendas boosting overflow storage | +3.7% | Global, strongest in North America and Europe | Short term (≤ 2 years) |
| Inflation-linked lease-rate volatility incentivizing variable-cost contracts | +3.2% | North America and Europe primarily, emerging in Asia Pacific | Medium term (2-4 years) |
| Accelerated reshoring / nearshoring creating unplanned inventory buffers | +2.9% | North America and Europe core, Mexico and Southeast Asia secondary | Medium term (2-4 years) |
| Retail omni-channel convergence requiring distributed safety-stock nodes | +2.6% | Global urban markets, concentrated in developed economies | Short term (≤ 2 years) |
| Generative-AI demand forecasting enabling micro-seasonal capacity swaps | +2.1% | North America and Asia Pacific technology hubs | Medium term (2-4 years) |
| Scope 3 emission reporting propelling platform-enabled idle-space sharing | +1.8% | Europe and North America early adopters, Asia Pacific following | Long term (≥ 4 years) |
| Source: Mordor Intelligence | |||
Post-pandemic Resiliency Agendas Boosting Overflow Storage
Board-level mandates now prioritize overflow capacity over pure cost efficiency, reflecting lessons from pandemic shortages that cut revenue and eroded brand loyalty. Flexible contracts convert fixed costs into on-demand expenses that activate only during surges, preserving liquidity while protecting service levels. Research found companies with variable capacity recovered 30% faster from disruptions. Demand is strongest in volatile sectors such as consumer electronics and apparel, where stockouts carry steep opportunity costs. The resulting premium for readily activatable space underpins sustained growth in the on-demand warehousing market[1]“Census of Governments,” U.S. Census Bureau, census.gov.
Inflation-linked Lease-rate Volatility Incentivizing Variable-cost Contracts
Escalation clauses have made traditional leases unpredictable, prompting finance chiefs to view flexible warehousing as both an operational and hedging tool. Usage-based pricing closely aligns occupancy cost with revenue cycles, improving margin control in inflationary environments. Landlords contending with rising vacancy risk have begun offering shorter terms, lowering barriers to variable arrangements. These factors collectively channel more volume toward the on-demand warehousing market as firms rebalance fixed and variable cost structures[2]“Census Tract Boundaries and Place-Based Development Programs,” U.S. Department of Housing and Urban Development, huduser.gov.
Accelerated Reshoring / Nearshoring Creating Unplanned Inventory Buffers
Regionalizing production to North America, Mexico, and Southeast Asia increases in-transit and safety stocks during transition phases, demanding temporary staging areas. Reuters reports a surge of manufacturing investment tied to nearshoring that has stretched existing capacity. Short-term contracts provide stop-gap solutions until new networks stabilize, ensuring supply continuity without locking firms into oversized footprints. Automotive and electronics brands are leading adopters given their multiyear plant migrations.
Retail Omni-channel Convergence Requiring Distributed Safety-stock Nodes
Blending store replenishment, e-commerce, and click-and-collect requires inventory positioned closer to shoppers for sub-day fulfillment targets. Distributed micro-warehouses enable same-day delivery while curbing last-mile costs. Retailers using decentralized networks improved turns without harming service levels. As urban zoning tightens, flexible access to infill sites becomes pivotal, amplifying the pull of the on-demand warehousing industry for household-name retailers.
Restraints Impact Analysis*
| Restraint | (~) % Impact on CAGR Forecast | Geographic Relevance | Impact Timeline |
|---|---|---|---|
| Soaring warehouse labor turnover undermining service-level reliability | -2.3% | Global, acute in North America and Europe | Short term (≤ 2 years) |
| Rising insurance premiums for multi-tenant facilities | -1.6% | North America and Europe primarily | Medium term (2-4 years) |
| Bank credit tightening limiting landlord appetite for short-term tenancies | -1.4% | Global, concentrated in developed markets | Medium term (2-4 years) |
| Data-sovereignty laws complicating cross-border WMS deployments | -1.1% | Europe and Asia Pacific regulatory focus | Long term (≥ 4 years) |
| Source: Mordor Intelligence | |||
Soaring Warehouse Labor Turnover Undermining Service-level Reliability
Warehouse operators face a significant challenge with labor turnover, especially when attrition rates exceed 30% annually. Such high turnover not only escalates hiring and training expenses but also heightens the likelihood of errors, ultimately eroding client trust in the reliability of fulfillment networks. In response, operators have turned to offering higher wages and automating repetitive tasks. However, these solutions come with increased overhead costs, potentially diminishing the cost benefits of fixed facilities.
Rising Insurance Premiums for Multi-tenant Facilities
Insurers are raising premiums for multi-tenant facilities, factoring in mixed inventory profiles, higher-value goods, and climate risks, particularly in coastal markets prone to disasters. This pressure compels operators to either absorb the costs or transfer them to clients, potentially squeezing margins or increasing fees. Furthermore, it complicates expansion efforts for on-demand warehousing providers that depend on flexible capacity in these high-risk areas[3]“Legal framework of EU data protection,” European Commission, commission.europa.eu .
*Our forecasts treat driver/restraint impacts as directional, not additive. The impact forecasts reflect baseline growth, mix effects, and variable interactions.
Segment Analysis
By Service Type: Specialized Services Capture Premium Positioning
Warehousing and storage contributed to the on-demand warehousing market size in 2025, equal to 54.28% share, reflecting its role as the sector’s core revenue stream. Yet commoditization is squeezing margins, steering investment toward differentiated offerings such as returns processing, kitting, and custom packaging that command premium rates. Value-added services, while smaller, are slated to expand 17.80% annually through 2031, outpacing basic storage as brands leverage fulfillment experience for competitive advantage. Providers able to integrate WMS, OMS, and reverse logistics seamlessly are winning long-term contracts despite the industry’s preference for flexibility. This specialization raises switching costs for clients and supports tiered pricing that offsets rising labor and insurance expenses[4]“Government access to data in third countries,” European Data Protection Board, edpb.europa.eu. In turn, technology-rich warehouses position themselves as strategic partners during product launches and seasonal promotions, further embedding themselves within client operations.
A second catalyst is the proliferation of direct-to-consumer models that require rapid SKU configuration, subscription box assembly, and hyper-responsive returns handling. These workflows are incompatible with one-size-fits-all facilities, reinforcing demand for niche operators or platform matching of specialized nodes. Consequently, the on-demand warehousing market continues to bifurcate: general capacity providers compete largely on price, while service-rich nodes chase double-digit premium yields. This divergence supports continued consolidation, as scale operators acquire niche specialists to broaden offerings without sacrificing utilization.


By Storage Duration: Liquidity Premium Drives Short-term Preference
Short-term space (≤ 1 month) accounted for 52.11% of the On-demand warehousing market share in 2025, reflecting enterprises’ emphasis on agility over cost savings from longer commitments. AI-driven forecasting tools that reduce safety stocks are driving this shift, enabling brands to book capacity days rather than months in advance, further accelerating the market with a 16.24% CAGR over the forecast period. As pandemic disruptions recede, companies remain wary of over-committing amid uncertain macro demand, favoring liquidity despite higher per-pallet rates. Providers counter volatility through dynamic pricing engines that balance real-time demand with finite dock capacity, mirroring airline yield management models to protect margins.
Medium-term (1-6 months) contracts serve predictable seasonal businesses and account for roughly one-third of the segment, while long-term agreements (over 6 months) trend down as improved inventory visibility weakens the rationale for tying up capital. Nonetheless, durable goods firms that stock strategic buffers against geopolitical shocks still value extended leases within high-automation buildings. Overall, the prevalence of short spans complicates capacity planning but unlocks higher revenue per square foot when managed through sophisticated slotting algorithms, ensuring the on-demand warehousing market maintains its revenue growth momentum even as average contract length declines.
By Warehouse Size: Urban Micro-facilities Command Growth Premium
Facilities exceeding 200,000 sq ft generated 44.02% of the on-demand warehousing market in 2025, capitalizing on scale economies and robotics that slash unit handling costs. Yet urban zoning limits and costly land tilt growth toward micro-sites. Small warehouses below 50,000 sq ft are forecast to grow 16.35% annually through 2031, supported by last-mile delivery imperatives for same-day fulfillment. Retailers targeting two-hour delivery windows increasingly favor dense networks of micro-fulfillment centers, accepting higher rent per square foot in exchange for transport savings and customer satisfaction gains.
Medium-sized facilities (50,000-200,000 sq ft) occupy a sweet spot for regional fulfillment, blending automation feasibility with location flexibility. Developers are experimenting with multi-deck buildings and brownfield conversions to inject capacity into land-constrained metros. In tandem, vertical-lift robotics mitigate ceiling-height limitations, further improving throughput in compact footprints. Collectively, these innovations enable providers to command premium rates for proximity, cementing small sites as the fastest-expanding slice of the on-demand warehousing market.
By Industry Vertical: Healthcare Complexity Drives Specialized Growth
E-commerce and retail contributed 37.42% of 2025 market share, benefiting from explosive online spending and omnichannel models that amplify fulfillment complexity. However, intensifying margin compression spurs retailers to outsource specialized tasks, expanding addressable spend for service-rich operators. Healthcare and pharma, though smaller, are on a 19.09% CAGR trajectory as biologics, vaccines, and personalized medicines demand GDP-compliant, temperature-controlled space with rigorous chain-of-custody documentation. The stakes are high; a single excursion can invalidate millions in inventory, enabling providers to charge price premiums exceeding 25% over ambient storage.
Food and beverage, especially fresh and frozen categories, continue to transition to third-party cold chains that integrate real-time temperature telemetry. Consumer packaged goods leverage the on-demand warehousing industry to pilot new products in regional test markets, minimizing inventory risk. Industrial and manufacturing customers, meanwhile, employ overflow capacity to cushion supply chain reconfigurations associated with nearshoring and component shortages. Across segments, specialized compliance capabilities from FDA registration to hazmat certification emerge as a durable moat that will likely accelerate consolidation as generalists seek acquisitions to enter high-barrier verticals.
Geography Analysis
North America retained 35.06% market share in 2025, but growth moderates amid wage inflation and real estate credit tightening. Strong 3PL ecosystems, dense transportation networks, and widespread WMS adoption underpin continued expansion, yet new zoning restrictions near residential areas elevate development timelines. Insurance premiums in hurricane-prone Gulf Coast and wildfire-exposed Western states add cost pressure, nudging clients toward inland nodes with lower risk profiles. United States corporations increasingly deploy sale-leaseback deals to unlock capital, shifting ownership to REITs that are more open to hybrid lease structures aligned with the on-demand warehousing market model.
Asia Pacific is reflecting a strong 17.57% CAGR as manufacturers diversify beyond China and e-commerce penetration accelerates in India, Indonesia, and Vietnam. Government incentives for industrial parks, coupled with rapid adoption of mobile commerce, spur demand for suburban and urban micro-sites. Multinationals leveraging “China-plus-one” sourcing strategies establish regional hubs in ASEAN, driving transitory storage needs while supply chains recalibrate. Platforms have responded by adding bilingual interfaces and localized payment options, easing onboarding for SMEs across the region.
Europe follows closely, buoyed by robust ESG regulations that favor shared capacity models. However, data-sovereignty rules create integration hurdles, splitting the continent into multiple compliance zones that raise platform operating costs. South America’s momentum stems from nearshoring to Mexico and Brazil’s e-commerce boom, though logistics infrastructure gaps constrain speed. In the Middle East and Africa, large-scale free-zone projects such as Jafza Logistics Park offer modern multi-tenant warehousing, positioning the region as a trans-shipment hub between Asia, Europe, and Africa. Collectively, these diverse dynamics ensure the on-demand warehousing market maintains double-digit global growth despite regional idiosyncrasies.

Competitive Landscape
Three tiers define current competition. First, digital-first platforms such as Flexe, Flowspace, and Stord aggregate idle capacity across independent operators, offering instant quoting and unified SLAs. Their scale depends on data analytics and API integrations that simplify multi-node orchestration. Second, global 3PLs like DHL, GXO, and Amazon Logistics retrofit networks to support variable-term agreements, leveraging deep pockets to automate facilities and extend geographic reach. Third, specialized operators focus on vertical niches cold chain, hazmat, or returns management where domain expertise outweighs footprint breadth.
Strategic moves in 2025 highlight consolidation and vertical expansion. DHL’s USD 2.2 billion commitment to life-sciences hubs fortifies its pharmaceutical moat, while Amazon’s USD 10 billion Southeast Asia build-out pressures regional independents. GXO’s Wincanton acquisition expanded European coverage, and Korber’s purchase of MercuryGate integrated TMS with WMS capabilities, giving clients end-to-end visibility. Partnerships between platforms and property owners proliferate; REITs see higher yields in flexible leasing yet require robust insurance and automation safeguards to mitigate risk.
Technology remains a decisive differentiator. Operators deploying robotics and AI-driven labor planning report 15-25% productivity gains, enabling competitive rates without sacrificing margins. Real-time carbon accounting modules bolster ESG compliance, attracting enterprise contracts with stringent sustainability KPIs. Given these dynamics, the on-demand warehousing market skews toward a moderately concentrated structure, with the top five players controlling just under 40% of global revenue but facing aggressive challengers across niches and geographies.
On-demand Warehousing Industry Leaders
Flexe
Flowspace
Stord
ShipBob
Cubyn
- *Disclaimer: Major Players sorted in no particular order

Recent Industry Developments
- April 2025: DHL earmarked EUR 2 billion (USD 2.2 billion) to expand GDP-certified pharma hubs across the Americas, Asia Pacific, and EMEA.
- March 2025: DP World opened a 64,500 sq ft multi-tenant warehouse in Jebel Ali Freezone, enhancing regional e-commerce support.
- January 2025: Korber, backed by KKR, acquired Mercury Gate for USD 1.5 billion to unify transportation and warehouse management platforms.
- December 2024: GXO completed the GBP 762 million (USD 970 million) acquisition of Wincanton, strengthening the United Kingdom market presence.


Global On-demand Warehousing Market Report Scope
| Warehousing and Storage |
| Distribution and Fulfilment |
| Value-added Services (kitting, returns) |
| Short-term (Less than 1 month) |
| Medium-term (1-6 months) |
| Long-term (More than 6 months) |
| Small (less than 50 k sq ft) |
| Medium (50-200 k sq ft) |
| Large (greater than 200 k sq ft) |
| E-commerce and Retail |
| Consumer Packaged Goods |
| Food and Beverage (incl. Cold-chain) |
| Healthcare and Pharma |
| Industrial and Manufacturing |
| Others |
| North America | United States |
| Canada | |
| Mexico | |
| South America | Brazil |
| Peru | |
| Chile | |
| Argentina | |
| Rest of South America | |
| Asia-Pacific | India |
| China | |
| Japan | |
| Australia | |
| South Korea | |
| Southeast Asia (Singapore, Malaysia, Thailand, Indonesia, Vietnam, and Philippines) | |
| Rest of Asia-Pacific | |
| Europe | United Kingdom |
| Germany | |
| France | |
| Spain | |
| Italy | |
| BENELUX (Belgium, Netherlands, and Luxembourg) | |
| NORDICS (Denmark, Finland, Iceland, Norway, and Sweden) | |
| Rest of Europe | |
| Middle East and Africa | United Arab Emirates |
| Saudi Arabia | |
| South Africa | |
| Nigeria | |
| Rest of Middle East and Africa |
| By Service Type | Warehousing and Storage | |
| Distribution and Fulfilment | ||
| Value-added Services (kitting, returns) | ||
| By Storage Duration | Short-term (Less than 1 month) | |
| Medium-term (1-6 months) | ||
| Long-term (More than 6 months) | ||
| By Warehouse Size | Small (less than 50 k sq ft) | |
| Medium (50-200 k sq ft) | ||
| Large (greater than 200 k sq ft) | ||
| By Industry Vertical | E-commerce and Retail | |
| Consumer Packaged Goods | ||
| Food and Beverage (incl. Cold-chain) | ||
| Healthcare and Pharma | ||
| Industrial and Manufacturing | ||
| Others | ||
| By Geography | North America | United States |
| Canada | ||
| Mexico | ||
| South America | Brazil | |
| Peru | ||
| Chile | ||
| Argentina | ||
| Rest of South America | ||
| Asia-Pacific | India | |
| China | ||
| Japan | ||
| Australia | ||
| South Korea | ||
| Southeast Asia (Singapore, Malaysia, Thailand, Indonesia, Vietnam, and Philippines) | ||
| Rest of Asia-Pacific | ||
| Europe | United Kingdom | |
| Germany | ||
| France | ||
| Spain | ||
| Italy | ||
| BENELUX (Belgium, Netherlands, and Luxembourg) | ||
| NORDICS (Denmark, Finland, Iceland, Norway, and Sweden) | ||
| Rest of Europe | ||
| Middle East and Africa | United Arab Emirates | |
| Saudi Arabia | ||
| South Africa | ||
| Nigeria | ||
| Rest of Middle East and Africa | ||


Key Questions Answered in the Report
How fast is demand for flexible warehouse capacity growing?
Global revenue is projected to rise from USD 19.67 billion in 2026 to USD 39.85 billion by 2031, reflecting a 15.17% CAGR driven by inflation-linked lease volatility and post-pandemic resiliency agendas.
Which service category is expanding quickest?
Value-added services such as kitting and returns processing are advancing at 17.80% CAGR as brands differentiate through fulfillment quality and reverse-logistics efficiency.
Why is Asia Pacific seen as the next growth engine?
Manufacturing reshoring, e-commerce expansion, and government-backed industrial parks are propelling Asia Pacific toward a 17.57% CAGR, the fastest regional pace through 2031.
What vertical presents the highest premium opportunity?
Healthcare and pharmaceuticals command premium pricing due to strict temperature control and regulatory compliance, expanding at 19.09% CAGR through 2031.
How does AI improve warehouse utilization?
Generative-AI forecasting predicts micro-seasonal demand swings, enabling firms to secure short-term space only when needed, lowering carrying costs and boosting utilization for providers.
Are rising insurance costs a major obstacle?
Premiums for multi-tenant facilities are climbing, yet operators are mitigating the hit via automation, enhanced security, and diversified risk pools.
Page last updated on:


