E-commerce Warehousing Market Size and Share
Market Overview
| Study Period | 2020 - 2031 |
|---|---|
| Market Size (2026) | USD 52.14 Billion |
| Market Size (2031) | USD 67.96 Billion |
| Growth Rate (2026 - 2031) | 5.44% CAGR |
| Fastest Growing Market | Asia Pacific |
| Largest Market | Asia Pacific |
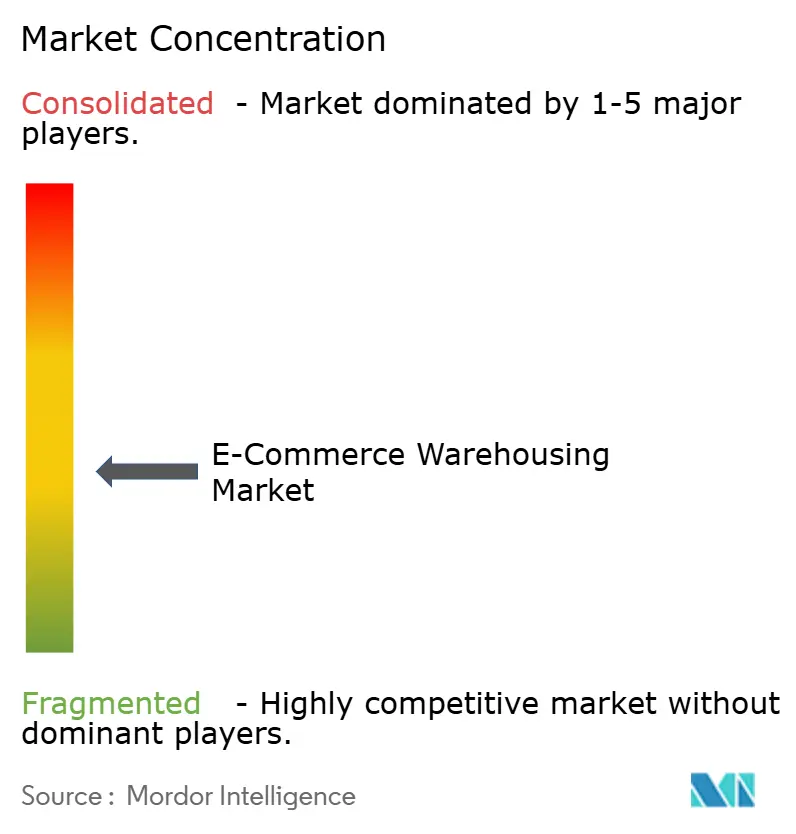
| Market Concentration | Medium |
Major Players *Disclaimer: Major Players sorted in no particular order Image © Mordor Intelligence. Reuse requires attribution under CC BY 4.0. | |
E-commerce Warehousing Market Analysis by Mordor Intelligence
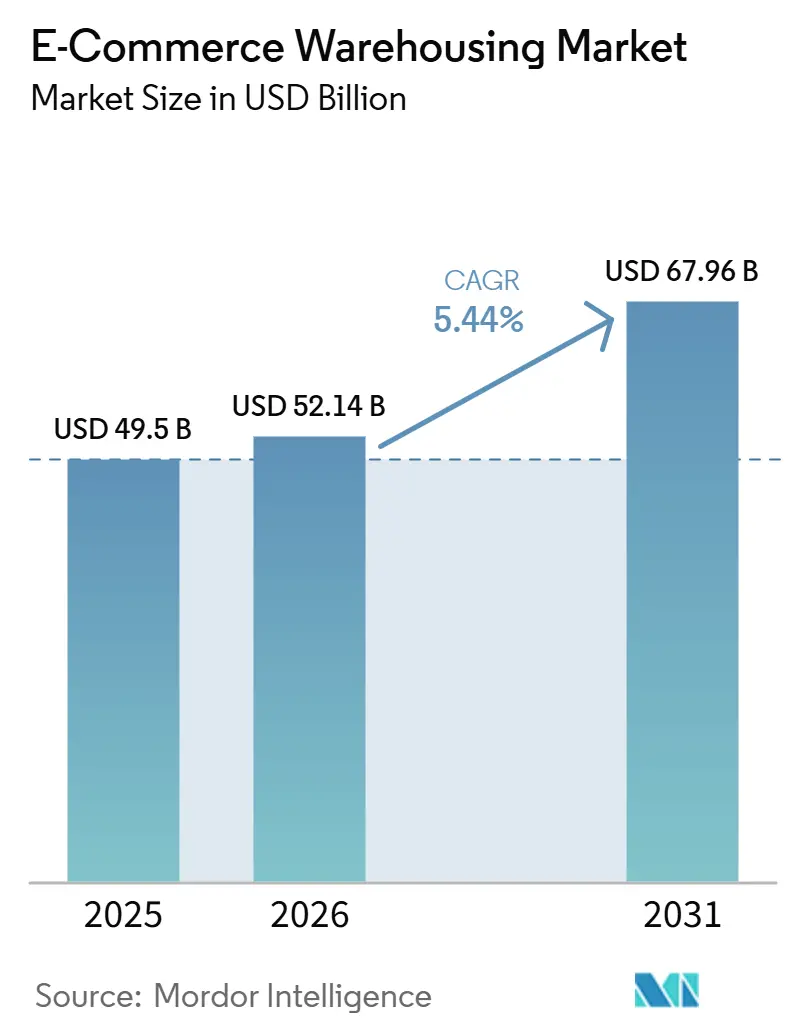
The global E-commerce Warehousing Market size is expected to increase from USD 49.50 billion in 2025 to USD 52.14 billion in 2026 and reach USD 67.96 billion by 2031, growing at a CAGR of 5.44% over 2026-2031.
A steady headline rate hides sweeping shifts as bonded facilities cluster around free-trade zones, direct-to-consumer (DTC) brands demand flexible pop-up capacity, and social-commerce-driven SKU volatility pushes operators toward adaptive automation. Asia-Pacific’s bonded-warehouse buildout supports cross-border platforms, while blockchain verification is drawing high-compliance verticals to third-party sites. Parallel sustainability mandates spur investment in energy-positive buildings, even as cyber-attacks and power-grid gaps threaten uptime. Intensifying competition now hinges more on technology orchestration than raw floor space as incumbents and digital platforms vie for enterprise contracts.
Key Report Takeaways
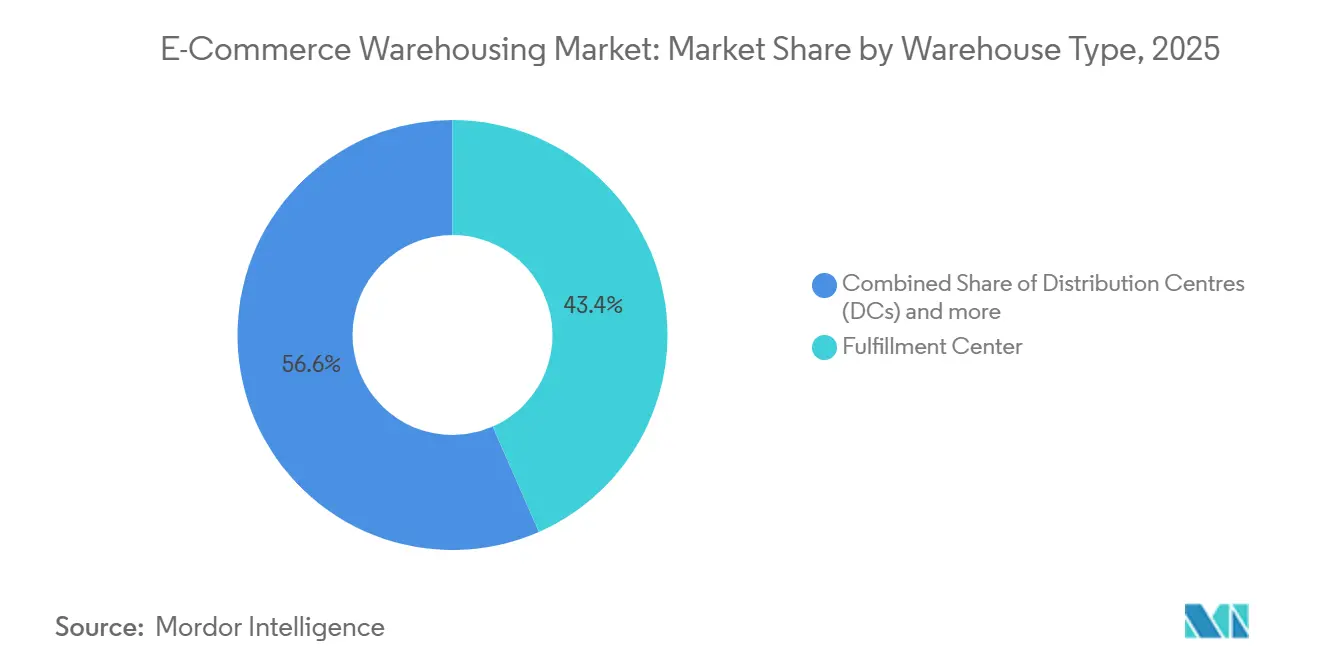
- By warehouse type, fulfillment centers held 43.42% of the global E-commerce Warehousing Market share in 2025, whereas dark stores and micro-fulfillment centers are forecast to expand at a 10.68% CAGR through 2031.
- By service type, storage led with 44.82% of the global E-commerce Warehousing Market size in 2025, value-added services are projected to grow at a 10.15% CAGR to 2031.
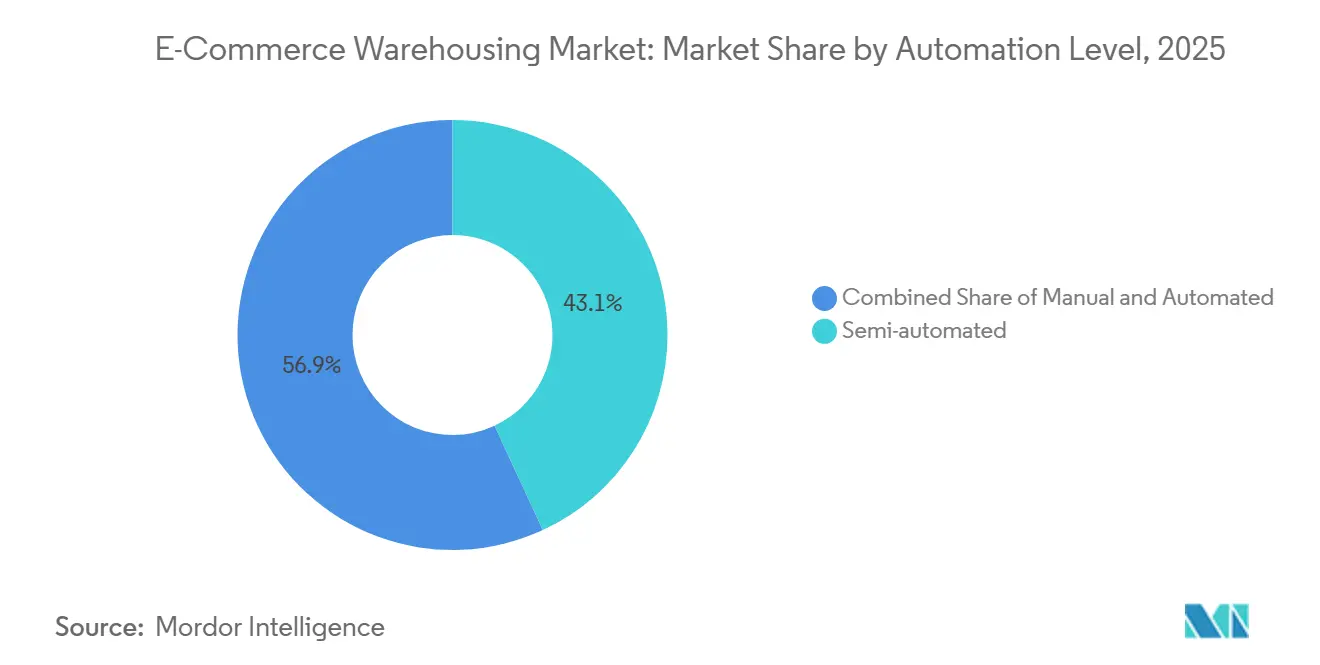
- By automation level, semi-automated facilities retained 43.10% share of the global E-commerce Warehousing Market size in 2025, while the automated segment is advancing at a 9.76% CAGR between 2026 and 2031.
- By end-user industry, apparel & footwear commanded 24.45% of the global E-commerce Warehousing Market share in 2025, grocery & FMCG is the fastest-growing segment at a 10.26% CAGR through 2031.
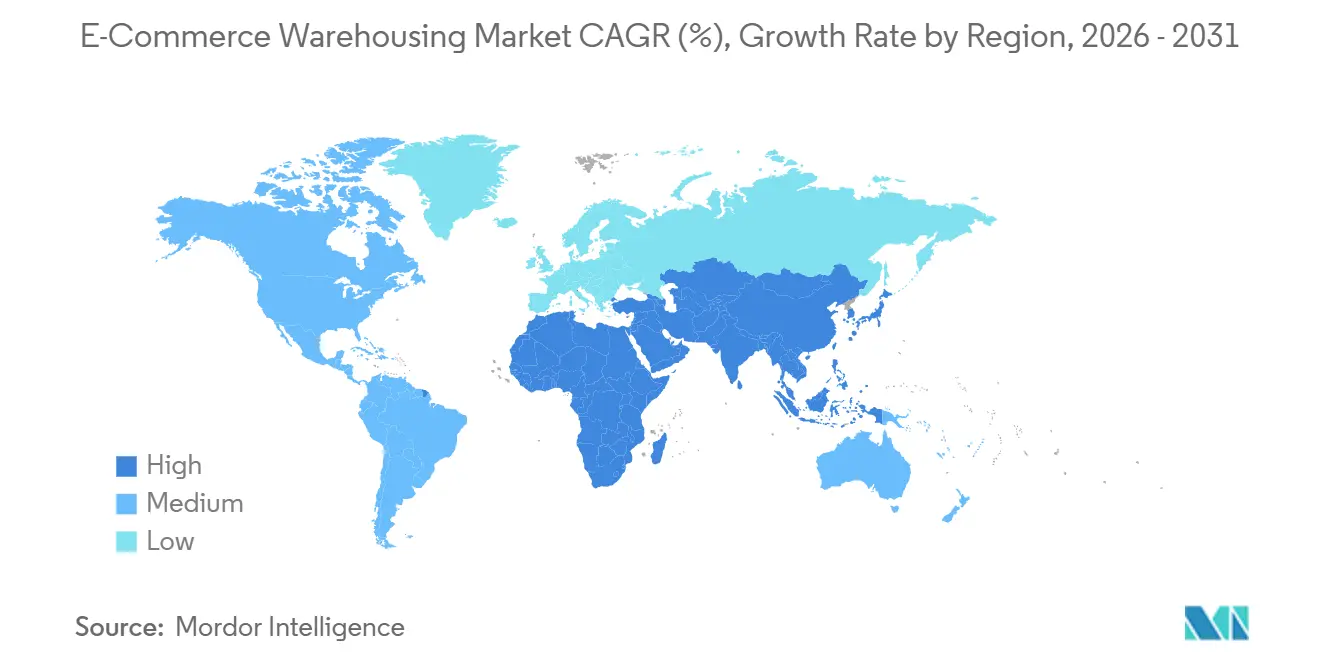
- By region, Asia-Pacific dominated with 38.95% of the global E-commerce Warehousing Market share in 2025 and is expanding at a 6.08% CAGR over 2026-2031.
Note: Market size and forecast figures in this report are generated using Mordor Intelligence’s proprietary estimation framework, updated with the latest available data and insights as of January 2026.
Global E-commerce Warehousing Market Trends and Insights
Drivers Impact Analysis*
| Driver | (~) % Impact on CAGR Forecast | Geographic Relevance | Impact Timeline |
|---|---|---|---|
| Cross-border e-commerce surge fuels bonded-warehouse expansion | +1.8% | Global, concentrated in Asia-Pacific trade corridors and Middle East free zones | Medium term (2-4 years) |
| Blockchain-verified chain-of-custody attracts regulated verticals | +0.9% | North America and Europe for pharmaceuticals; Asia for luxury goods | Long term (≥ 4 years) |
| Direct-to-consumer brand boom drives flexible pop-up warehousing | +1.5% | Urban centers in North America, Europe, and developed Asia-Pacific markets. | Short term (≤ 2 years) |
| Social-commerce-led SKU volatility spurs adaptive storage systems | +1.2% | Asia-Pacific dominance, expanding to North America and Europe | Medium term (2-4 years) |
| Net-zero mandates accelerate investment in energy-positive facilities | + 0.7% | Europe and North America are leading; Asia-Pacific is following the regulatory frameworks. | Long term (≥ 4 years) |
| BOPIS proliferation requires urban omni-inventory hubs | +1.1% | North America and Europe are mature markets; emerging in the Asia-Pacific region | Short term (≤ 2 years) |
| Source: Mordor Intelligence | |||
Cross-Border E-Commerce Surge Fuels Bonded-Warehouse Expansion
Free-trade zones from Jebel Ali to Singapore have raised bonded capacity by double-digit rates since 2024, enabling 3-5-day delivery to cross-border consumers and tipping the cost calculus for high-value goods. Chinese platforms such as Tmall Global funnel inventory through Southeast Asian bonded sites to shave two-week lead times, while European Union customs reforms reduced paperwork and unlocked 28% growth in Central-European bonded builds. These dynamics anchor the global E-commerce Warehousing Market’s structural shift toward near-border storage nodes that flex with trade-lane swings[1]DHL, “Cross-Border E-Commerce: The Future of International Trade,” dhl.com.
Blockchain-Verified Chain-of-Custody Attracts Regulated Verticals
Pharmaceutical and luxury operators are migrating to third-party sites once verification gaps close. IBM Food Trust and comparable ledgers log every handling event, satisfying regulators and luxury houses that previously preferred in-house stockrooms. Vaccine programs from Pfizer to Moderna proved the model at scale, and fashion groups like LVMH now imprint QR-based provenance on warehouse exits. Immutable logs trim compliance overhead by 40% and automate insurance triggers, although enterprise deployments still run up to USD 2 million and suffer interoperability frictions. Even so, blockchain uptake signals fresh premium-service revenue inside the global E-commerce Warehousing Market.
Direct-to-Consumer Brand Boom Drives Flexible Pop-Up Warehousing
DTC now represents 40% of total online volumes, yet micro-brands shun multiyear leases. On-demand platforms such as Flexe and Stord match spare capacity with 30-90-day windows, letting brands surge during launches and retreat post-campaign. Warby Parker and Allbirds used pop-ups to test new metros before committing to fixed networks, proving the viability of a model that commands 20-30% rent premiums but lowers capital exposure. Operators reconfigure 15-20% of floorspace into curtain-walled flex bays, blending anchor tenants with transient clients to smooth utilization and inject optionality into the global E-commerce Warehousing Market.
Social-Commerce-Led SKU Volatility Spurs Adaptive Storage Systems
New WMS releases from Manhattan and Blue Yonder mine social-media sentiment to pre-empt demand and resequence rack assignments overnight. Modular shelving, AI-driven labor calls, and micro-fulfillment pods help Southeast Asian players like Ninja Van dedicate 80% of floor area to high-volatility items, a design inversion now spreading to United States and European hubs. Flex-ready footprints are fast becoming table stakes across the global E-commerce Warehousing Market[2]Manhattan Associates, “Social Commerce Impact on Fulfillment,” manh.com.
Restraints Impact Analysis*
| Restraint | (~) % Impact on CAGR Forecast | Geographic Relevance | Impact Timeline |
|---|---|---|---|
| Power-grid constraints limit automation uptime in emerging regions | -0.8% | Asia-Pacific emerging markets, Sub-Saharan Africa, and parts of South America | Medium term (2-4 years) |
| Escalating cyber-attacks on WMS disrupt fulfillment continuity | -0.6% | Global, with the highest impact in North America and Europe | Short term (≤ 2 years) |
| Urban-edge zoning restrictions delay warehouse approvals | -0.5% | North America and Europe urban markets; select Asia-Pacific cities | Medium term (2-4 years) |
| Volatile ocean-freight rates complicate inventory positioning | -0.7% | Global trade lanes, particularly Asia-Europe and Trans-Pacific routes | Short term (≤ 2 years) |
| Source: Mordor Intelligence | |||
Power-Grid Constraints Limit Automation Uptime in Emerging Regions
Intermittent electricity knocks robotic lines offline for 15-25% of scheduled hours in markets from India to Nigeria. Diesel backups raise costs by 35-40% and undermine ROI on AS/RS systems. JD Logistics saw Jakarta utilization tumble from 85% to 62% when voltage dipped, forcing hybrid solar-battery retrofits that add USD 100-150 per ft² to capex. Until grid resilience improves, operators must balance automation ambition with localized power realities across the global E-commerce Warehousing Market.
Escalating Cyber-Attacks on WMS Disrupt Fulfillment Continuity
Ransomware incidents jumped 47% in 2024, pausing operations at 34% of logistics providers and erasing peak-season revenue as Blue Yonder’s breach stalled Starbucks and Sainsbury’s flows. Insurance premiums now climb 25-40% annually, and ISO 27001 certification turns into a contractual must-have. Smaller 3PLs lag on multilayer defenses, fragmenting the global E-commerce Warehousing Market into security-rich and security-lite tiers[3]Reuters, “Blue Yonder Ransomware Attack Disrupts Retailers,” reuters.com.
*Our forecasts treat driver/restraint impacts as directional, not additive. The impact forecasts reflect baseline growth, mix effects, and variable interactions.
Segment Analysis
By Warehouse Type: Accelerated Growth of Micro-Fulfillment Centers
Micro-fulfillment centers and dark stores are expanding at a 10.68% CAGR (2026–2031), challenging traditional fulfillment centers, which still hold 43.42% of the global E-commerce Warehousing Market size in 2025. Their small, hyperlocal setups enable ultra-fast delivery, making them especially effective in dense urban areas.
Traditional distribution centers remain important but are evolving into omnichannel hubs. Cold-chain warehouses are also growing to support grocery and pharmaceutical demand, while bonded warehouses are gaining traction in cross-border e-commerce through duty-deferred models. At the same time, specialized facilities for returns and refurbishment are emerging, highlighting the rising importance of reverse logistics.


By Service Type: Value-Added Services Command Premium Positioning
Storage held a 44.82% revenue of the global E-commerce Warehousing Market size in 2025, but value-added services will advance at a 10.15% CAGR as brands seek differentiation beyond plain shelving. Customized kitting, late-stage labeling, and bespoke packaging allow DTC sellers to embed brand equity at the warehouse touchpoint, commanding 15-25% price uplifts over basic pick-pack.
Rising returns are pushing warehouses to add inspection, refurbishment, and resale processes, making operations more complex. Fast-moving goods are increasingly handled through cross-docking to reduce storage time and costs. Meanwhile, strict tracking requirements in sectors like pharma and food are creating valuable, long-term service opportunities. Overall, warehousing is becoming more specialized and service-driven.
By Automation Level: Hybrid Models Balance Flexibility and Efficiency
Semi-automated sites controlled 43.10% market share during 2025, serving as pragmatic bridges between manual dexterity and full robotic throughput. Declining hardware costs propel the automated tier forward at 9.76% CAGR, yet capital intensity still limits adoption to high-volume nodes. AutoStore grids cut labor 70% and shrink layout footprints fourfold, but require 50,000 daily picks to clear investment hurdles.
Manual floors persist in emerging economies where wages remain USD 2-4 per hour, or in SKU-volatile categories unsuited to fixed automation. Collaborative bots from Locus Robotics now populate DHL and FedEx sites, showing that targeted deployments can treble productivity at a fraction of full-automation budgets. These hybrids reinforce resilience across the global E-commerce Warehousing Market.
By End-User Industry: Grocery Transformation Accelerates Infrastructure Investment
Grocery & FMCG is breaking ahead at a 10.26% CAGR, leveraging micro-fulfillment to offset thin margins and varied temperature zones. Instacart and Fabric roll out automated cubes that pick a 50-item basket in under five minutes, cutting store-aisle labor and improving freshness metrics.
Apparel & footwear still led with 24.45% global E-commerce Warehousing Market share in 2025 on the back of mature online penetration and return-heavy workflows. Consumer electronics demand secure, climate-stable bays, pharmaceuticals rely on validated cold chains, and furniture players explore white-glove assembly zones. Each vertical pushes tailored capabilities, widening specialization within the global e-commerce warehousing industry.
Geography Analysis
Asia-Pacific controlled 38.95% of the global E-commerce Warehousing Market share in 2025 and posts the strongest 6.08% CAGR through 2031. China’s free-trade-zone network funnels USD 300 billion in cross-border goods through bonded depots, while Indonesia, Vietnam, and the Philippines add micro-fulfillment coverage to satisfy social-commerce flash demand. India’s GST reform triggered a 40% jump in institutional-grade space and accelerated automation pilots despite power-grid inconsistencies. Japan and South Korea deploy robotics to offset aging labor pools, pushing regional technology intensity higher[4]China Customs, “Cross-Border E-Commerce Stats,” english.customs.gov.cn.
North America forms the second-largest slice of the global E-commerce Warehousing Market. Pandemic-era overbuilding left sublease space idle in 2024, yet absorption picked up in 2025 as retailers recalibrated omnichannel footprints. Mexico flourishes as a nearshore alternative, attracting bonded builds in Monterrey and Tijuana that knit into United States distribution corridors. Sustainability upgrades dominate United States capex, with rooftop solar and LEED Gold designs standard in new bids.
Europe records steady expansion behind Green Deal imperatives and BOPIS adoption. Warsaw and Rotterdam anchor multimodal corridors, while Brexit-driven customs frictions spark dual-inventory positions on each side of the Channel. LEED and BREEAM labels now influence financing terms, embedding efficiency baselines into continental warehouse valuations. Middle East and Africa, though smaller, grow rapidly; Dubai and Riyadh bankroll free-zone hubs to service tri-continent flows that feed the broader global E-commerce Warehousing Market.
Note: Segment shares of all individual segments available upon report

Competitive Landscape
Competition is moderate and tightening as asset-heavy logistics majors, tech-native marketplaces, and industrial REITs jostle for wallet share. DHL and GXO pour hundreds of millions into robotics and predictive analytics to defend longevity, while Flexe and Stord aggregate third-party capacity into Uber-style digital dashboards. Prologis earmarks USD 3 billion for solar arrays and battery systems, leveraging sustainability credentials for rental premiums.
Strategic differentiation tilts toward software integration depth, blockchain verification, and segment-specific expertise. Cold-chain specialist Lineage Logistics enlarges its 480-site network into India and Southeast Asia, and Ninja Van monetizes social-commerce know-how via adaptive-slotting hubs. Partnerships with robotics leaders AutoStore, Boston Dynamics, and Locus create technological moats. Consolidation is selective; DSV’s Jebel Ali acquisition underscores the value of bonded nodes on strategic trade lanes.
E-commerce Warehousing Industry Leaders
DHL Supply Chain & Fulfilment
GXO Logistics
CEVA Logistics
Amazon (FBA + Amazon Global Logistics)
JD Logistics
- *Disclaimer: Major Players sorted in no particular order

Recent Industry Developments
- March 2026: DHL Partnered with Air France-KLM for ground handling services at London Gatwick, strengthening air cargo + e-commerce logistics integration.
- March 2026: Fedex Announced development of an AI-powered agent workforce, targeting automation across logistics operations (including fulfillment optimization).
- December 2025: DHL signed a sustainable fuel agreement (biofuel) with CMA CGM, supporting green logistics in global shipping and e-commerce supply chains.
- May 2025: DHL announced the merger of UK parcel operations with Evri, forming “Evri Premium – a network of DHL eCommerce”, boosting last-mile e-commerce capacity in the UK.


Global E-commerce Warehousing Market Report Scope
| Fulfilment Centres |
| Distribution Centres (DCs) |
| Cold-Chain Warehouses |
| Dark Stores / Micro-Fulfillment Centers |
| Others (reverse logistics hubs, bonded warehouses, hybrid-use spaces, etc.) |
| Storage |
| Picking & Packing |
| Value-Added Services and Others (kitting, labelling) |
| Manual |
| Semi-Automated |
| Fully Automated |
| Apparel & Footwear |
| Consumer Electronics |
| Grocery & FMCG |
| Pharmaceuticals, Beauty & Wellness |
| Home Essentials & Furnishings |
| Others |
| North America | United States |
| Canada | |
| Mexico | |
| South America | Brazil |
| Peru | |
| Chile | |
| Argentina | |
| Rest of South America | |
| Asia-Pacific | India |
| China | |
| Japan | |
| Australia | |
| South Korea | |
| South East Asia (Singapore, Malaysia, Thailand, Indonesia, Vietnam, and Philippines) | |
| Rest of Asia-Pacific | |
| Europe | United Kingdom |
| Germany | |
| France | |
| Spain | |
| Italy | |
| BENELUX (Belgium, Netherlands, and Luxembourg) | |
| NORDICS (Denmark, Finland, Iceland, Norway, and Sweden) | |
| Rest of Europe | |
| Middle East and Africa | United Arab Emirates |
| Saudi Arabia | |
| South Africa | |
| Nigeria | |
| Rest of Middle East And Africa |
| By Warehouse Type | Fulfilment Centres | |
| Distribution Centres (DCs) | ||
| Cold-Chain Warehouses | ||
| Dark Stores / Micro-Fulfillment Centers | ||
| Others (reverse logistics hubs, bonded warehouses, hybrid-use spaces, etc.) | ||
| By Service Type | Storage | |
| Picking & Packing | ||
| Value-Added Services and Others (kitting, labelling) | ||
| By Automation Level | Manual | |
| Semi-Automated | ||
| Fully Automated | ||
| By End-User Industry | Apparel & Footwear | |
| Consumer Electronics | ||
| Grocery & FMCG | ||
| Pharmaceuticals, Beauty & Wellness | ||
| Home Essentials & Furnishings | ||
| Others | ||
| By Geography | North America | United States |
| Canada | ||
| Mexico | ||
| South America | Brazil | |
| Peru | ||
| Chile | ||
| Argentina | ||
| Rest of South America | ||
| Asia-Pacific | India | |
| China | ||
| Japan | ||
| Australia | ||
| South Korea | ||
| South East Asia (Singapore, Malaysia, Thailand, Indonesia, Vietnam, and Philippines) | ||
| Rest of Asia-Pacific | ||
| Europe | United Kingdom | |
| Germany | ||
| France | ||
| Spain | ||
| Italy | ||
| BENELUX (Belgium, Netherlands, and Luxembourg) | ||
| NORDICS (Denmark, Finland, Iceland, Norway, and Sweden) | ||
| Rest of Europe | ||
| Middle East and Africa | United Arab Emirates | |
| Saudi Arabia | ||
| South Africa | ||
| Nigeria | ||
| Rest of Middle East And Africa | ||


Key Questions Answered in the Report
What CAGR is expected for global e-commerce warehousing through 2031?
The market is projected to advance at 5.44% CAGR between 2026 and 2031, reaching USD 67.96 billion by the end of the period.
Which region leads growth in warehouse capacity for online retail?
Asia-Pacific combines the highest 38.95% share in 2025 with the quickest 6.08% CAGR, driven by China and fast-growing Southeast Asian economies.
Why are micro-fulfillment centers gaining momentum?
Urban micro-fulfillment centers enable sub-30-minute delivery, cut last-mile mileage, and grow at 10.68% CAGR by closely positioning inventory to consumers.
Which warehouse type is growing the fastest?
Dark stores and micro-fulfillment centers are advancing at a 10.68% CAGR, driven by same-day delivery demand.
How are sustainability goals shaping new warehouse builds?
Net-zero and LEED mandates spur energy-positive sites with rooftop solar and geothermal, commanding rental premiums and lowering vacancy.
What security challenges face warehouse operators?
Cyber-attacks on WMS rose 47% in 2024, prompting ISO 27001 adoption and higher cyber-insurance costs as operators safeguard fulfillment continuity.
Page last updated on:


