North America E-Commerce Warehouse Market Size and Share
Market Overview
| Study Period | 2020 - 2031 |
|---|---|
| Forecast Data Period | 2026 - 2031 |
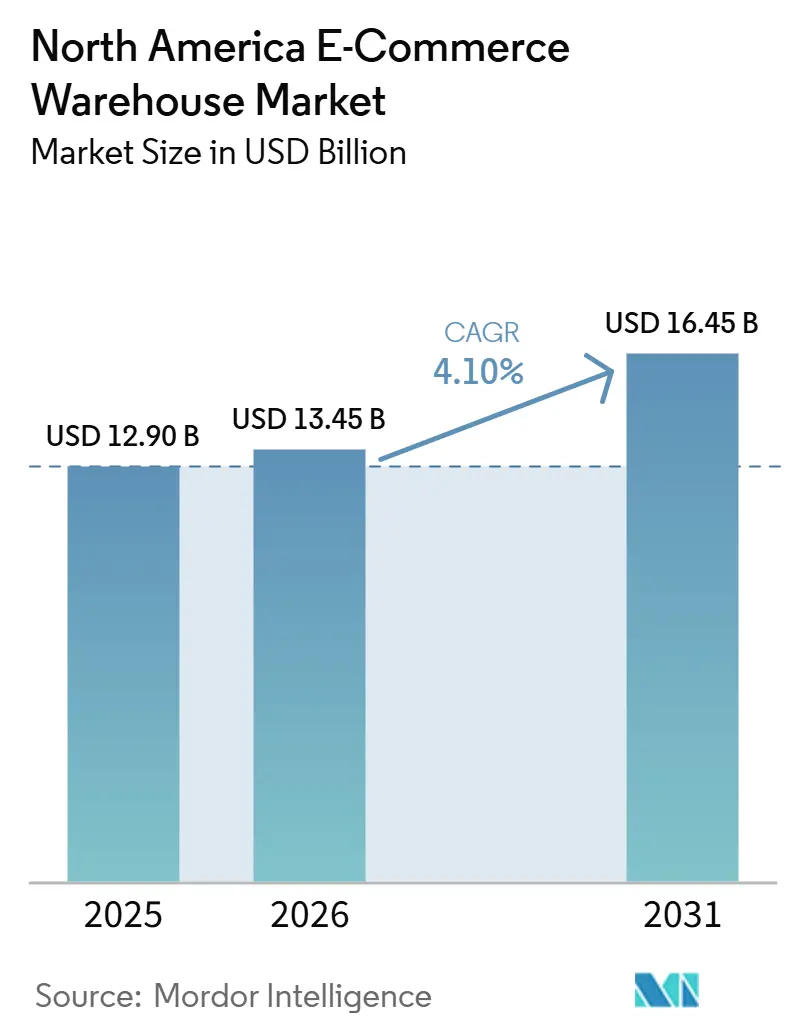
| Base Year Market Size (2025) | USD 12.90 Billion |
| Market Size (2026) | USD 13.45 Billion |
| Market Size (2031) | USD 16.45 Billion |
| Growth Rate (2026 - 2031) | 4.10% CAGR |
| Market Concentration | Medium |
Major Players *Disclaimer: Major Players sorted in no particular order Image © Mordor Intelligence. Reuse requires attribution under CC BY 4.0. | |
North America E-Commerce Warehouse Market Analysis by Mordor Intelligence
The North America e-commerce warehouse market size is projected to be USD 12.9 billion in 2025, USD 13.45 billion in 2026, and reach USD 16.45 billion by 2031, growing at a CAGR of 4.1% from 2026 to 2031.
The market’s measured expansion masks a fundamental restructuring of warehouse economics as pallet-level B2B orders and high-velocity consumer shipments now compete for the same industrial footprints. Multi-tenant facilities gain traction because they can toggle between bulk pallet storage and piece-pick fulfillment, while single-client distribution centers struggle to keep utilization high. Subscription and direct-to-consumer (DTC) brands are turning warehouses into light-manufacturing hubs for kitting and personalization, and widespread free-return policies compel retailers to dedicate 15-20% of total footage to reverse-logistics zones. In parallel, carbon-credit-funded green facilities and FAA-aligned drone-hub rooftops are starting to command rental premiums, injecting new factors into site-selection calculus.
Key Report Takeaways
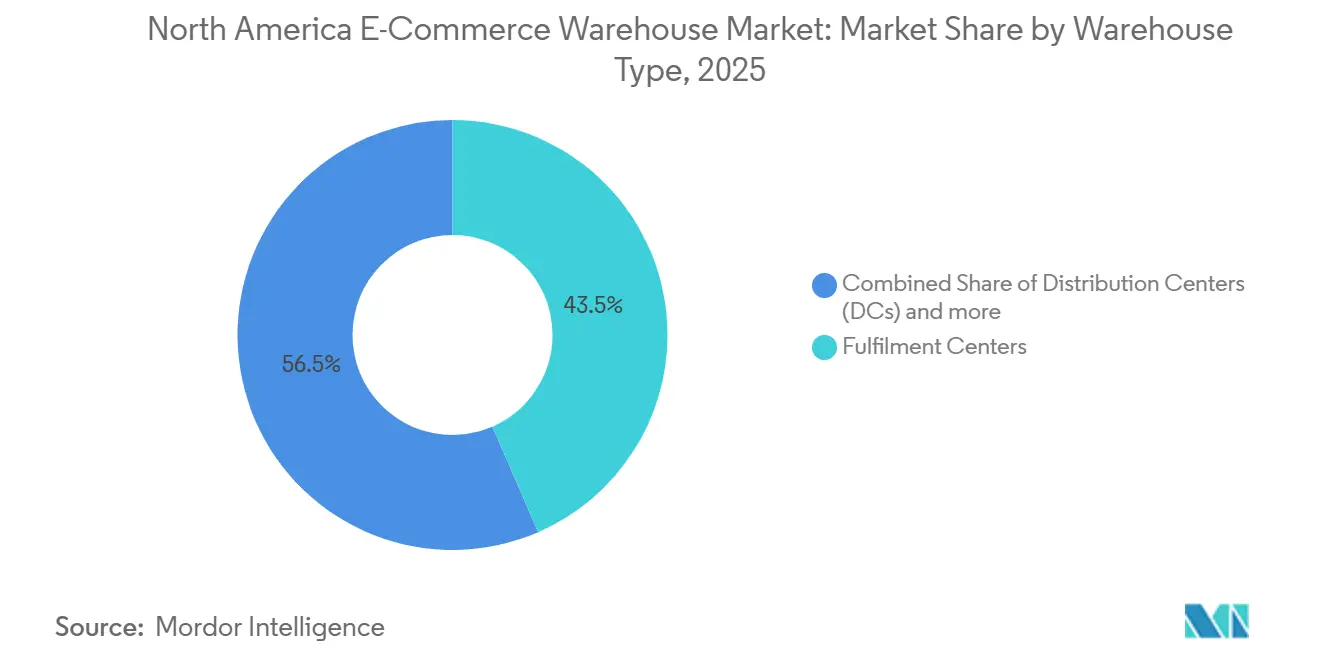
- By warehouse type, fulfillment centers held 43.47% of the North America e-commerce warehouse market share in 2025, while dark stores and micro-fulfillment centers post the highest projected CAGR at 9.34% through 2031.
- By service type, storage services accounted for 46.15% share of the North America e-commerce warehouse market size in 2025, yet value-added services are set to expand at an 8.81% CAGR through 2031.
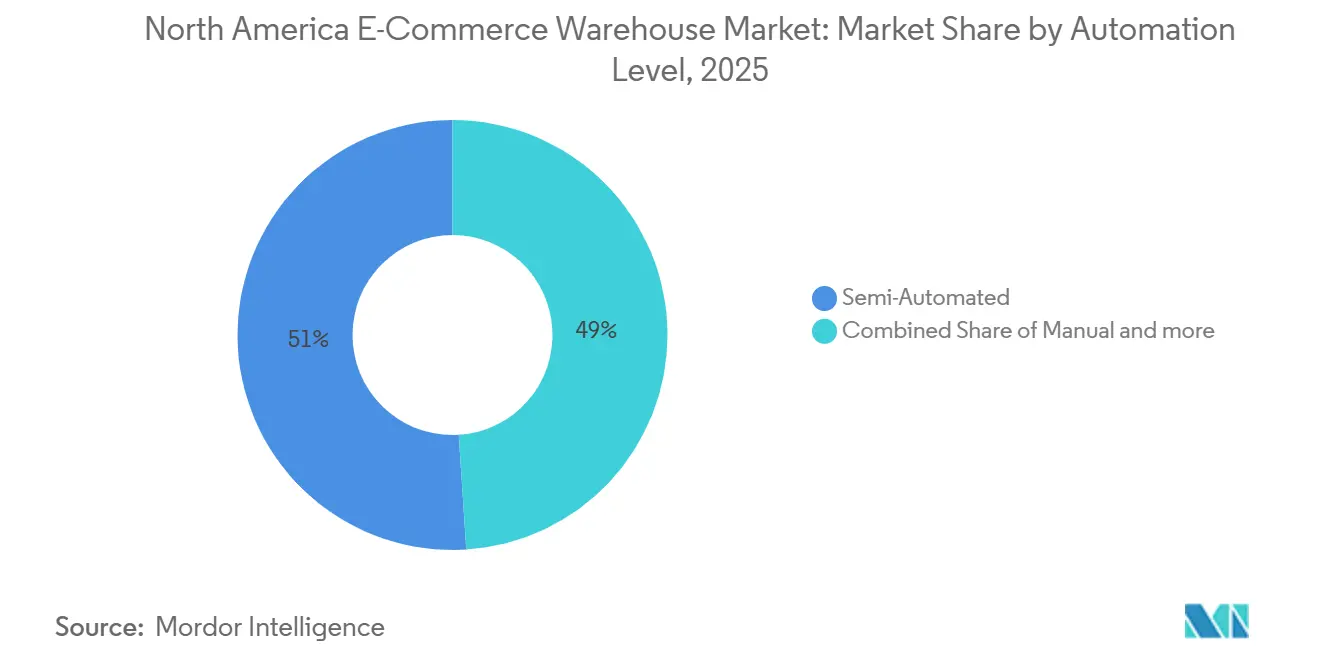
- By automation level, semi-automated operations led with a 51.01% share in 2025, whereas fully automated sites are forecast to accelerate at an 8.42% CAGR between 2026 and 2031.
- By end-user industry, apparel and footwear captured 27.2% of the North America e-commerce warehouse market size in 2025; grocery and FMCG are advancing at an 8.92% CAGR to 2031.
- By country, the United States commanded 79.44% of the North America e-commerce warehouse market share in 2025, while Mexico is projected to expand at a 5.29% CAGR through 2031.
Note: Market size and forecast figures in this report are generated using Mordor Intelligence’s proprietary estimation framework, updated with the latest available data and insights as of January 2026.
North America E-Commerce Warehouse Market Trends and Insights
Drivers Impact Analysis*
| Driver | (~) % Impact on CAGR Forecast | Geographic Relevance | Impact Timeline |
|---|---|---|---|
| B2B E-Commerce Surge Expanding Pallet-Level Storage Needs | +0.9% | United States and Canada, spillover to Mexico border zones | Medium term (2–4 years) |
| Subscription and DTC Brand Growth Driving Kitting and Personalization Capacity | +0.7% | United States coastal hubs | Short term (≤ 2 years) |
| Free-Return Culture Escalating Reverse-Logistics Square Footage | +0.6% | North America, highest in United States | Short term (≤ 2 years) |
| Oversized Imports Spurring High-Bay Warehouse Demand | +0.5% | United States port markets, Canadian import gateways | Medium term (2–4 years) |
| Carbon-Credit-Funded Green Warehouse Projects Unlocking Cap-Ex | +0.4% | United States and Canada, ESG-focused regions | Long term (≥ 4 years) |
| Rooftop Drone-Hub Integration Along FAA Delivery Corridors | +0.3% | United States, FAA-approved corridors | Long term (≥ 4 years) |
| Source: Mordor Intelligence | |||
B2B E-Commerce Surge Expanding Pallet-Level Storage Needs
Heightened B2B digital sales now require hybrid racking that supports full-pallet moves adjacent to pick-and-pack zones. United States B2B e-commerce exceeded USD 1.88 trillion in 2024, fueling demand for slotting systems that can be re-configured overnight through warehouse management algorithms. Some multi-tenant facilities already report 30-40% of daily volume in pallet orders, intensifying competition for ceiling height and dock doors. Flexible leases with quick change-over clauses are therefore outpacing long-term single-use contracts. The shift also attracts manufacturers bypassing wholesalers to sell directly online, which adds scheduling volatility that favors 24/7 operations.
Subscription and DTC Brand Growth Driving Kitting and Personalization Capacity
DTC sales exceeded USD 120 billion in 2025 and are trending toward smaller, more frequent boxes that must be personalized before shipping, raising labor minutes per order. Operators carve 20–30% of floor space into kitting cells equipped with QA stations and bespoke packaging, accepting denser headcounts in exchange for 40–50% higher revenue per square foot. Complex labeling obligations under United States Federal Trade Commission rules add to system requirements for traceability. Facilities that can scale work-cell counts rapidly during holiday spikes now win more RFPs from subscription platforms.
Free-Return Culture Escalating Reverse-Logistics Square Footage
Online return rates climbed to 20–30% for apparel in 2025, peaking above 40% during major sales events. Dedicated returns areas occupy up to one-fifth of gross footage, shrinking effective outbound capacity and raising headcount needs for inspection and repacking. Some operators are experimenting with AI-enabled vision systems to triage inbound goods; early pilots suggest a 15% reduction in touch-time, but capex remains steep. Reverse-logistics hubs separate from forward sites are gaining momentum to keep the same-day outbound service levels intact.
Oversized Imports Spurring High-Bay Warehouse Demand
Furniture and fitness equipment worth nearly USD 100 billion flowed through ports in 2025, and these bulky SKUs require 40-foot-plus clear heights plus long-reach forklifts. Suitable inventory is scarce because many speculative builds top out at 36 feet; as a result, landlords able to finance taller columns command 15-20% rent premiums. Municipal zoning caps sometimes block high-bay profiles, pushing developers toward fringe industrial parks that lengthen final-mile routes. Lead times for custom steel racking stretch beyond 40 weeks, making retrofit schedules hard to predict.
Restraints Impact Analysis*
| Restraint | (≈) % Impact on CAGR Forecast | Geographic Relevance | Impact Timeline |
|---|---|---|---|
| Escalating Warehouse-Insurance Premiums for Fire and Flood Risk | -0.7% | United States and Canada, climate-vulnerable regions | Short term (≤ 2 years) |
| Construction-Material Supply Volatility Delaying New Builds | -0.5% | North America, highest in United States | Medium term (2–4 years) |
| IoT Data-Privacy Regulations Complicating Sensor Deployment | -0.3% | Canada under PIPEDA, emerging U.S. state rules | Medium term (2–4 years) |
| Shortage of Robotics-Maintenance Technicians Elevating Downtime Risk | -0.4% | United States and Canada, automated clusters | Long term (≥ 4 years) |
| Source: Mordor Intelligence | |||
Escalating Warehouse-Insurance Premiums for Fire and Flood Risk
Commercial property premiums rose 8.4% nationwide in 2025, but spiked 25-40% in wildfire and flood zones, occasionally surpassing property-tax outlays. Fully automated sites see the sharpest uptick because robotics assets elevate insured values; some quotes exceed USD 15 per square foot each year versus USD 5-7 for conventional buildings. Operators now map FEMA floodplains and wildfire risk scorings as part of network design, trading slightly longer final-mile distances for lower carrying costs. Furthermore, insurers are becoming more discerning, scrutinizing both locations and building specifications. Consequently, developers and operators are contending with squeezed profit margins, a deceleration in expansion efforts, and diminished leeway in site selection, particularly in areas vulnerable to flooding or prone to fires[1]“Commercial Property Insurance Market Update Q1 2025,” Insurance Information Institute, iii.org.
Construction-Material Supply Volatility Delaying New Builds
Lead times for structural steel hovered at 40-plus weeks in 2025, doubling historical norms. Concrete prices jumped 18% as aggregate shortages bit into schedules. Projects larger than 1 million square feet absorb USD 10-20 million in overruns, prompting developers to favor modular designs that lock in factory-priced components. Fluctuations in the availability and pricing of essential inputs, such as steel, concrete, and MEP components, are extending lead times. This not only escalates project costs but also compels developers to halt or reschedule their projects. Consequently, new supply fails to match leasing demand, allowing owners of existing stock to lift rents across core markets[2]“Steel Construction Market Report 2025,” American Institute of Steel Construction, aisc.org.
*Our forecasts treat driver/restraint impacts as directional, not additive. The impact forecasts reflect baseline growth, mix effects, and variable interactions.
Segment Analysis
By Warehouse Type: Fulfillment Centers Anchor Scale, Dark Stores Speed Urban Miles
Fulfillment centers accounted for 43.47% of the North America e-commerce warehouse market share in 2025, underpinned by regional demand for bulk storage and cross-docking. At the other end, dark stores and micro-fulfillment centers post a 9.34% CAGR to 2031 as retailers chase two-hour delivery promises in dense metros. The North America e-commerce warehouse market size for dark stores is projected to expand steadily as high-velocity SKUs justify higher rent profiles close to city cores. Distribution hubs still dominate inbound container deconsolidation, whereas cold-chain facilities accelerate alongside online grocery adoption.
Developers repurpose dormant big-box retail into urban dark stores, boosting pick rates by 40–50% compared with in-aisle shopping models. Yet zoning battles erupt as municipalities debate truck traffic and noise in former retail districts. High-bay construction within city limits remains rare due to height caps, encouraging mezzanine builds that stretch cubic capacity without breaching roof-height codes. Proximity’s value shields operators from the rate cuts now visible at suburban sheds, underscoring bifurcated demand inside the North America e-commerce warehouse market.


By Service Type: Value-Added Operations Monetize Every Square Foot
Storage retained 46.15% of the North America e-commerce warehouse market size in 2025, but value-added services are on an 8.81% CAGR path that outpaces any other category through 2031. North America e-commerce warehouse market advantages accrue to 3PLs able to integrate kitting, light assembly, gift wrapping, and stringent QC routines under one roof. Revenue per pallet climbs as operators bill labor in fifteen-minute increments, frequently doubling gross margins relative to racked storage alone.
DTC brands resort to these services because in-house fulfillment would delay launch cycles. Operators now allocate work cells next to high-velocity inventory lanes, minimizing travel and lifting daily order-processing efficiency. However, these zones carry turnover rates up to 30% due to repetitive fine-motor tasks, so market participants deploy gamified dashboards and stepped wage ladders to retain staff. Flexible labor platforms also emerge, supplying pre-vetted gig workers during holiday peaks.
By Automation Level: Semi-Automated Today, Fully Automated Tomorrow
Semi-automated sites commanded 51.01% market share in 2025, blending goods-to-person shuttles with manual pack stations. Yet the North America e-commerce warehouse market size allocated to fully automated builds shows an 8.42% CAGR as price points fall and labor costs rise. Automated mobile robots now rent on three-year operating leases, easing capex hurdles but increasing the need for in-house diagnostic skills[3]“Robotics Technician Workforce Study 2025,” Association for Advancing Automation, automate.org.
Operators quantify returns through throughput per square foot, with fully automated aisles often reaching 400 units per hour versus 120 in manual lines. Still, fixed depreciation burdens dull flexibility during off-peak seasons, spurring interest in modular robotics that can be redeployed or sub-leased. Market entrants must therefore balance automation depth with contractual volume commitments to avoid stranded assets.
By End-User Industry: Grocery Cold Chain Overtakes Apparel Growth
Apparel and footwear held 27.2% market share in 2025, benefiting from mature online shopper habits. Grocery and FMCG, however, are climbing at an 8.92% CAGR as chilled e-commerce baskets penetrate suburban households. The North America e-commerce warehouse market size for temperature-controlled space remains tight because build costs run 60% higher than ambient shells. Cold storage REITs exploit scarcity to push rents and win long-term commitments.
Pharmaceutical shippers demand GDP-compliant chain-of-custody logs, prompting installations of redundant chillers and backup power. Home-furnishing sellers, by contrast, rent high-bay zones beyond 40 feet, acknowledging the cube efficiency of vertical furniture stacking. Segment specialization thus diffuses equipment spending: blast freezers on one end, extended-reach lifts on the other.
Geography Analysis
The United States anchors the North America e-commerce warehouse market share with nearly 79.44% of 2025 revenue. Carbon-credit financing now underwrites rooftop solar arrays, trimming utility bills while delivering tradable offsets that cover 15–20% of incremental construction outlays. Conversely, wildfire and flood exposure inflates insurance to such an extent that some Gulf and Pacific facilities face total risk charges exceeding USD 15 per square foot each year. Build schedules stretch 6–12 months beyond plan because steel joist lead times sit near historic highs, giving incumbent landlords flexibility to raise rents mid-lease.
Mexico emerges as the region’s growth engine at 5.29% CAGR, catalyzed by nearshoring and container trade lanes that surged 59.7% in 2024. Manufacturers relocating from Asia are clustering around Monterrey, Saltillo, and border crossings, spurring a warehouse building boom. December 2024 tariffs on textiles (35%) and couriered goods (19%) created a temporary lull, yet bonded regimes and USMCA duty-free thresholds allow savvy operators to blunt cost spikes. High vacancy in Class B stock invites retrofit programs that add racking and climate control rather than building ground-up, compressing delivery timelines for fast-growing tenants[4]“US-Mexico Trade Data 2024,” U.S. International Trade Commission, usitc.gov.
Canada contributes a stable but capacity-constrained slice of the North America e-commerce warehouse market. Construction costs run 10–15% above United States Midwest benchmarks due to currency swings and aggregate shortages, while PIPEDA’s strict stance on personal data compels local processing and anonymization protocols. Some operators now bake privacy-engineering fees into contract rates, shifting compliance costs downstream. Cold-chain capacity is scarce around Toronto and Vancouver, prompting cross-border shippers to stage frozen loads in Detroit or Buffalo and serve Canadian customers via expedited lanes.
Competitive Landscape
Competition is moderate and tightening as traditional 3PLs, cold-storage REITs, parcel integrators, and software-driven fulfillment platforms converge on automation as a differentiator. Large incumbents leverage multi-region networks and buying power to secure robotics at scale, which in turn reduces cost-per-order and locks in high-volume clients. Mid-tier providers carve niches in value-added services, offering kitting or returns management that commands premium pricing and deeper client stickiness.
White-space opportunities remain in high-bay buildings tailored to oversized imports, rooftop drone hubs near FAA corridors, and LEED-certified dark stores favored by ESG-minded grocers. Asset-light networks aggregating third-party capacity through software gain mindshare, yet face margin squeeze if they cannot guarantee robotics uptime. The shortage of maintenance technicians, therefore, bestows an edge on vertically integrated operators with in-house engineering teams, shielding them from the 15-20% downtime plaguing less prepared peers.
M&A continues as incumbents bolt on cold-chain assets, regional cross-border space, and specialized pharmaceutical nodes. Insurance pricing and regulatory risk have become diligence focal points, with acquirers discounting valuations for warehouses in high-hazard counties or privacy-heavy jurisdictions. Capital inflows from infrastructure funds and sovereign investors support green-warehouse roll-outs, further professionalizing the competitive field inside the North America e-commerce warehouse market.
North America E-Commerce Warehouse Industry Leaders
GXO Logistics
DHL Group
CMA CGM Group (including CEVA Logistics)
FedEx
United Parcel Service of America, Inc. (UPS)
- *Disclaimer: Major Players sorted in no particular order

Recent Industry Developments
- March 2026: FedEx partnered with Berkshire Grey to pilot fully autonomous bulk-unloading robots in the United States e-commerce hubs, targeting improved container throughput and reduced manual exertion.
- February 2026: GXO Logistics positioned North America as its prime growth vector, citing a USD 250 billion addressable market and 970 active facilities totaling 200 million square feet.
- November 2025: UPS finalized its USD 1.6 billion purchase of Andlauer Healthcare Group, broadening cold chain reach across the United States and Canadian pharma networks.
- August 2025: Americold launched a 335,000-square-foot refrigerated hub in Kansas City via rail partnership with CPKC to streamline perishables between the United States and Mexico.


North America E-Commerce Warehouse Market Report Scope
| Fulfilment Centers |
| Distribution Centers (DCs) |
| Cold-Chain Warehouses |
| Dark Stores / Micro-Fulfillment Centers |
| Others (Reverse Logistics Hubs, Bonded Warehouses, Hybrid-use Spaces, etc.) |
| Storage |
| Picking and Packing |
| Value-Added Services and Others (Kitting, Labelling) |
| Manual |
| Semi-Automated |
| Fully Automated |
| Apparel and Footwear |
| Consumer Electronics |
| Grocery and FMCG |
| Pharmaceuticals, Beauty and Wellness |
| Home Essentials and Furnishings |
| Others |
| United States |
| Canada |
| Mexico |
| By Warehouse Type | Fulfilment Centers |
| Distribution Centers (DCs) | |
| Cold-Chain Warehouses | |
| Dark Stores / Micro-Fulfillment Centers | |
| Others (Reverse Logistics Hubs, Bonded Warehouses, Hybrid-use Spaces, etc.) | |
| By Service Type | Storage |
| Picking and Packing | |
| Value-Added Services and Others (Kitting, Labelling) | |
| By Automation Level | Manual |
| Semi-Automated | |
| Fully Automated | |
| By End-User Industry | Apparel and Footwear |
| Consumer Electronics | |
| Grocery and FMCG | |
| Pharmaceuticals, Beauty and Wellness | |
| Home Essentials and Furnishings | |
| Others | |
| By Country | United States |
| Canada | |
| Mexico |


Key Questions Answered in the Report
What CAGR is forecast for the North America e-commerce warehouse market between 2026 and 2031?
The market is projected to grow at a 4.1% CAGR over the 2026–2031 period.
Which warehouse type is expanding fastest through 2031?
Dark stores and micro-fulfillment centers are expected to post the highest growth at a 9.34% CAGR.
Why are value-added services gaining traction in warehousing?
DTC brands seek kitting, personalization, and assembly that command premium fees and deepen customer loyalty.
How are insurance premiums affecting facility location decisions?
Premium hikes of up to 40% in climate-exposed regions are prompting operators to favor inland or lower-risk zones.
What factor is driving demand for high-bay warehouses?
Rising online sales of furniture and fitness equipment require 40-foot-plus clear heights for efficient vertical storage.
How do carbon credits influence new warehouse construction?
Developers can monetize environmental credits to offset 15–20% of green-build costs, narrowing the rent gap with standard sites.
Page last updated on:


