On-demand Trucking Market Size and Share
Market Overview
| Study Period | 2020 - 2031 |
|---|---|
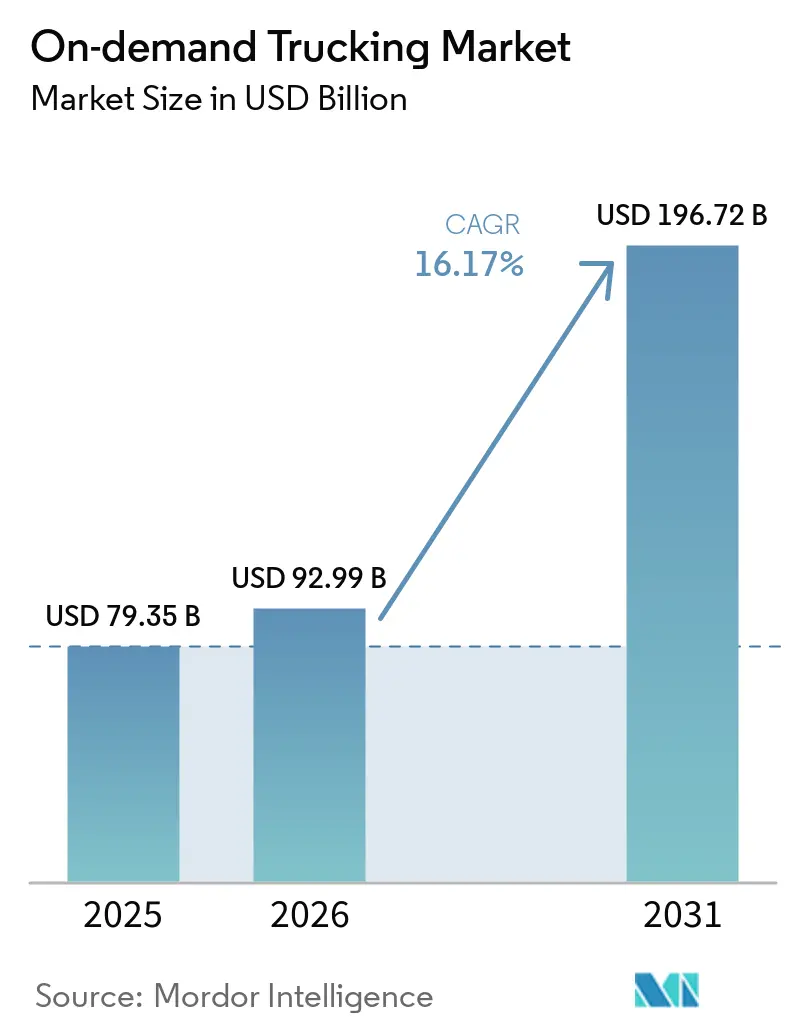
| Market Size (2026) | USD 92.99 Billion |
| Market Size (2031) | USD 196.72 Billion |
| Growth Rate (2026 - 2031) | 16.17% CAGR |
| Fastest Growing Market | Asia Pacific |
| Largest Market | Asia Pacific |
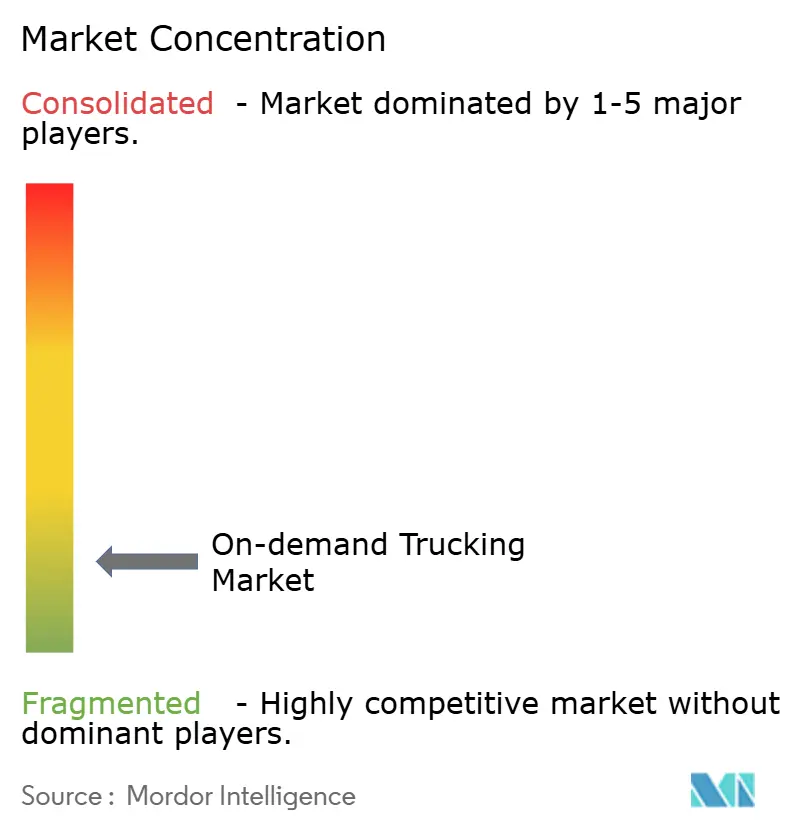
| Market Concentration | Low |
Major Players *Disclaimer: Major Players sorted in no particular order Image © Mordor Intelligence. Reuse requires attribution under CC BY 4.0. | |
On-demand Trucking Market Analysis by Mordor Intelligence
The on-demand trucking market size is projected to expand from USD 79.35 billion in 2025 and USD 92.99 billion in 2026 to USD 196.72 billion by 2031, registering a CAGR of 16.17% between 2026 and 2031.
Instant quote expectations born in ride-hailing push freight decision cycles from multi-day RFPs to sub-minute API calls, while embedded customs workflows unlock e-commerce corridors stretching from Shenzhen to Chicago. Platforms that unify dynamic pricing, compliance reporting, and real-time visibility capture enterprise budgets once locked into long-term contracts, strengthening network effects as each incremental shipper adds load density that further lowers empty-mile ratios and per-ton-mile emissions.
Key Report Takeaways
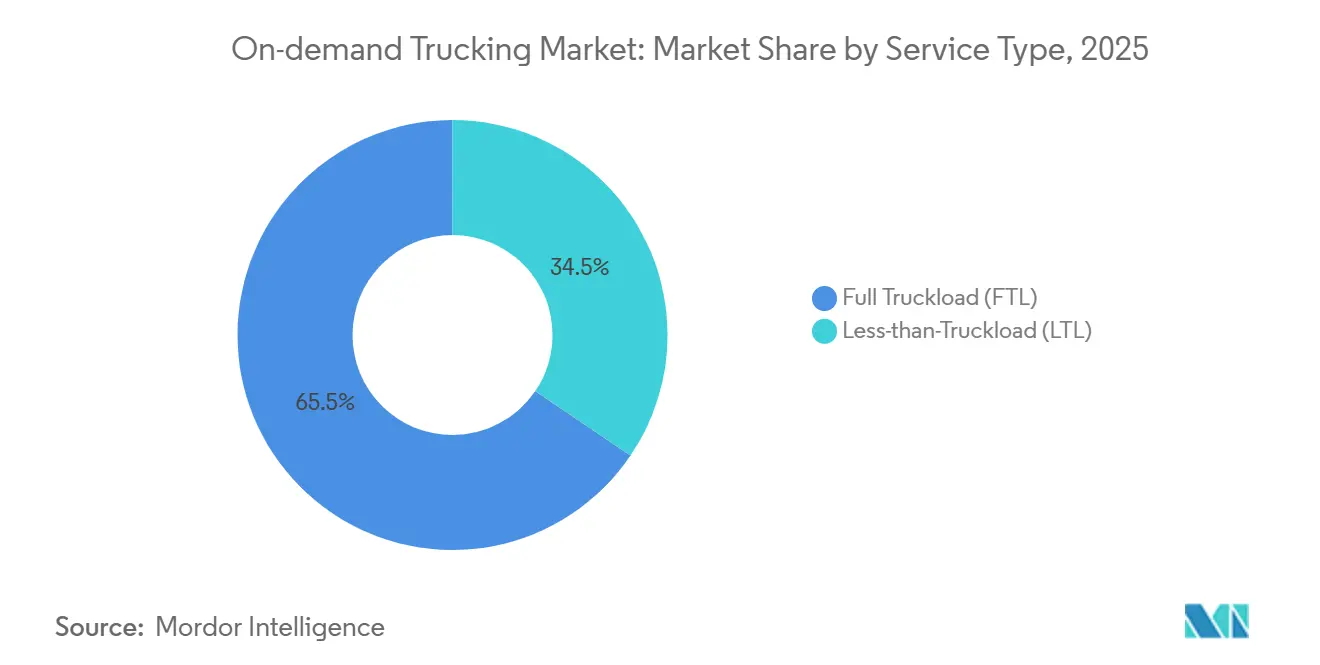
- By service type, full truckload led with 65.52% of the on-demand trucking market share in 2025, while less-than-truckload is forecast to expand at 17.23% CAGR to 2031.
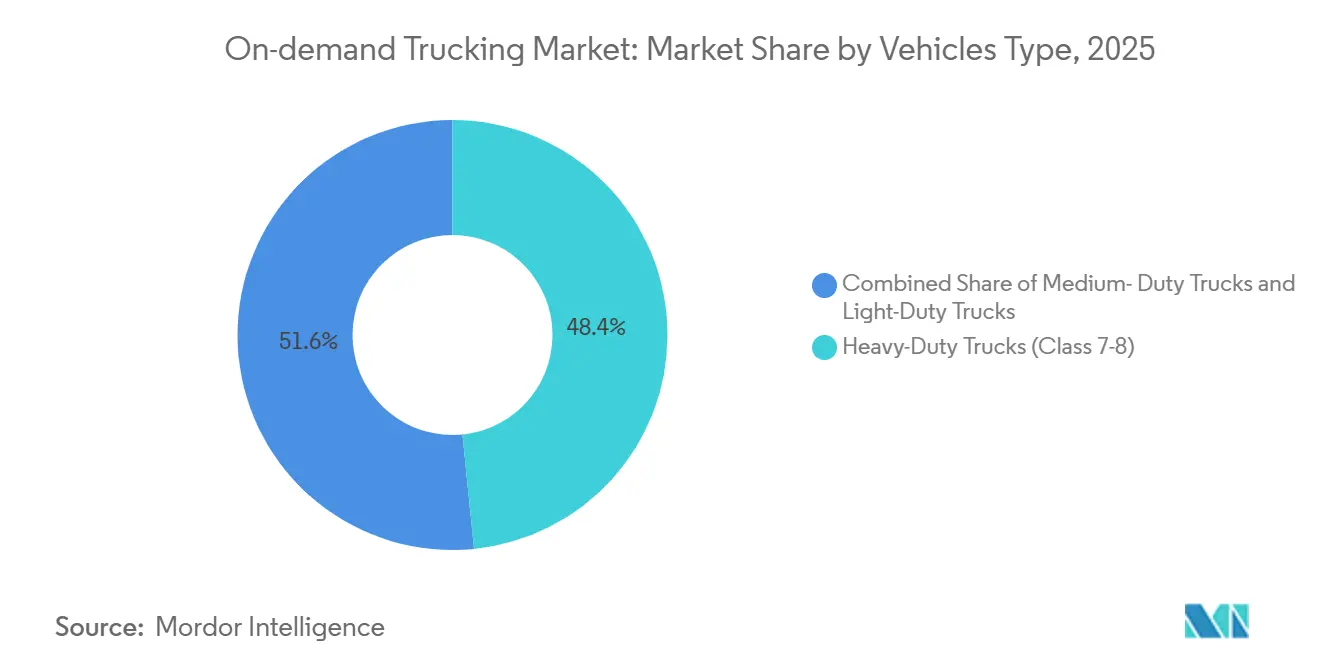
- By vehicle type, heavy-duty trucks accounted for 48.40% share of the on-demand trucking market in 2025, and light-duty trucks are advancing at 18.91% CAGR through 2031.
- By end user, e-commerce and retail commanded 35.13% share of the on-demand trucking market size in 2025 and is projected to grow at 19.94% CAGR to 2031.
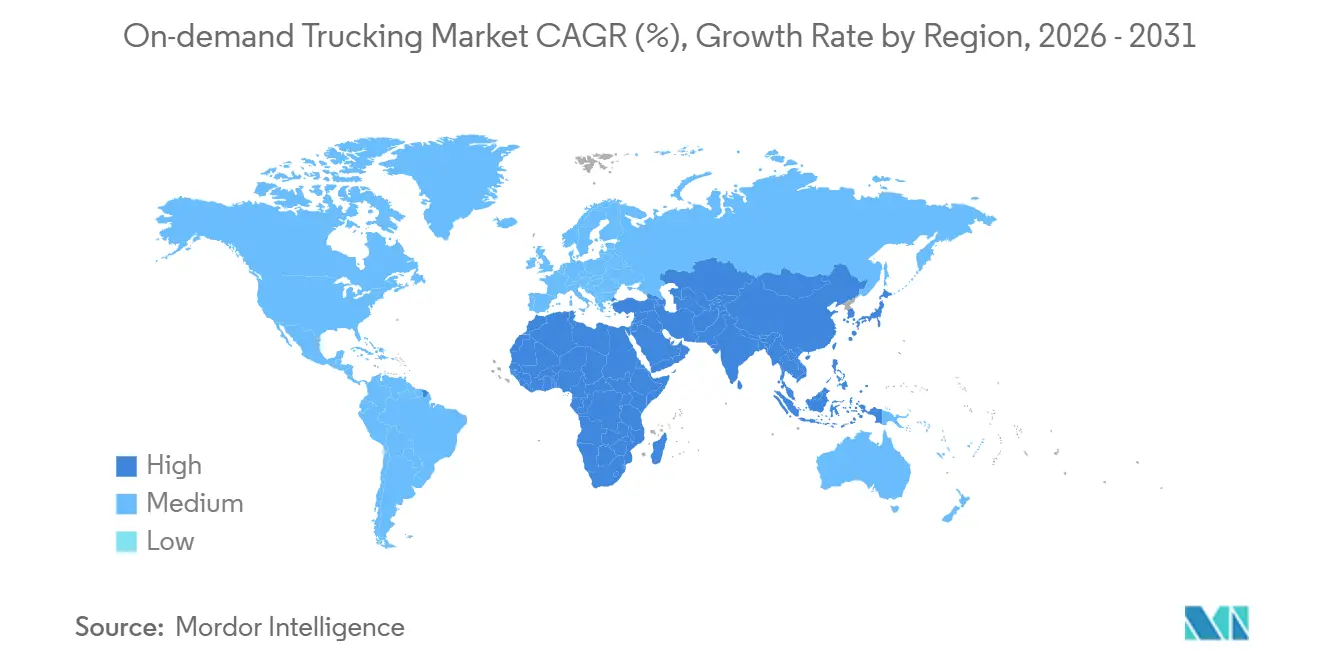
- By geography, the Asia Pacific held 41.25% of the on-demand trucking market in 2025 and is set to achieve 18.34% CAGR between 2026 and 2031.
Note: Market size and forecast figures in this report are generated using Mordor Intelligence’s proprietary estimation framework, updated with the latest available data and insights as of January 2026.
Global On-demand Trucking Market Trends and Insights
Drivers Impact Analysis*
| Driver | (~) % Impact on CAGR Forecast | Geographic Relevance | Impact Timeline |
|---|---|---|---|
| Fuel-price volatility steering shippers toward on-demand capacity hedging | +3.4% | Global, with acute impact in North America & Europe | Short term (≤ 2 years) |
| Scope-3 emission reporting mandates boosting algorithmic back-haul pooling | +2.9% | North America & EU primarily, expanding to APAC | Medium term (2-4 years) |
| Explosive cross-border e-commerce growth is demanding customs-ready, flexible trucking | +3.7% | APAC core, spill-over to North America & EU | Medium term (2-4 years) |
| Instant freight-quote expectations are accelerating platform adoption | +2.6% | Global, led by North America & APAC tech adoption | Short term (≤ 2 years) |
| ERP/TMS "Instant Truck Book" APIs are slashing integration friction | +2.1% | Global, with early gains in North America & Europe | Long term (≥ 4 years) |
| Usage-based cargo-insurance fintechs enabling micro-fleet participation | +1.8% | North America & Europe, expanding to APAC | Long term (≥ 4 years) |
| Source: Mordor Intelligence | |||
Fuel-price Volatility Steering Shippers Toward On-demand Capacity Hedging
Diesel averaged USD 2.50 to USD 4.20 per gallon during 2025, compressing carrier margins in fixed-rate contracts. The on-demand trucking market converts fuel risk into load-level pricing, allowing shippers to pay a transparent surcharge only when spot prices spike. Long-haul lanes, where fuel is 24-38% of operating cost, show the steepest adoption as procurement teams treat digital freight platforms as a real-time hedging tool. Mid-market exporters and agricultural co-ops without leverage for traditional fuel-escalator clauses gain the most relief. Platforms, for their part, monetize volatility by embedding rolling energy indices directly into quote engines, widening spreads during high-uncertainty windows while maintaining service levels[1]U.S. Energy Information Administration, “Gasoline and Diesel Fuel Update,” eia.gov.
Scope-3 Emission Reporting Mandates Boosting Algorithmic Back-haul Pooling
SEC and EU rules compel listed firms to disclose upstream and downstream freight emissions beginning fiscal 2027. The on-demand trucking market thus embeds carbon calculators aligned to GHG Protocol Scope-3 categories 4 and 9. Algorithms that cut empty-return miles from 35% to under 15% lower shippers’ emissions intensity while trimming cost per load. Platforms issue lane-level certificates audited by third-party verifiers, enabling exporters to satisfy investor ESG screens. Early adopters in consumer electronics and apparel already route 40% of overflow volume only through providers offering verifiable emission dashboards, signaling a shift where sustainability metrics now sit beside price and service in bid evaluations.
Explosive Cross-border E-commerce Growth Demanding Customs-ready Flexible Trucking
Global cross-border e-commerce is set to ramp up, with the Asia Pacific originating more than 60% of shipments. Traditional forwarders take up to 72 hours to complete customs paperwork, whereas platform APIs pre-validate HS codes and duties in seconds. The on-demand trucking market thereby slashes border transit times to under six hours for pre-cleared loads, a game-changer for flash-sale retailers whose SKUs rotate weekly. Chinese merchants shipping to the United States already route 22% of parcel volume via platform-managed truck-air hybrids that skip bonded warehouses. Indian exporters tap government digital freight corridors that sync customs portals with booking engines, widening access for micro-enterprises lacking brokerage expertise.
Instant Freight-quote Expectations Accelerating Platform Adoption
Influenced by ride-hailing norms, procurement officers now demand confirmed pricing and capacity in under a minute. Surveys of Fortune 500 shippers show email-based rate bids have fallen from 88% of spot transactions in 2021 to 34% in 2026. The on-demand trucking market meets this expectation through AI engines that ingest lane history, driver availability, and fuel indices, returning a binding quote in less than two seconds. ERP connectors from SAP and Oracle place those quotes directly inside purchase-order workflows. The speed delta converts into real dollars for high-mix manufacturers who shave safety stock days and free working capital. Traditional brokers reliant on manual price discovery are forced either to license platform APIs or exit high-velocity verticals such as food e-commerce and aftermarket auto parts.
Restraints Impact Analysis*
| Restraint | (~) % Impact on CAGR Forecast | Geographic Relevance | Impact Timeline |
|---|---|---|---|
| Chronic driver-shortage & aging workforce are pressuring service reliability | -2.3% | Global, most acute in North America & Europe | Medium term (2-4 years) |
| Worker-classification laws (e.g., AB 5, EU Platform Work Directive) are inflating gig-fleet costs | -1.7% | North America & EU primarily, regulatory spillover to APAC | Short term (≤ 2 years) |
| Data-privacy regulations limiting monetization of telematics & location streams | -1.2% | Europe & North America, expanding globally | Long term (≥ 4 years) |
| Sparse satellite failover connectivity is causing rural SLA breaches | -0.9% | Global, with a higher impact in emerging markets and rural corridors | Medium term (2-4 years) |
| Source: Mordor Intelligence | |||
Chronic Driver Shortage & Aging Workforce Pressuring Service Reliability
The American Trucking Associations expects a 160,000-driver gap by 2031, double the 2024 shortfall. Median driver age now sits at 46, with 54% of operators older than 45, worsening attrition for long-haul lanes. As vacancies rise, platforms experience higher load rejections during seasonal peaks, eroding the “capacity-on-tap” promise. Some market leaders counter by offering guaranteed weekly minimums and prepaid parking to attract younger drivers. Nevertheless, capacity scarcity caps growth in rural and temperature-controlled corridors, tempering otherwise robust on-demand trucking market expansion[2]American Trucking Associations, “ATA Chief Economist Pegs Driver Shortage Number at 80,000 in 2023,” trucking.org .
Worker-classification Laws Inflating Gig-fleet Costs
California’s AB5 and the EU Platform Work Directive presume employment when platforms dictate rates or schedules, triggering payroll taxes and benefits that lift per-mile costs 20-30%. Asset-light marketplaces must now choose between absorbing the new overhead or shifting fees to shippers, both scenarios squeezing unit margins. Larger incumbents absorb costs across volume, but smaller entrants lose pricing flexibility, raising consolidation risk inside the on-demand trucking industry. Hybrid models combining employee drivers on core lanes with contractors for overflow emerge, yet the compliance burden continues to challenge venture-backed disruptors pursuing blitz-scale tactics.
*Our forecasts treat driver/restraint impacts as directional, not additive. The impact forecasts reflect baseline growth, mix effects, and variable interactions.
Segment Analysis
By Service Type: Full Truckload Leads as Less-than-Truckload Gains Algorithmic Tailwinds
Less-than-Truckload services, while representing a smaller base, are on course for 17.23% CAGR through 2031. That outpaces Full Truckload’s 65.52% dominance in the on-demand trucking market as real-time consolidation tools pool multi-shipper parcels onto shared trailers, cutting unit freight costs 30-45%. Within the on-demand trucking market size context, algorithmic LTL applications already manage USD 18 billion of annual volume, chipping away at traditional hub-and-spoke carriers. AI engines factor dwell times, warehouse operating hours, and driver Hours-of-Service windows to avoid trans-shipment delays, making dynamic LTL viable even for fragile consumer electronics. Shippers previously wary of damage now accept consolidated moves because platforms audit packaging specs and assign secure positions inside trailers.
FTL remains indispensable for bulk commodities, agricultural products, and hazardous materials where single-load integrity is paramount. Yet even in FTL, spot-rate bookings via platforms are climbing, comprising 28% of long-haul loads in the United States during 2025. Many Fortune 100 manufacturers now split annual freight commitments 75% contracted, 25% digital spot to hedge both fuel volatility and volume unpredictability. That hybrid model keeps FTL share high but redefines engagement terms, ensuring repeated references to the on-demand trucking market continue across budgeting cycles without replacing dedicated contracts entirely.


By Vehicle Type: Urban Density Accelerates Light-duty Adoption
Heavy-duty trucks commanded 48.40% of the on-demand trucking market, yet urban parcel surges propel light-duty Class 1-3 vehicles to an 18.91% CAGR through 2031. Congestion tolls and low-emission zones in 38 global megacities incentivize smaller chassis able to navigate curbside drop-offs, while the rise of two-hour delivery pledges forces dense routing where gross payload matters less than stop count. Platforms allocate mixed fleets algorithmically, dispatching a light-duty van for downtown e-commerce orders and a tandem-axle Class 8 for a back-haul of pallets to suburban consolidation centers, thereby stretching the on-demand trucking market across diverse asset classes.
Medium-duty vehicles (Class 4-6) fill the regional gap, carrying perishables from regional cold stores to grocery cross-docks. Electrification pilots in the United States and Japan center on the medium segment because battery weight-to-payload ratios balance favorably. Meanwhile, the driver shortage bites hardest in heavy-duty, CDL-A-required segments with long time-away-from-home. Platforms remedy gaps by pre-booking tractor swaps at relay hubs every 400 miles, reducing overnight hauls and attracting a younger labor pool. Cross-reference with lower insurance bands for light vans also reveals why micro-fleets adopt Class 2 vehicles when entering the on-demand trucking market, a structural trend likely to persist beyond the forecast horizon.
By End User: E-commerce Volatility Drives Platform Dependency
E-commerce and Retail, already 35.13% of the on-demand trucking market share, show the fastest 19.94% CAGR as promotional flash sales, influencer-driven product drops, and returns logistics drive steady volatility. Platforms stretch capacity elastically, unlike dedicated fleets stuck with fixed tractor counts, letting merchants pay only for real-time demand within the broader on-demand trucking market. Industrial manufacturers apply similar logic during component shortages, diverting partial truckloads the moment upstream suppliers release back-orders, which keeps just-in-time lines humming without bloated safety stock. Food & Beverage shippers leverage temperature-controlled APIs that surface reefer availability in seconds, critical during salmonella recalls when product quarantines shuffle origin-destination pairs overnight.
Pharmaceutical and life-science companies increasingly rely on GDP-compliant carrier pools, where chain-of-custody and real-time temperature telemetry come pre-integrated. These high-value segments pay premiums yet seldom tolerate service lapses; on-demand platforms meeting 99.5% on-time metrics win multiyear contracts despite higher per-mile tariffs. Consumer Packaged Goods brands, pressured by retailer charge-backs for late deliveries, funnel seasonal surges into limited-edition soft drinks or holiday confectionery through the same platforms. As every vertical crosses thresholds for speed and traceability, the on-demand trucking market embeds deeper into procurement routines, gradually displacing legacy brokers that cannot provide end-to-end digital proofs of delivery.
Geography Analysis
Asia Pacific captured 41.25% of global volume in 2025 and is projected to grow 18.34% CAGR through 2031, underpinned by China’s bonded-warehouse e-commerce model that packs consolidated pallets for truck crossings into ASEAN. India’s National Logistics Policy synchronizes customs e-filing with freight platforms, shaving trans-border clearance from days to hours and further expanding the on-demand trucking market across the subcontinent. Urban congestion in Jakarta, Bangkok, and Manila incentivizes light-duty adoption, while government incentives for EV vans create early mover opportunities for platform-linked leasing pools.
Europe advances at mid-teens percentage growth as the Corporate Sustainability Reporting Directive elevates carbon-intensity thresholds that only algorithmic pooling can meet. Germany, France, and the Nordics embrace back-haul marketplaces that cut empty kilometers and help retailers report lower grams-CO₂ per parcel. Nonetheless, mandatory employment rules add cost layers that slow startup proliferation. Brexit complexities add another catalyst: platforms offering end-to-end customs automation secure an increasing United Kingdom-EU lane share, especially for high-mix fashion goods[3]European Commission, “Platform Work Directive,” europa.eu.
North America maintains digital leadership in ERP-embedded freight booking. Pre-built APIs inside SAP and Oracle TMS suites route more than 30,000 loads per day directly to platform spot boards. Yet the region feels the sharpest driver deficit, raising per-mile prices and pushing the on-demand trucking market toward autonomous pilots on I-10 and I-40 corridors. United States shippers also adopt usage-based cargo insurance fintechs for micro-fleets, expanding carrier pools but adding compliance overhead to validate insurance at load tender. Canada and Mexico court similar models as near-shoring reshapes cross-border freight flows, while rural broadband gaps still hamper real-time visibility in the Rocky Mountain states and northern Ontario.

Competitive Landscape
No single platform controls more than 8% of global loads, rendering the on-demand trucking market lowly concentrated. The top five players collectively hold just about 26%, yielding a market concentration score of 2. Investments flow into adjacent services, fuel cards, cargo insurance, and customs brokerage to deepen ecosystem stickiness and lift revenue per transaction. Embedded finance tools from Relay Payments allow carriers to advance invoices within hours, reducing churn and providing platforms with fee income.
Technology differentiation remains decisive. Platforms integrating AI price engines, ESG dashboards, and TMS/ERP connectors convert procurement inertia into automated repeat business. Compliance capabilities have become table stakes; providers that furnish verified Scope-3 footprints and GDPR-compliant data vaults rise on bid lists. Safety transparency, sourced from the Federal Motor Carrier Safety Administration’s SMS database, now appears as a filter within shipper dashboards[4]Federal Motor Carrier Safety Administration, “Safety Measurement System,” fmcsa.dot.gov.
Meanwhile, regional champions such as India’s BlackBuck and Brazil’s CargoX protect turf via language localization and micro-fleet onboarding programs that recognize informal operating models. M&A activity quickens as incumbents lacking engineering depth acquire algorithmic startups to compress development timelines. OEMs, sensing software’s margin potential, insert themselves through autonomous truck divisions that may ultimately bypass third-party marketplaces, signaling a future in which the on-demand trucking industry contends not only with fellow platforms but with equipment manufacturers owning both hardware and digital dispatch.
On-demand Trucking Industry Leaders
Uber Freight
C.H. Robinson
Full Truck Alliance (Manbang)
Sennder
J.B. Hunt 360
- *Disclaimer: Major Players sorted in no particular order

Recent Industry Developments
- March 2026: Uber announced a collaboration with Nissan and Wayve to develop and pilot robotaxi services, with a planned rollout in Tokyo by late 2026.
- February 2026: Sender acquired European Surface Transportation operations of C.H. Robinson. Strengthens its European full-truckload (FTL) network and shipper base.
- February 2026: Launch of AI Freight Procurement Agent. This tool automates freight sourcing by analyzing market conditions and carrier availability in real time.
- July 2025: DAT acquired Convoy Platform from Flexport for USD 250 million. Consolidation of digital freight platforms after Convoy’s shutdown.


Global On-demand Trucking Market Report Scope
| Full Truckload (FTL) |
| Less-than-Truckload (LTL) |
| Light-Duty Trucks (Class 1-3) |
| Medium-Duty Trucks (Class 4-6) |
| Heavy-Duty Trucks (Class 7-8) |
| E-commerce and Retail |
| Consumer Packaged Goods |
| Food and Beverage (incl. Cold-chain) |
| Healthcare and Pharma |
| Industrial and Manufacturing |
| Others |
| North America | United States |
| Canada | |
| Mexico | |
| South America | Brazil |
| Peru | |
| Chile | |
| Argentina | |
| Rest of South America | |
| Asia-Pacific | India |
| China | |
| Japan | |
| Australia | |
| South Korea | |
| Southeast Asia (Singapore, Malaysia, Thailand, Indonesia, Vietnam, and Philippines) | |
| Rest of Asia-Pacific | |
| Europe | United Kingdom |
| Germany | |
| France | |
| Spain | |
| Italy | |
| BENELUX (Belgium, Netherlands, and Luxembourg) | |
| NORDICS (Denmark, Finland, Iceland, Norway, and Sweden) | |
| Rest of Europe | |
| Middle East and Africa | United Arab Emirates |
| Saudi Arabia | |
| South Africa | |
| Nigeria | |
| Rest of Middle East and Africa |
| By Service Type | Full Truckload (FTL) | |
| Less-than-Truckload (LTL) | ||
| By Vehicle Type | Light-Duty Trucks (Class 1-3) | |
| Medium-Duty Trucks (Class 4-6) | ||
| Heavy-Duty Trucks (Class 7-8) | ||
| By End User | E-commerce and Retail | |
| Consumer Packaged Goods | ||
| Food and Beverage (incl. Cold-chain) | ||
| Healthcare and Pharma | ||
| Industrial and Manufacturing | ||
| Others | ||
| By Geography | North America | United States |
| Canada | ||
| Mexico | ||
| South America | Brazil | |
| Peru | ||
| Chile | ||
| Argentina | ||
| Rest of South America | ||
| Asia-Pacific | India | |
| China | ||
| Japan | ||
| Australia | ||
| South Korea | ||
| Southeast Asia (Singapore, Malaysia, Thailand, Indonesia, Vietnam, and Philippines) | ||
| Rest of Asia-Pacific | ||
| Europe | United Kingdom | |
| Germany | ||
| France | ||
| Spain | ||
| Italy | ||
| BENELUX (Belgium, Netherlands, and Luxembourg) | ||
| NORDICS (Denmark, Finland, Iceland, Norway, and Sweden) | ||
| Rest of Europe | ||
| Middle East and Africa | United Arab Emirates | |
| Saudi Arabia | ||
| South Africa | ||
| Nigeria | ||
| Rest of Middle East and Africa | ||


Key Questions Answered in the Report
How fast is Asia Pacific growing in on-demand trucking?
Asia Pacific is forecast to post an 18.34% CAGR through 2031, driven by cross-border e-commerce exports and customs-integrated booking interfaces.
Which service type is rising quickest?
Less-than-Truckload bookings grow 17.23% CAGR because consolidation algorithms cut per-shipment costs while improving load factors.
What role do Scope-3 rules play?
Mandatory disclosure of freight emissions pushes shippers to choose platforms that slash empty miles and provide verifiable carbon dashboards.
Why are light-duty trucks gaining share?
Urban delivery restrictions and short-haul parcel surges favor agile Class 1-3 vehicles, supporting an 18.91% CAGR in that fleet category.
How severe is the driver shortage?
North America may face a 160,000-driver deficit by 2031, reducing available capacity and elevating on-demand platform premiums.
Which technology speeds enterprise adoption?
ERP-embedded “Instant Truck Book” APIs from major TMS vendors enable sub-minute capacity allocation without manual data entry.
Page last updated on:


