Europe E-commerce Warehouse Market Size and Share
Market Overview
| Study Period | 2020 - 2031 |
|---|---|
| Forecast Data Period | 2026 - 2031 |
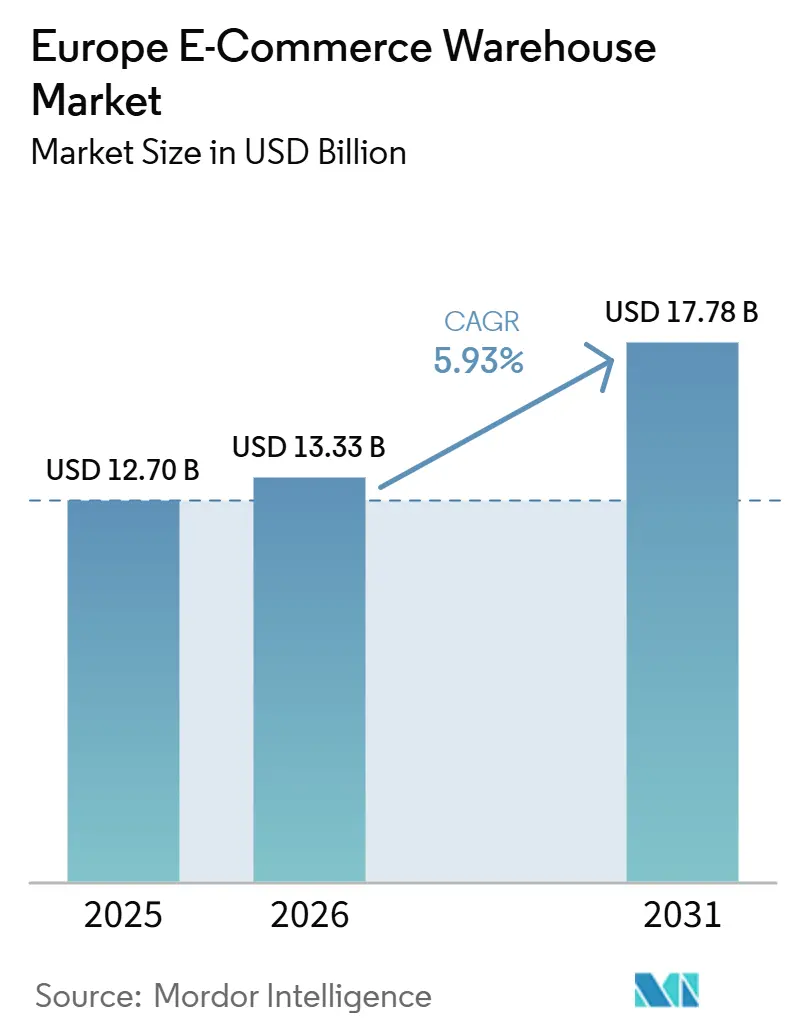
| Base Year Market Size (2025) | USD 12.70 Billion |
| Market Size (2026) | USD 13.33 Billion |
| Market Size (2031) | USD 17.78 Billion |
| Growth Rate (2026 - 2031) | 5.93% CAGR |
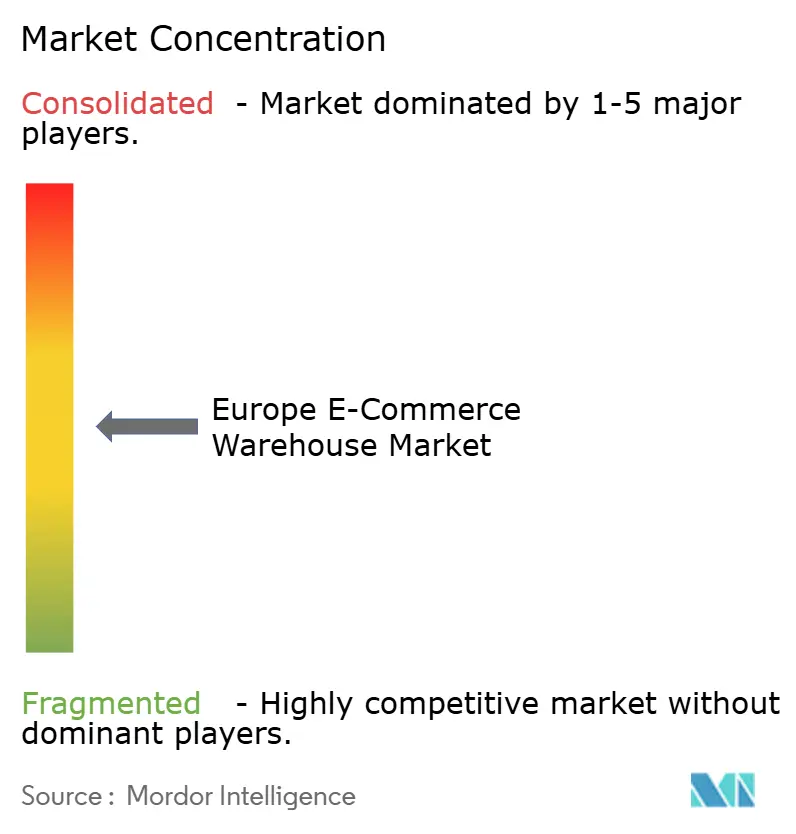
| Market Concentration | Medium |
Major Players *Disclaimer: Major Players sorted in no particular order Image © Mordor Intelligence. Reuse requires attribution under CC BY 4.0. | |
Europe E-commerce Warehouse Market Analysis by Mordor Intelligence
The Europe E-commerce Warehouse Market size is projected to be USD 12.7 billion in 2025, USD 13.33 billion in 2026, and reach USD 17.78 billion by 2031, growing at a CAGR of 5.93% from 2026 to 2031.
Compliance-driven capital spending tied to the Digital Product Passport regulation is now the primary growth engine, forcing operators to embed item-level traceability rather than simply adding floor space. Urban live-commerce models are shifting network design toward smaller, closer-in sites that can meet 30-minute delivery promises. Semi-automated facilities dominate today, yet 5G private networks are lowering the cost of full automation retrofits across brownfield buildings. Subscription-based rental models are removing balance-sheet barriers for mid-size retailers and accelerating competitive churn. The ability to align technology, cyber-security, and Scope-3 decarbonization objectives is emerging as the decisive advantage in the Europe E-commerce Warehouse Market.
Key Report Takeaways
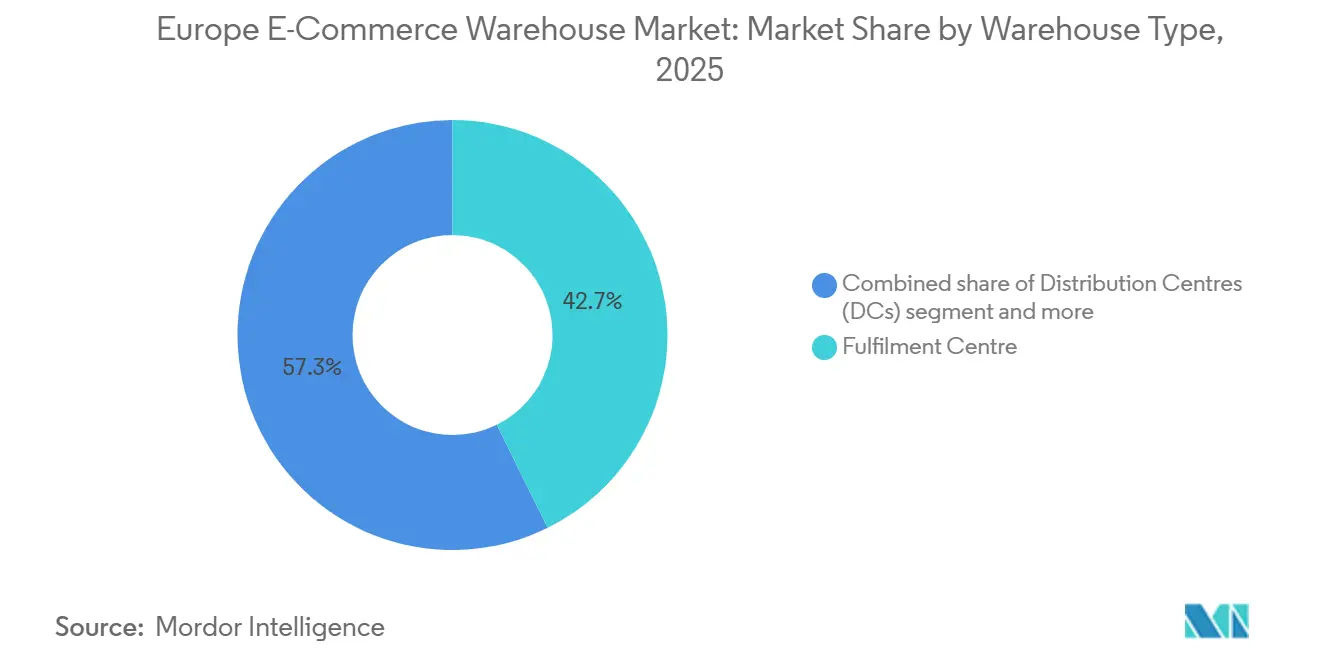
- By warehouse type, fulfillment centers captured 42.7% of the Europe E-commerce Warehouse Market share in 2025, while dark stores and micro-fulfillment centers are forecast to grow at 11.17% CAGR through 2031.
- By service type, storage accounted for 50.51% of the Europe E-commerce Warehouse Market size in 2025, whereas picking and packing is set to expand at 10.64% CAGR up to 2031.
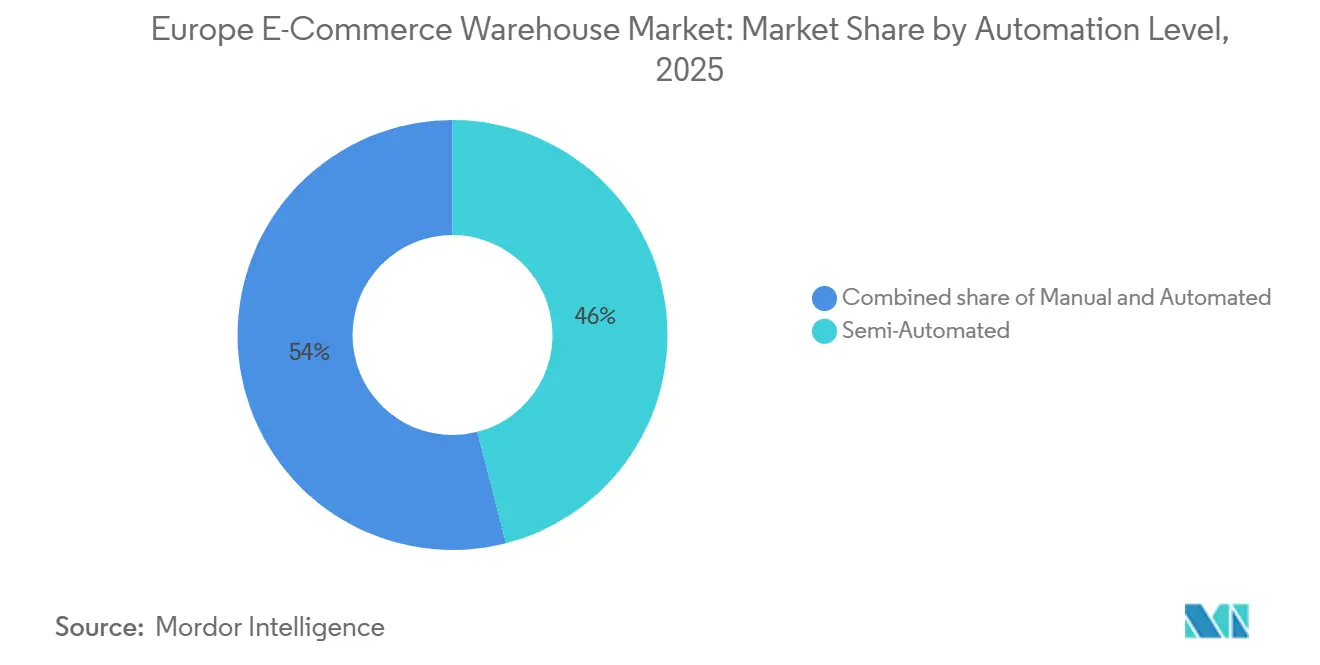
- By automation level, semi-automated sites held 46% of the market in 2025, and fully automated warehouses are projected to rise at 10.25% CAGR between 2026 and 2031.
- By end-user industry, apparel and footwear led with a 25.92% share in 2025, grocery and FMCG are advancing at a 10.75% CAGR to 2031.
- By geography, Germany commanded 15.04% of 2025 revenue, while Poland is poised for the fastest 8.72% CAGR during 2026-2031.
Note: Market size and forecast figures in this report are generated using Mordor Intelligence’s proprietary estimation framework, updated with the latest available data and insights as of January 2026.
Europe E-commerce Warehouse Market Trends and Insights
Drivers Impact Analysis*
| Drivers | (~) % Impact on CAGR Forecast | Geographic Relevance | Impact Timeline |
|---|---|---|---|
| EU Digital Product Passport spurring serialization-ready fulfillment hubs | +0.9% | EU-wide, early adoption in France, the Netherlands, and Germany | Medium term (2-4 years) |
| Live-commerce boom compressing order cycles, boosting micro-FC roll-outs | +0.8% | Urban centers in Western Europe, expanding to Eastern capitals | Short term (≤ 2 years) |
| Southern-Europe e-grocery surge accelerating refrigerated cross-docks | +0.7% | Spain, Italy, Greece, Portugal, with spillover to Southern France | Short term (≤ 2 years) |
| Scope-3 decarbonization fueling demand for rail-integrated freight villages | +0.6% | Germany, Poland, Netherlands, Belgium rail corridors | Long term (≥ 4 years) |
| 5G private networks enabling AMR retrofits of inner-city brownfield sites | +0.5% | Metropolitan areas across the EU | Medium term (2-4 years) |
| Subscription-based rental models driving refurbishment and reverse hubs | +0.4% | UK, Germany, Nordics, Benelux | Long term (≥ 4 years) |
| Source: Mordor Intelligence | |||
EU Digital Product Passport Spurring Serialization-Ready Fulfillment Hubs
The Digital Product Passport, effective from 2026, obliges every product sold in the bloc to carry a digital file that follows the item through its life cycle.[1]European Commission, “Single Market for Green Products,” commission.europa.eu Warehouses must now support RFID, blockchain, and API-based data exchange, shifting investment from racking to information systems. Early movers such as CEVA Logistics are already installing item-level scanners and cloud connectors that future-proof capacity. Operators unable to meet the new standard risk customer defection as brands migrate to compliant networks. Demand for dedicated reverse-logistics hubs is rising in tandem because returned items must retain their digital identity during refurbishment and resale.
Live-Commerce Boom Compressing Order Cycles, Boosting Micro-FC Roll-Outs
Influencer-led live-commerce sessions have reset consumer expectations from next-day to same-hour delivery. Operators are converting basements, parking decks, and idle retail units into micro-fulfillment centers that sit within five kilometers of dense customer clusters. Modular automation from AutoStore and Exotec allows 5,000-square-meter sites to match the throughput of legacy mega-centers. Retailers such as Jumbo have proven the model, processing live-commerce spikes without adding labor. Inventory planning now relies on AI routines that preload popular SKUs before livestream events begin, minimizing out-of-stock risk.[2]Swisslog, “Micro Fulfillment: The Next Frontier,” swisslog.com
Southern-Europe E-Grocery Surge Accelerating Refrigerated Cross-Docks
E-grocery penetration in Spain, Italy, and Greece doubled in two years, triggering a wave of refrigerated cross-dock projects near Barcelona, Milan, and Athens. These facilities consolidate supplier loads, maintain cold-chain integrity, and dispatch mixed-temperature orders for last-mile delivery. Automated case handling, as used by Coop Norge, is being replicated to cut labor per order. Hot Mediterranean summers place extra strain on refrigeration plants, pushing operators toward insulated cladding and solar-powered chillers to curb energy bills. Regulatory food-safety audits further raise the bar on real-time temperature monitoring.
Scope-3 Decarbonization Fueling Demand for Rail-Integrated Freight Villages
Retailers must now count upstream transport emissions in their Scope-3 disclosures, elevating rail-served logistics parks from nice-to-have to strategic asset. Projects along the Rhine-Danube and North Sea-Baltic corridors are attracting green loans, such as the USD 275 million facility extended to WDP by the European Investment Bank. Rail cuts line-haul emissions by roughly 75% per ton-kilometer compared with trucking, yet transshipment capacity is the bottleneck.[3]European Investment Bank, “EIB Finances Green Logistics with WDP,” eib.org Developers are adding automated crane yards and container shuttles to clear that hurdle. Freight slot reservation systems in the Netherlands are also improving schedule reliability for shippers that commit volumes.
Restraints Impact Analysis*
| Restraints | (~) % Impact on CAGR Forecast | Geographic Relevance | Impact Timeline |
|---|---|---|---|
| NIS2 cybersecurity compliance inflating IT costs for SME operators | -0.4% | EU-wide, strongest on smaller 3PLs | Short term (≤ 2 years) |
| Shortfall of recycled materials delaying Level(S)-compliant builds | -0.3% | New projects across the EU | Medium term (2-4 years) |
| Euro VII truck standards raising first and last-mile fleet costs | -0.25% | Urban low-emission zones in Western Europe | Medium term (2-4 years) |
| Night-time traffic caps curbing utilization of 24/7 urban facilities | -0.2% | Major metropolitan areas | Long term (≥ 4 years) |
| Source: Mordor Intelligence | |||
NIS2 Cyber-Security Compliance Inflating IT Costs for SME Operators
Compliance-driven spending on Digital Product Passports and item-level traceability is now the primary growth engine for European e-commerce warehousing, forcing a shift from simple expansion toward high-tech, urban micro-fulfillment sites capable of meeting 30-minute delivery demands. This transition is supported by EUR 250 million (USD 288.02 million) green facilities from the European Investment Bank to major players such as WDP, enabling the integration of rail-served logistics and 5G-powered automation to slash Scope-3 emissions by up to 75% compared to road transport. However, the NIS2 Directive is significantly inflating IT overhead, with compliance costs for mid-sized firms often exceeding EUR 500,000 (USD 0.57 million) and siphoning capital away from physical automation. As a result, a persistent shortage of over 274,000 cybersecurity professionals in the EU is accelerating market consolidation, as smaller family-owned 3PLs seek buy-outs from larger groups that can absorb these regulatory and technical burdens.
Shortfall of Recycled Materials Delaying Level(S)-Compliant Builds
EU Level(S) rules assess embodied carbon and recycled content for every new warehouse. Demand for recycled steel outstrips local supply by nearly one-third, forcing developers to import or wait. Projects targeting BREEAM Outstanding ratings often slip by six to nine months while material contracts finalize. Costs climb 15-25% when low-carbon concrete and reclaimed timber are mandatory. Developers respond with long-term offtake deals and on-site crushing plants that turn demolition waste into structural fill, yet both strategies extend payback periods.
*Our forecasts treat driver/restraint impacts as directional, not additive. The impact forecasts reflect baseline growth, mix effects, and variable interactions.
Segment Analysis
By Warehouse Type: Fulfillment Center Maturity Meets Micro-FC Disruption
Fulfillment centers commanded 42.7% of the Europe E-commerce Warehouse Market share in 2025. They anchor retailer networks for national coverage and bulk inventory holding. However, live-commerce and rapid-delivery models are steering capital to dark stores and micro-fulfillment centers, the fastest-growing category at 11.17% CAGR through 2031. These 2,000-5,000 square-meter facilities operate within dense city cores and rely on goods-to-person robotics that triple pick rates. Colruyt’s Collect&Go project raised productivity 35% in a compact site, showing scalability for general merchandise.
The operational gamble is whether to defend hub-and-spoke economics or embrace distributed proximity. High-margin verticals such as electronics now favor micro-sites that can stage flash-sale inventory two kilometers from buyers. Bulk goods and seasonal items remain in mega-shed fulfillment centers that still benefit from space economies and rail siding access. This dual structure keeps the Europe E-commerce Warehouse Market balanced between scale and speed.


By Service Type: Storage Commoditization Accelerates Value-Added Migration
Storage held 50.51% of the Europe E-commerce Warehouse Market size in 2025, yet it is sliding toward utility status within the Europe E-commerce Warehouse Market. Picking and packing, projected to grow 10.64% CAGR, is where differentiation lives. Operators like Wincanton use modular robotics to raise pick rates fivefold and guarantee two-hour cut-offs for order dispatch. Growing Digital Product Passport compliance embeds serialization and kitting into standard flows, turning what was once value-added into table stakes.
Outcome-based contracts are replacing pallet storage fees. Retailers pay for order accuracy and cycle time, rewarding those 3PLs that overlay AI slotting tools and machine-vision QC stations. Low-margin storage specialists risk displacement unless they climb the service ladder.
By Automation Level: Semi-Automated Dominance Faces 5G-Enabled Disruption
Semi-automated warehouses represented 46% the Europe E-commerce Warehouse Market size in 2025, balancing capital intensity and flexibility. Fully automated sites will rise at 10.25% CAGR as 5G networks cut control latency and enable autonomous mobile robots across older buildings. AutoStore retrofits show 300% storage density lifts without new construction, a compelling ROI for urban sites where land prices spike. Manual handling survives for oversized or fragile SKUs, yet even returns areas are piloting cobots.
Cybersecurity mandates also tilt the Europe E-commerce Warehouse Market toward automation because human error drives data breaches. Operators now pitch robots not just on labor savings but on risk reduction, an argument that resonates with regulated verticals.
By End-User Industry: Apparel Maturity Contrasts with Grocery Acceleration
Apparel and footwear contributed 25.92% of the Europe E-commerce Warehouse Market share in 2025, by virtue of SKU complexity and high returns. Quick-turn fashion players depend on item-level sorting and photo-based QC that only tech-heavy sites can offer. Grocery and fast-moving consumer goods outpace all others at 10.75% CAGR as Southern European supermarkets race online. Mechanized distribution centers like Jumbo’s in the Netherlands illustrate the automation needed to keep chilled orders error-free.
Consumer electronics stay steady, tied to launch calendars and warranty swap flows, while pharmaceuticals lean on temperature control and serial tracking. Furniture and homewares test operators with weight and volume, driving demand for lift-assisted pick stations and two-person load protocols.
Geography Analysis
Germany generated 15.04% of Europe E-commerce Warehouse Market revenue in 2025, yet land scarcity near the Rhine-Ruhr and Berlin hubs limits fresh capacity. The market now pivots to retrofit opportunities, especially in class-B buildings that can host AMRs after 5G upgrades. Operators also chase tax-advantaged renewable investments to meet customer Scope-3 targets.
Poland is the growth engine at an 8.72% CAGR through 2031. Over 35 million square meters of modern stock and east-west rail corridors draw regional hubs from brands like Otto Group, which invested USD 286 million in an Ilowa site loaded with AI and robotics. Competitive operating costs and fast permitting accelerate project cycles compared with Western Europe.[4]Europa Property, “Polish Warehouse Stock Tops 35 Million m²,” europaproperty.com
The United Kingdom, France, and the Netherlands are mature but modernization-focused. Brexit complexity pushes UK warehouses to bolster customs automation, while Dutch ports integrate warehouse-rail connectivity for green corridors. Southern Europe sees cold-chain demand surge around Barcelona and Milan as e-grocery adoption spikes. Nordic markets prioritize low-carbon builds using recycled steel, advancing level compliance faster than the bloc average.
Competitive Landscape
The Europe E-commerce Warehouse Market shows moderate concentration that is tightening through mega-deals. DSV’s USD 15.7 billion purchase of DB Schenker creates a logistics giant with USD 46.5 billion in sales, unlocking network synergies that smaller rivals cannot match. GXO’s USD 953 million acquisition of Wincanton brings aerospace and healthcare contracts and seeds automation know-how across the enlarged footprint.
Competition now hinges on technology rollouts rather than sheer cubic space. GXO, DHL Supply Chain, and CEVA invest in robotics control towers that optimize fleets of AMRs across multiple buildings. Mid-tier challengers focus on niches: pharmaceutical serial warehouses, subscription-commerce reverse hubs, and refrigerated cross-docks in Southern Europe. Zenfulfillment’s merger with Alaiko targets mid-market webshops with pay-per-order pricing that converts fixed costs into variable.
Capital providers reward ESG credibility. The European Investment Bank finances solar roofs and EV charging networks that raise property attractiveness to blue-chip tenants. Private equity groups back automation specialists offering turnkey micro-FCs that let grocers trial 15-minute delivery without owning assets. As consolidation continues, bargaining power tilts toward tenants that can bundle volume across several countries, reinforcing the strategic importance of cross-border networks.
Europe E-commerce Warehouse Industry Leaders
GXO Logistics
ID Logistics
DHL Group
DSV A/S
CMA CGM Group (Including CEVA Logistics)
- *Disclaimer: Major Players sorted in no particular order

Recent Industry Developments
- March 2026: CEVA launched a specialized maritime reverse-logistics service to securely transport used lithium-ion and EV batteries into mainland Europe for compliance-driven recycling.
- June 2025: GXO launched "GXO IQ," an industry-first AI platform utilizing Google Cloud and Snowflake to orchestrate and optimize complex e-commerce warehouse operations.
- April 2025: DSV completed its USD 15.7 billion acquisition of DB Schenker, forecasting USD 1 billion in annual synergies by 2028.
- April 2025: GXO Logistics finalized its USD 953 million takeover of Wincanton, targeting USD 57 million in yearly savings within three years.


Europe E-commerce Warehouse Market Report Scope
| Fulfilment Centres |
| Distribution Centres (DCs) |
| Cold-Chain Warehouses |
| Dark Stores / Micro-Fulfillment Centers |
| Others (Reverse Logistics Hubs, Bonded Warehouses, Hybrid-use Spaces, etc.) |
| Storage |
| Picking & Packing |
| Value-Added Services and Others (Kitting, Labelling) |
| Manual |
| Semi-Automated |
| Automated |
| Apparel and Footwear |
| Consumer Electronics |
| Grocery and FMCG |
| Pharmaceuticals, Beauty and Wellness |
| Home Essentials and Furnishings |
| Others |
| Germany |
| United Kingdom |
| France |
| Netherlands |
| Spain |
| Italy |
| Poland |
| Sweden |
| Belgium |
| Russia |
| Rest of Europe |
| By Warehouse Type | Fulfilment Centres |
| Distribution Centres (DCs) | |
| Cold-Chain Warehouses | |
| Dark Stores / Micro-Fulfillment Centers | |
| Others (Reverse Logistics Hubs, Bonded Warehouses, Hybrid-use Spaces, etc.) | |
| By Service Type | Storage |
| Picking & Packing | |
| Value-Added Services and Others (Kitting, Labelling) | |
| By Automation Level | Manual |
| Semi-Automated | |
| Automated | |
| By End-User Industry | Apparel and Footwear |
| Consumer Electronics | |
| Grocery and FMCG | |
| Pharmaceuticals, Beauty and Wellness | |
| Home Essentials and Furnishings | |
| Others | |
| By Country | Germany |
| United Kingdom | |
| France | |
| Netherlands | |
| Spain | |
| Italy | |
| Poland | |
| Sweden | |
| Belgium | |
| Russia | |
| Rest of Europe |


Key Questions Answered in the Report
How fast is the Europe E-commerce Warehouse Market expected to grow?
The market is projected to expand from USD 12.7 billion in 2025 to USD 17.8 billion by 2031, representing a 5.93% CAGR.
Which warehouse type dominates today?
Fulfillment centers lead with 42.7% of 2025 revenue, though micro-fulfillment centers are catching up quickly.
Why is Poland attracting so much new capacity?
Poland offers competitive costs, available land, and strategic rail corridors, leading to an 8.72% CAGR forecast through 2031.
How are operators addressing Scope-3 emissions?
Many developers now favor rail-integrated freight villages and invest in solar roofs and EV fleets to curb transport-related carbon.
What impact will Euro VII have on fleet strategies?
The standard compels costly retrofits or electric upgrades for delivery fleets, raising first and last-mile operating expenses.
What regulation is reshaping traceability requirements?
The EU Digital Product Passport, effective from 2026, forces item-level serialization throughout the supply chain.
Page last updated on:


