Chemical Warehousing Market Size and Share
Market Overview
| Study Period | 2020 - 2031 |
|---|---|
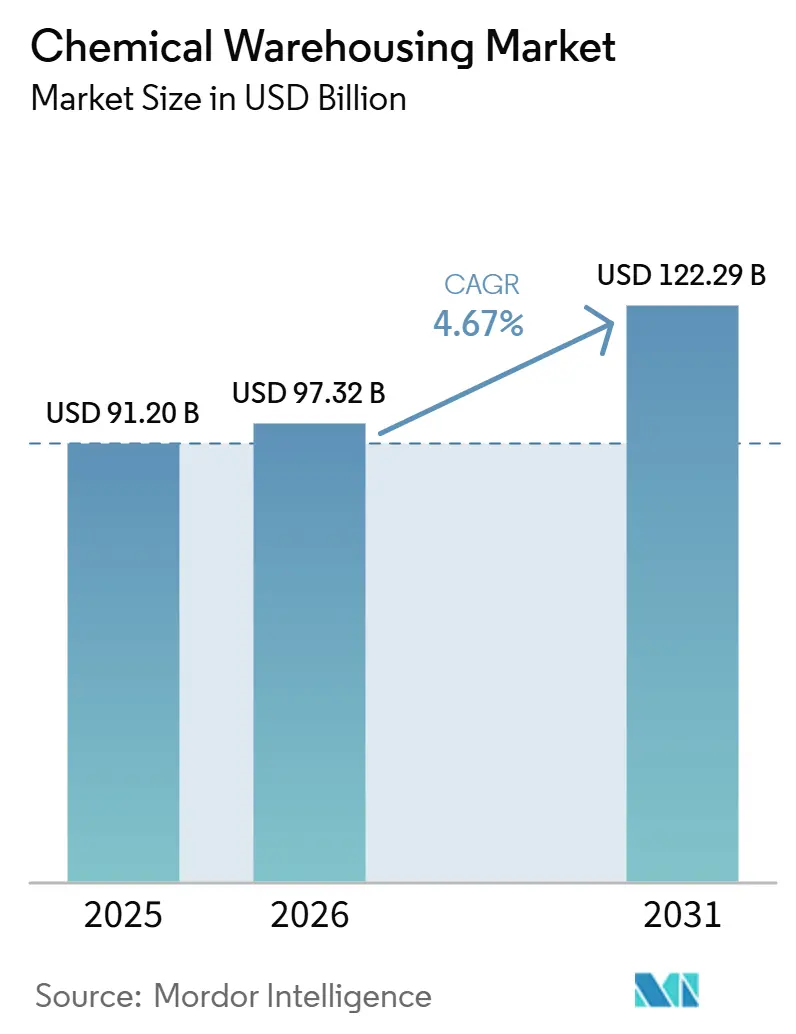
| Market Size (2026) | USD 97.32 Billion |
| Market Size (2031) | USD 122.29 Billion |
| Growth Rate (2026 - 2031) | 4.67% CAGR |
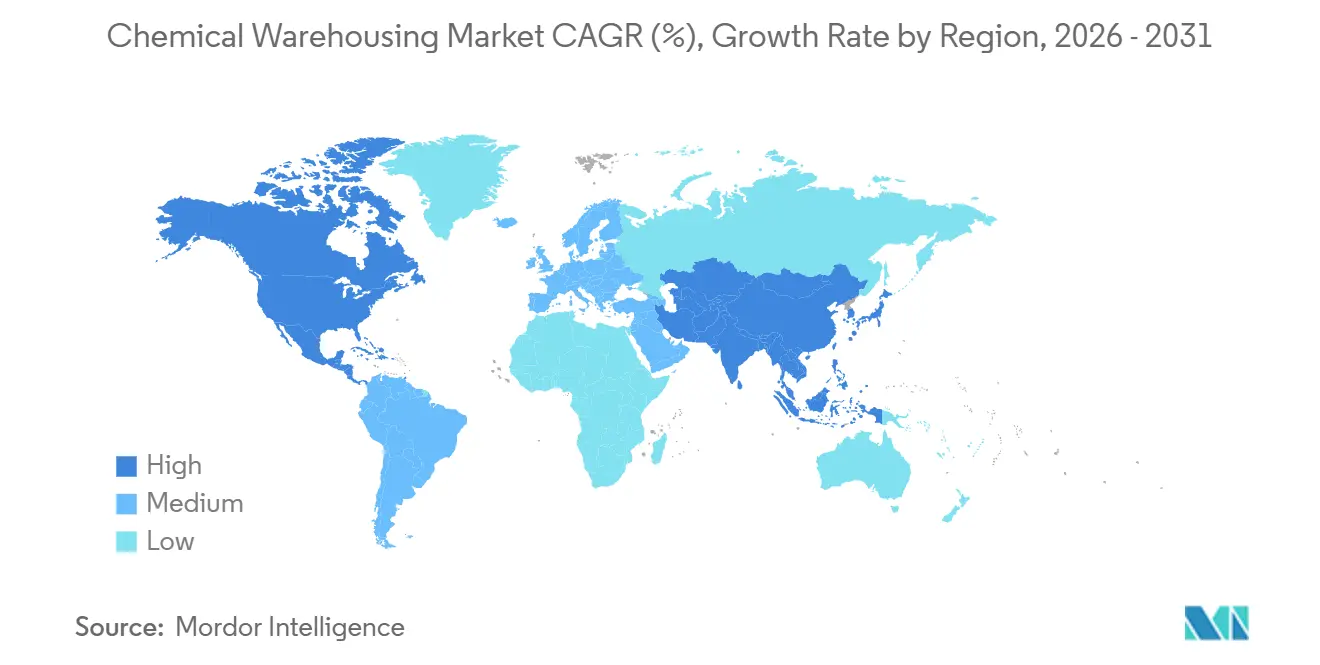
| Fastest Growing Market | Asia Pacific |
| Largest Market | Asia Pacific |
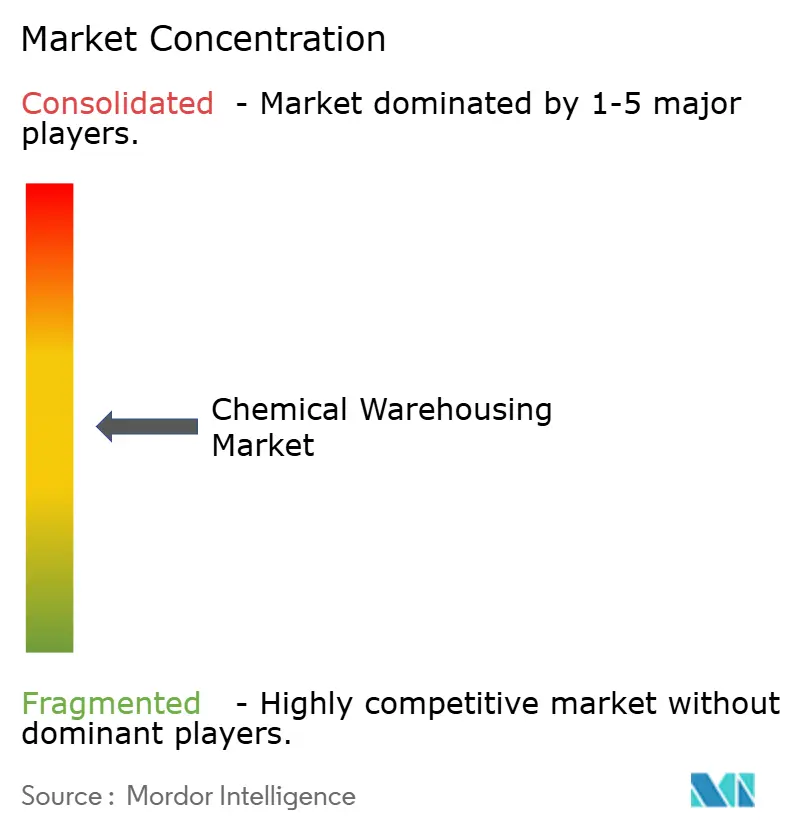
| Market Concentration | Medium |
Major Players *Disclaimer: Major Players sorted in no particular order Image © Mordor Intelligence. Reuse requires attribution under CC BY 4.0. | |
Chemical Warehousing Market Analysis by Mordor Intelligence
The Chemical Warehousing Market size is expected to increase from USD 91.20 billion in 2025 to USD 97.32 billion in 2026 and reach USD 122.29 billion by 2031, growing at a CAGR of 4.67% over 2026-2031.
The outlook reflects a steady shift from volume-driven buildouts to compliance-heavy facilities that can manage hazardous segregation, temperature control, and pharma-grade handling under tighter safety rules. Operators are investing in digital traceability and IoT monitoring to align with requirements in HAZMAT, cold chain, and serialized pharma distribution, raising the bar for new entrants. Trade disruptions and logistics volatility have encouraged buffer inventories for critical intermediates, which reinforces the role of compliant storage near ports and production clusters. North America sustains leadership due to mature OSHA, EPA, and DSCSA frameworks, while Asia-Pacific accelerates on the back of new petrochemical and specialty capacity that introduces immediate warehousing needs before downstream offtake or export.
Key Report Takeaways
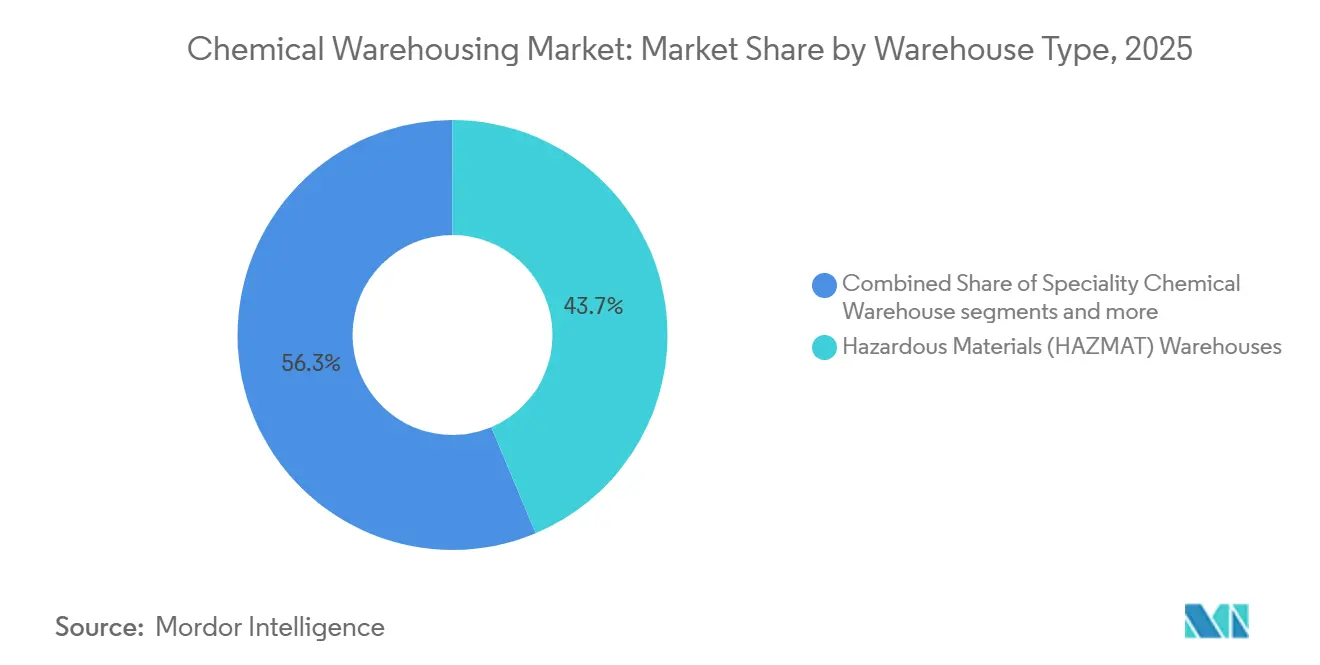
- By warehouse type, hazardous materials facilities led with 43.67% market share in 2025 of the chemical warehousing market size, while temperature-controlled warehouses are projected to grow at a 6.32% CAGR through 2031.
- By chemical type, flammable liquids accounted for 36.21% share in 2025, and toxic substances are forecast to expand at a 6.81% CAGR to 2031.
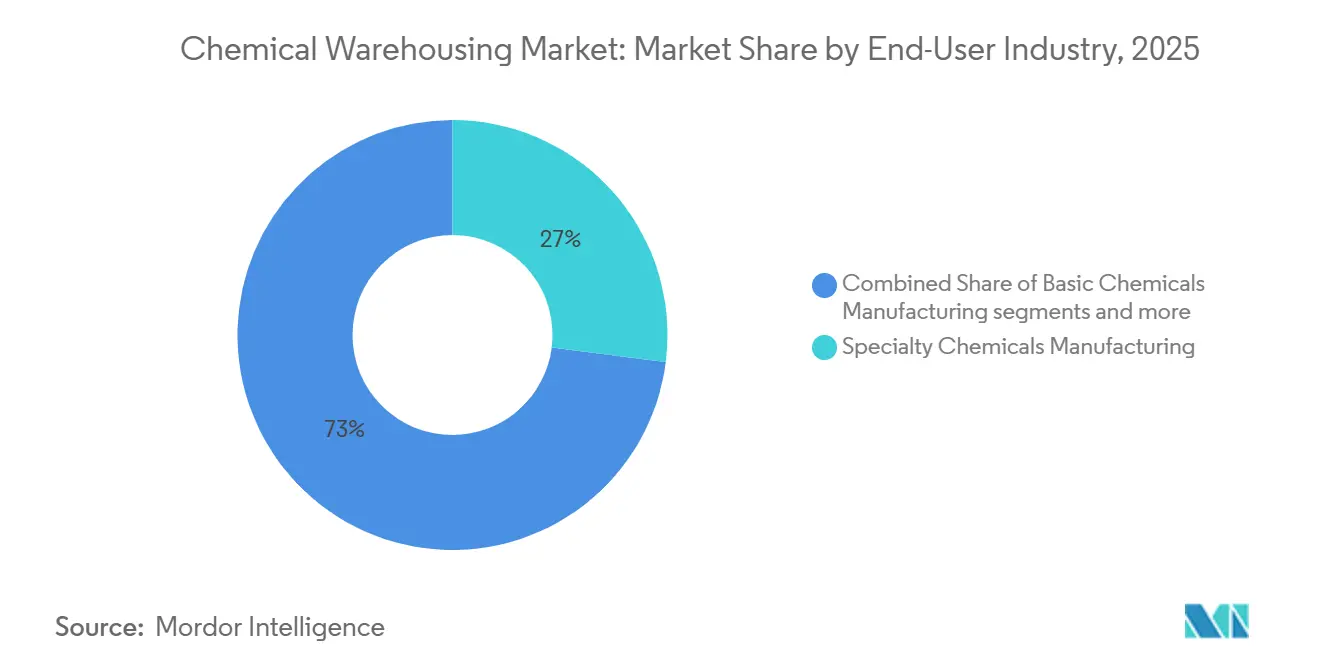
- By end-user industry, specialty chemicals manufacturing held 26.74% share in 2025 of the chemical warehousing market, and pharmaceuticals and life sciences are projected to register a 7.21% CAGR through 2031.
- By geography, Asia-Pacific held 34.90% of the chemical warehousing market share in 2025, and is projected to record the fastest regional CAGR at 5.87% through 2031.
Note: Market size and forecast figures in this report are generated using Mordor Intelligence’s proprietary estimation framework, updated with the latest available data and insights as of January 2026.
Global Chemical Warehousing Market Trends and Insights
Drivers Impact Analysis*
| Driver | (~) % Impact on CAGR Forecast | Geographic Relevance | Impact Timeline |
|---|---|---|---|
| Asia-Pacific Chemical Manufacturing Capacity Expansion | +1.3% | China, India, Southeast Asia (Malaysia, Singapore, Thailand), with spillover to Middle East (Saudi Arabia) | Medium term (2–4 years) |
| Growth of Contract Manufacturing in Emerging Economies | +0.9% | India (API), China (specialty chemicals), Southeast Asia (agrochemical intermediates), with demand pull from North America and Europe | Medium term (2–4 years) |
| Increasing Global Trade of Hazardous Chemicals | +0.8% | Global, with concentration in Asia-Europe corridors via Middle Corridor (Kazakhstan, Azerbaijan, Georgia), Red Sea alternate routes | Short term (≤ 2 years) |
| Pharmaceutical Intermediates Production Surge | +1.1% | India, China, Europe (INEOS Lavera, France), United States (Cambrex Charles City, IA), with regulatory pull from FDA and EMA | Long term (≥ 4 years) |
| Agricultural Chemicals Seasonal Storage Requirements | +0.6% | India (Gujarat, Maharashtra), Southeast Asia (Thailand, Vietnam), Brazil, Argentina, United States Midwest | Medium term (2–4 years) |
| Battery Chemical Production Boom for Electric Vehicles | +1.0% | China, South Korea, United States, Canada (Electra cobalt sulfate refinery), Europe (battery-grade electrolyte storage) | Long term (≥ 4 years) |
| Source: Mordor Intelligence | |||
Asia-Pacific Chemical Manufacturing Capacity Expansion Drives Regional Warehousing Demand
New polypropylene and polyethylene capacity coming online in China during 2026 intensifies short-term storage needs for intermediates and packaging resins, reinforcing demand for compliant facilities that can stage inventory during commissioning and market ramp-up. Policy direction under China’s next five-year plan emphasizes energy efficiency and emission performance, which increases the value of certified warehouses able to demonstrate advanced safety, containment, and sustainability credentials to remain within regulatory guardrails[1]Mysteel, “China’s 15th Five-Year Plan: From Capacity Expansion to Cost-Driven Restructuring in Refining and Chemicals,” Mysteel, mysteel.net. India’s budgetary allocation for three dedicated Chemical Parks includes common warehousing, signaling that integrated clusters will shorten project lead times and bring testing, treatment, and storage under one roof. Co-location with petrochemical and specialty hubs such as Dahej reduces dwell time and enables intermodal connections, creating a practical edge for operators that embed within such ecosystems to capture sustained throughput. Together, these elements lift the chemical warehousing market by combining production momentum with infrastructure, standards, and cluster economics that elevate warehouse utilization and pricing power.
Pharmaceutical Intermediates Production Surge Elevates Compliance-Driven Storage Standards
Pharma-grade intermediates, vaccines, insulins, and biologics require stringent temperature control within 2-8°C or in ultra-cold environments for certain modalities, moving warehousing toward purpose-built cold chain nodes with calibrated equipment and mapped temperature zones. The U.S. DSCSA serialization regime pushes warehouses to integrate EPCIS data exchange and unit-level identifiers, with enforcement milestones extending into 2026 and penalties for non-compliance, which raises the digital baseline for operators that serve dispensers and wholesalers. The European Medicines Agency has resumed on-site GDP inspections after pandemic-era extensions, which elevates scrutiny on calibration, deviation handling, and audit documentation across cold chain storage. These procedural steps increase capital intensity and operating discipline, consolidating more sensitive loads with providers that can pass audits and maintain robust SOPs under real-world temperature variability. As a result, higher standards and serialized traceability strengthen the position of established cold chain players within the chemical warehousing market, particularly in North America and Europe, where enforcement is rigorous.
Battery Chemical Production Boom for Electric Vehicles Reshapes Lithium Supply Chain Infrastructure
Rising demand for lithium salts and electrolytes used in EVs and stationary storage is realigning upstream and downstream storage practices, including stockpiling in price-volatile phases and inert-atmosphere warehousing for highly hygroscopic electrolyte salts. Price spikes for key inputs have encouraged producers and converters to hold inventory buffers awaiting better pricing or to avoid stockouts, which supports higher throughput for specialized HAZMAT and temperature-controlled zones inside compliant facilities. New infrastructure in the Middle East exemplifies this pivot, where a dedicated chemicals port in Al Ruwais is slated to support large-scale shipments of methanol, low-carbon ammonia, and caustic soda that feed battery precursor chains into Asia-Pacific. Compliance is tightening for advanced batteries, with PHMSA harmonization introducing specific UN entries and air-transport state-of-charge constraints that warehouses must operationalize in documentation and handling workflows. These changes create favorable conditions for operators fluent in electrochemical materials, HAZMAT classifications, and environmental controls to win share as EV and storage adoption expands.
Increasing Global Trade of Hazardous Chemicals Intensifies Port-Proximate Storage Demand
Oversupply in base chemicals has increased export flows out of Asia, which boosts tank terminal and depot activity near major shipping corridors where HAZMAT handling needs to be both compliant and fast. Export inflection points for materials like polypropylene and PVC have shifted import patterns into South and Southeast Asia, and this strengthens the case for more dangerous goods storage capacity around expanding ports. Geopolitical risk has elevated the value of strategic stockpiles for feedstocks and intermediates, especially near chokepoints where a single disruption can cascade across downstream sectors. European warehousing cost structures have also felt the impact of elevated container rates and rerouting needs, which have driven longer-term storage contracts at premium prices to lock in availability and reduce volatility. Alignment with updated ADR-related enforcement in the EU now requires tighter pre-dispatch checks and unified documentation standards, which shifts workflow design inside last-mile warehouses serving cross-border runs.[2]U.S. Federal Register, “Hazardous Materials: Harmonization With International Standards,” PHMSA, federalregister.gov
Restraints Impact Analysis*
| Restraint | (~) % Impact on CAGR Forecast | Geographic Relevance | Impact Timeline |
|---|---|---|---|
| Geopolitical Tensions Disrupting Cross-Border Chemical Movements | -0.9% | Middle East (Strait of Hormuz), Red Sea corridor, Ukraine-Russia border, U.S.-China trade lanes | Short term (≤ 2 years) |
| High Operational Complexity in Multi-Country Storage Networks | -0.6% | Global, with acute pressure in fragmented regulatory zones (EU REACH vs. U.S. TSCA vs. Asia K-REACH/CSCL) | Medium term (2–4 years) |
| Limited Availability of Specialized Tank Storage Capacity | -0.5% | Singapore Jurong Island, Rotterdam/Antwerp (Europe), Houston Ship Channel (U.S.), coastal China/Japan | Medium term (2–4 years) |
| Competition from Direct Manufacturer-to-Consumer Shipments | -0.4% | North America (chemical nearshoring), China (domestic distribution), Europe (short-haul bulk) | Long term (≥ 4 years) |
| Source: Mordor Intelligence | |||
Geopolitical Tensions Disrupting Cross-Border Chemical Movements Constrain Inventory Optimization
Blockades and conflict-driven rerouting have raised fuel price benchmarks and doubled key energy references in compressed timelines, forcing chemical distributors to build larger inventory buffers and reduce throughput flexibility in the near term. Price surcharges from major producers and adjustments across polymers and solvents have widened working capital needs that sit on warehouse floors, which tightens available space for dynamic flows. Extended routing around the Cape and delayed sailing have created bursts of congestion and rate spikes that can persist after the trigger events, which complicates planning for occupancy and labor. In Europe, subpar utilization for core chemical assets has cut back integrated storage capacity, amplifying pressures in specialty handling where imports must be staged and tested before release to end users. The net effect is a short-term drag on flexibility and cost-to-serve inside the chemical warehousing market during periods of high uncertainty as operators balance safety, service levels, and cost recovery.
Limited Availability of Specialized Tank Storage Capacity Constricts High-Purity Chemical Flows
Industry data points to growth in ISO tank fleets without matching depot and terminal capacity in certain regions, which creates bottlenecks for hazardous and high-purity liquids during inspection or batch-release waits. Europe has seen closures and curtailed asset utilization in crackers and related chains, which reduces both production and adjacent storage availability and heightens competition for specialty tank slots. Environmental permitting and long review cycles around PFAS and other restricted substances add lead time to new tank farm projects, which delays market relief in dense industrial corridors. Technical certification changes and standards harmonization are also shifting operational requirements, which in turn require system updates and retraining within shipper and warehouse IT landscapes. The mismatch between high-compliance demand and constrained specialty capacity curbs throughput growth for the chemical warehousing market in affected geographies in the medium term.
*Our forecasts treat driver/restraint impacts as directional, not additive. The impact forecasts reflect baseline growth, mix effects, and variable interactions.
Segment Analysis
By Warehouse Type: Specialized Infrastructure Sets the Pace
Hazardous materials warehouses accounted for 43.67% in 2025, reflecting regulatory requirements for segregated storage, explosion-proof systems, and secondary containment, which institutionalize demand for certified sites within the chemical warehousing market. OSHA’s flammable liquid storage controls limit volumes outside approved cabinets and define cabinet thresholds by category, which pushes operators into purpose-built HAZMAT spaces governed by detailed safety programs and audits. Temperature-controlled facilities are growing at 6.32% on the back of pharma intermediates and sensitive inputs used in advanced batteries, which require tight thermal bands and mapped zones maintained by calibrated systems and documented checks. General chemical warehouses support non-hazardous categories, but the mix is tilting toward specialty and compliance-heavy loads that support premium pricing, service level agreements, and lower incident profiles over time. Certification pathways like Responsible Care and facility-specific verifications create multi-year differentiation that takes new entrants years to match, which strengthens incumbents inside the chemical warehousing market as compliance costs rise.
Temperature-controlled nodes deploy predictive maintenance and continuous monitoring to prevent thermal excursions, while HAZMAT hubs expand gas detection, CCTV, and controlled access to comply with chemical-of-interest frameworks and local fire codes. Regulatory changes are widening the HAZMAT scope as emerging chemistries for batteries receive specific UN classifications and air-transport controls that warehouses must build into their SOPs and training. Clustering within petrochemical and chemical investment regions remains a winning move because shared utilities and testing can reduce cycle times and simplify intermodal transfers. The net effect is durable leadership for HAZMAT sites in the chemical warehousing market and outsized growth in temperature-controlled facilities as more products require strict thermal and quality controls.[3]U.S. Hazmat Storage, “Custom Chemical Storage Buildings,” US Hazmat Storage, ushazmatstorage.com


By Chemical Type: Flammable Liquids Hold the Lead
Flammable liquids represented 36.21% of volumes in 2025, keeping this category at the forefront of the chemical warehousing market as operators maintain Class B suppression systems and ensure separation from oxidizers and ignition sources. OSHA guidance requires distance or barrier separation across incompatible classes and caps for containerized storage, which defines layout and rack strategies for high-turnover solvents and fuels. Toxic substances show faster growth at 6.81% as pharma and specialty chains expand quarantined, ventilated areas with spill containment sized to the largest vessel, which raises the standard facility specification in multi-tenant warehouses. Corrosives and oxidizers demand resistant flooring, eyewash stations within reachable distance, and rated separation from combustibles, which adds capital intensity and design specialization for compliant providers.
Compressed gases and new hazard codifications are shifting requirements on placarding, documentation, and acceptance checks, which means operators must continuously refresh training and SOPs to keep pace with harmonized rules. Seasonal spikes in agrochemicals create short bursts of high throughput that require flexible reconfiguration of storage and materials handling, while battery chemical flows tend to be steadier across the year. Fire safety for flammables continues to improve through automated foam systems and thermal detection calibrated to flash points, while toxic categories rely on air monitoring to keep VOC levels within acceptable thresholds. These design features sustain growth and raise minimum capabilities across the chemical warehousing industry as clients expect predictable safety and quality outcomes under audit.
By End-User Industry: Specialty Chemicals Manufacturing Commands Demand
Specialty chemicals manufacturing held 26.74% in 2025, reflecting a steady flow of batch-based products that benefit from inventory buffers and quality-controlled staging within the chemical warehousing market. Warehouses serving specialty products deploy humidity and temperature controls tailored to pigments, catalysts, and surfactants, and they manage documentation at the lot level to enable quick releases or targeted quarantines on deviation. Pharmaceuticals and life sciences are projected to grow at 7.21%, supported by DSCSA serialization milestones that require EPCIS exchange, unit-level identifiers, and auditable handoffs across the distribution network. This combination of digital compliance and thermal control favors operators with calibrated equipment, mapped zones, and documented deviation management practices under GDP oversight.
Commodity chains like base petrochemicals use large tank terminals and co-located storage, though margin pressure has led to closures and production curtailments in Europe, which reduces integrated storage inside some complexes. Agrochemicals generate predictable seasonal peaks and require flexible capacity for concentrated shipping windows, which guides operators toward short-term leasing and modular layouts that adapt without extensive rebuilding. Paints, coatings, and adhesives rely on thermal stability within moderate temperature ranges and WHMIS or equivalent labeling for compliant distribution, which balances energy costs with product integrity. Food and feed additives demand clean segregation between pharma- and industrial-grade variants, often achieved with color-coded equipment and dedicated traffic flows that prevent cross-contact under audit.
Geography Analysis
Asia-Pacific held 34.90% market share in 2025 and is projected to post the fastest CAGR at 5.87% through 2031 as large additions in resins and petrochemicals expand intermediate storage requirements near production hubs, export terminals, and testing centers. Policy-backed park models in India channel shared utilities, effluent treatment, and common warehousing into cluster frameworks, which improve time-to-market for new products and compress logistics risks for operators.[4]NITI Aayog, “Powering India’s Participation in Global Value Chains,” NITI Aayog, niti.gov.inRegional investments in dedicated chemical ports and storage nodes, including large-scale ammonia and caustic capacity tied to export flows, point to a shift toward integrated infrastructure that supports high-volume, high-compliance shipping lanes. At the same time, APAC warehouses are deploying IoT-driven monitoring to satisfy rising GDP and HAZMAT standards in destination markets, which rely on tighter documentation and alarm protocols inside the four walls.
North America has a system of OSHA, EPA, DOT, and DSCSA rules that reinforce certification pathways and documented quality systems across HAZMAT and cold chain operations, which in turn encourages consolidation with providers that can clear audits consistently. Warehouses supporting pharma-grade flows have leaned into EPCIS data transfer, unit-level serialization, and tamper-evident practices that reduce release delays and protect product integrity under inspection. For hazardous categories, operators maintain segregation and monitoring under spill containment and electrical classification rules, which establish minimum capabilities that smaller firms must meet to compete for complex loads. This compliance infrastructure gives North America a durable position in the chemical warehousing market while supporting premium service tiers for sensitive products and ingredients.
Europe continues to show base chemical overcapacity and weaker utilization for crackers, which has removed some integrated storage as assets close or scale down output. Port-proximate terminals in Rotterdam and Antwerp manage premium-priced storage for high-purity intermediates that require testing and control handling before customer delivery, safeguarding continuity for importers that face inland shortages for these specific capabilities. Disruption cycles have lifted the use of contracts with fixed storage fees and prioritized access to reduce exposure to spot market spikes, which helps European distributors plan inventory buffers for critical feedstocks. The Middle East and Africa’s planned capacity expansions and dedicated ports are designed to anchor outbound flows into APAC and Europe, which increases the strategic value of compliant terminals tied to pipeline networks and deepwater berths.
Mordor Intelligence provides coverage of the chemical warehousing market across other key regional markets, including North America, Europe, Middle East, and Africa, each with their regulatory frameworks and demand patterns. Detailed country-level analysis extends to Canada, France, South Korea, Germany, Mexico, and United Kingdom incorporating local coverage and market participation, as required.

Competitive Landscape
The chemical warehousing market remains moderately fragmented overall, but regulated niches like HAZMAT and pharma cold chain lean toward providers with long audit histories and multi-site certifications that institutional clients recognize in supplier approval programs. Compliance requirements and documented SOPs, including segregation, secondary containment, calibration, and root-cause analyses, establish high entry barriers that take years for newcomers to match. Operators that demonstrate Responsible Care verification or equivalent programs add credibility that translates into multi-year contracts and reduced churn in sensitive segments where product integrity is paramount. Asset positioning inside chemical clusters and near ports further differentiates incumbents by shrinking handoffs and cutting cycle time between tank farms, packaging lines, and export terminals.
Strategic transactions and organic expansions are redefining scope. A large-scale acquisition closed in 2024 is being integrated through 2026 to combine freight and warehousing networks to tighten control over handoffs and reduce cold chain excursion risks across air and ocean corridors. New greenfield and brownfield sites in Southeast Asia reflect shifting production and sourcing patterns across the region and position global players to support diversified supply footprints with local storage and distribution. Meanwhile, terminal and depot operators are expanding heating, testing, and dangerous goods capacity at major hubs to serve high-purity flows and manage batch-release timelines under strict quality regimes. These moves support a service-led competitive cycle where capability depth, geographic coverage, and incident prevention become the main levers for growth.
Digitalization is spreading from pilot programs to scaled deployments. Real-time HAZMAT tracking, sensor-based alerting, and predictive maintenance for temperature control are being integrated into warehouse management to reduce non-conformances and accelerate investigations when deviations occur. Asset-light logistics platforms that unify TMS, advanced analytics, and IoT monitoring can match the service levels of asset-heavy incumbents by routing to approved warehouses and aligning documentation across jurisdictions. Regulatory harmonization led by PHMSA has also updated standards for pressure receptacles and gas cylinders, which raises technical and training requirements inside facilities that handle compressed gases and related equipment. In this environment, providers that combine compliance track records with digital visibility are better positioned to win contracts at premium rates inside the chemical warehousing market.
Chemical Warehousing Industry Leaders
DHL Supply Chain
Kuehne + Nagel
DSV
Rhenus Logistics
BDP International
- *Disclaimer: Major Players sorted in no particular order

Recent Industry Developments
- October 2025: ADNOC L&S and TA’ZIZ signed a 50-year agreement to establish a dedicated chemicals port in Al Ruwais valued at over USD 300 million, with completion scheduled for Q4 2026 and a target production slate of 4.7 million tons per annum in chemicals and derivatives.
- October 2025: Quantix completed its acquisition of CLX Logistics, combining TMS capabilities, AI route optimization, and IoT tracking to boost cross-border efficiency and reduce carbon footprint, expanding services for liquid bulk and international chemical flows.
- September 2025: Toray Industries and T2 Corporation launched an autonomous truck trial for petrochemical transport in Japan to address driver shortages while maintaining HAZMAT safety protocols.
- September 2025: Allcargo Supply Chain commissioned a 160,000 square foot Grade A chemical warehousing facility at its Uran complex in Navi Mumbai with cold storage options, segregated trench lines, foam-based sprinklers, and WMS-enabled flows, adding to a network of over 1.5 million square feet across India.


Global Chemical Warehousing Market Report Scope
The Chemical Warehousing Market Report is Segmented by Warehouse Type (General Warehousing, Specialty Chemical Warehouse, and More), by Chemical Type (Flammable Liquids, Corrosives, and More), by End-user Industry (Basic Chemicals Manufacturing, Specialty Chemicals Manufacturing, and More), and by Geography (North America, South America, Asia-Pacific, and More). The Market Forecasts are Provided in Terms of Value (USD Billion).
| General Warehousing |
| Speciality Chemical Warehouse |
| Hazardous Materials (HAZMAT) Warehouses |
| Temperature-Controlled Chemical Warehouses |
| Flammable Liquids |
| Corrosives |
| Toxic Substances |
| Oxidizers |
| Others |
| Basic Chemicals Manufacturing |
| Specialty Chemicals Manufacturing |
| Pharmaceuticals & Life Sciences |
| Agrochemicals |
| Paints, Coatings & Adhesives |
| Food & Feed Additives |
| Oil & Gas / Petrochemicals |
| Others |
| North America | United States |
| Canada | |
| Mexico | |
| South America | Brazil |
| Peru | |
| Chile | |
| Argentina | |
| Rest of South America | |
| Asia-Pacific | India |
| China | |
| Japan | |
| Australia | |
| South Korea | |
| South East Asia (Singapore, Malaysia, Thailand, Indonesia, Vietnam, and Philippines) | |
| Rest of Asia-Pacific | |
| Europe | United Kingdom |
| Germany | |
| France | |
| Spain | |
| Italy | |
| BENELUX (Belgium, Netherlands, and Luxembourg) | |
| NORDICS (Denmark, Finland, Iceland, Norway, and Sweden) | |
| Rest of Europe | |
| Middle East and Africa | United Arab of Emirates |
| Saudi Arabia | |
| South Africa | |
| Nigeria | |
| Rest of Middle East And Africa |
| By Warehouse Type | General Warehousing | |
| Speciality Chemical Warehouse | ||
| Hazardous Materials (HAZMAT) Warehouses | ||
| Temperature-Controlled Chemical Warehouses | ||
| By Chemical Type | Flammable Liquids | |
| Corrosives | ||
| Toxic Substances | ||
| Oxidizers | ||
| Others | ||
| By End-user Industry | Basic Chemicals Manufacturing | |
| Specialty Chemicals Manufacturing | ||
| Pharmaceuticals & Life Sciences | ||
| Agrochemicals | ||
| Paints, Coatings & Adhesives | ||
| Food & Feed Additives | ||
| Oil & Gas / Petrochemicals | ||
| Others | ||
| By Geography | North America | United States |
| Canada | ||
| Mexico | ||
| South America | Brazil | |
| Peru | ||
| Chile | ||
| Argentina | ||
| Rest of South America | ||
| Asia-Pacific | India | |
| China | ||
| Japan | ||
| Australia | ||
| South Korea | ||
| South East Asia (Singapore, Malaysia, Thailand, Indonesia, Vietnam, and Philippines) | ||
| Rest of Asia-Pacific | ||
| Europe | United Kingdom | |
| Germany | ||
| France | ||
| Spain | ||
| Italy | ||
| BENELUX (Belgium, Netherlands, and Luxembourg) | ||
| NORDICS (Denmark, Finland, Iceland, Norway, and Sweden) | ||
| Rest of Europe | ||
| Middle East and Africa | United Arab of Emirates | |
| Saudi Arabia | ||
| South Africa | ||
| Nigeria | ||
| Rest of Middle East And Africa | ||


Key Questions Answered in the Report
What is the projected growth of the chemical warehousing market to 2031?
The chemical warehousing market size is expected to rise from USD 91.20 billion in 2025 to USD 122.29 billion by 2031 at a 4.67% CAGR over 2026-2031, driven by compliance-led storage, cold chain growth, and resilient port-proximate capacity.
Which segment leads by warehouse type, and which grows the fastest?
Hazardous materials facilities led with 43.67% share in 2025, while temperature-controlled warehouses are projected to post the fastest growth at 6.32% through 2031 on pharma and battery chemical demand.
Which chemical categories dominate volumes in storage?
Flammable liquids held 36.21% in 2025, supported by solvent and fuel handling standards, while toxic substances are growing at 6.81% as pharma-grade and specialty inventories expand under strict segregation and ventilation rules.
What regions are most important for chemical warehouse operators today?
APAC leads on compliance infrastructure with 34.90% share in 2025, and is the fastest growing, as new capacity and export flows create immediate storage needs at hubs and ports.
Which regulations are shaping future warehouse requirements?
DSCSA serialization, updated PHMSA harmonization for hazardous materials, and strict GDP inspections in Europe are setting digital and process thresholds across HAZMAT and cold chain operations.
How are logistics disruptions affecting warehouse strategies?
Disruptions are increasing buffer inventories, extending contract terms, and pushing freight toward port-proximate compliant facilities to ensure continuity for critical intermediates and feedstocks.
Page last updated on:


