North America Warehousing And Storage Market Size and Share
Market Overview
| Study Period | 2020 - 2031 |
|---|---|
| Forecast Data Period | 2026 - 2031 |
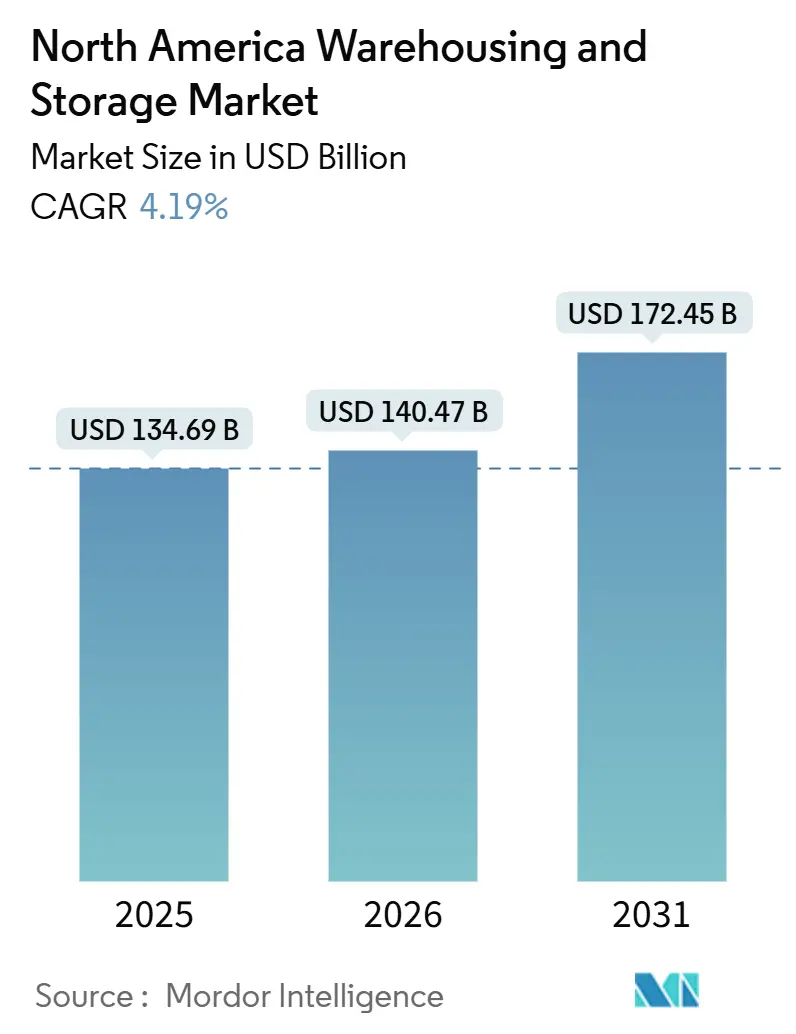
| Base Year Market Size (2025) | USD 134.69 Billion |
| Market Size (2026) | USD 140.47 Billion |
| Market Size (2031) | USD 172.45 Billion |
| Growth Rate (2026 - 2031) | 4.19% CAGR |
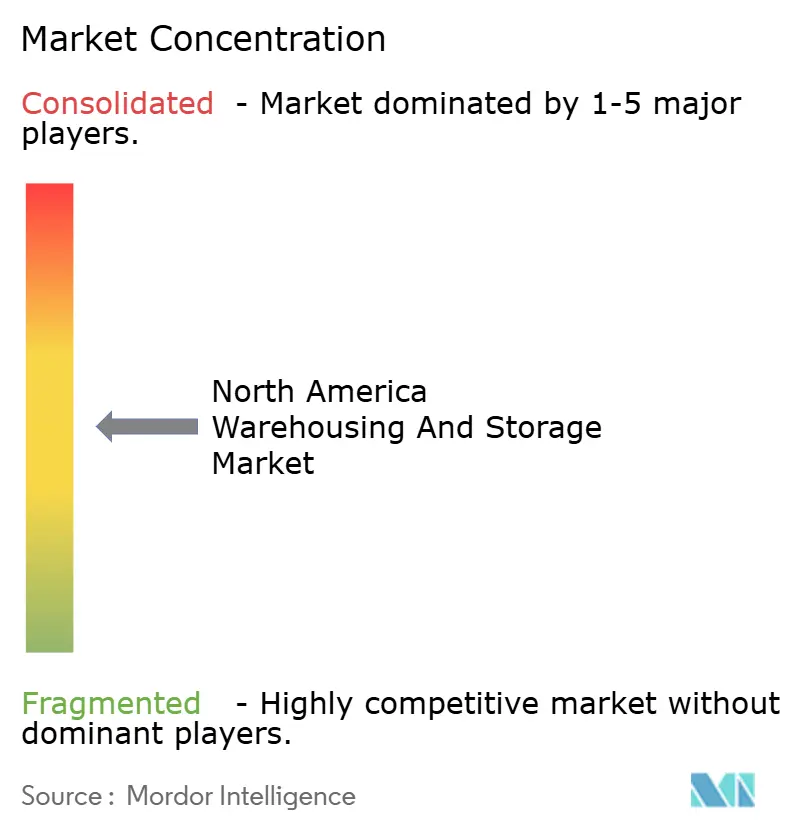
| Market Concentration | Medium |
Major Players
*Disclaimer: Major Players sorted in no particular order Image © Mordor Intelligence. Reuse requires attribution under CC BY 4.0. |
|
North America Warehousing And Storage Market Analysis by Mordor Intelligence
The North America warehousing and storage market size is expected to grow from USD 134.69 billion in 2025 to USD 140.47 billion in 2026 and is forecast to reach USD 172.45 billion by 2031 at 4.19% CAGR over 2026-2031.
Operators are shifting from capacity-led expansion toward technology-intensive density gains as omni-channel retailers push fulfillment centers closer to urban cores and automation compresses pick-to-ship times. Post-USMCA duty-free thresholds have unlocked more than USD 780 billion in bilateral e-commerce flows between the United States and Mexico, prompting cross-border inventories to migrate toward near-border hubs. Federal port-electrification grants totaling USD 885 million are repurposing brownfield land in California for zero-emission logistics complexes. Meanwhile, double-digit industrial rent escalation in tier-one markets is pushing smaller providers into secondary metros, where automated high-bay facilities mitigate labor scarcity and rising land costs[1]"Biden-Harris Administration Announces $3 Billion Clean Ports Program to Reduce Air Pollution." EPA, epa.gov.
Key Report Takeaways
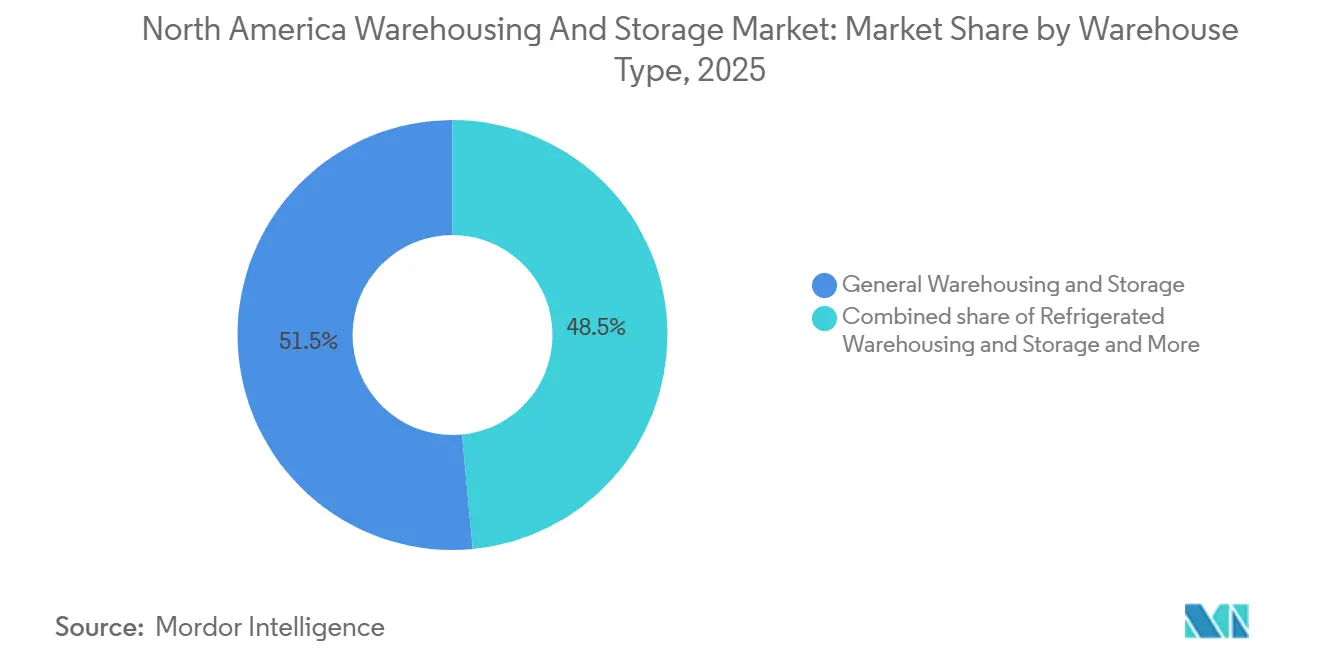
- By warehouse type, general warehousing and storage held 51.5% of the North America warehousing and storage market share in 2025, and refrigerated warehousing and storage is forecast to expand at a 9.85% CAGR through 2031.
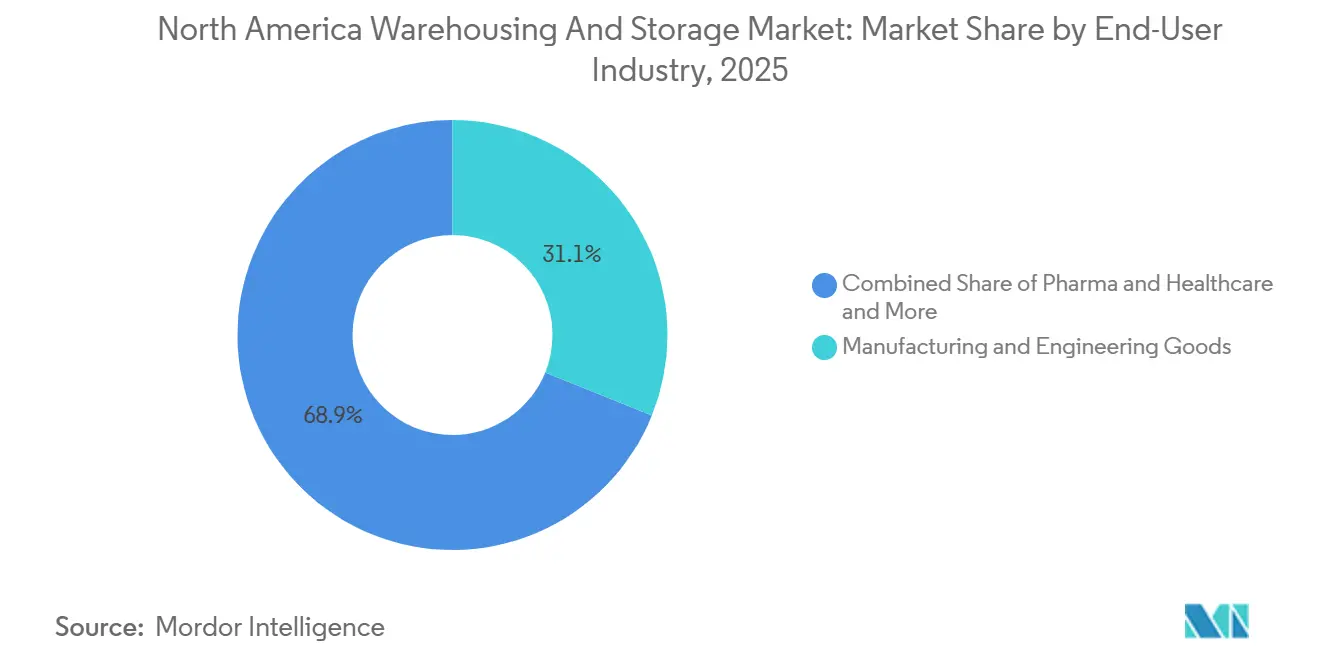
- By end-user, manufacturing and engineering goods accounted for 31.11% of the North America warehousing and storage market size in 2025. While pharma and healthcare is advancing at a 9.43% CAGR through 2031.
- By geography, the United States controlled 79.47% of regional capacity in 2025, while Mexico is projected to grow at a 7.40% CAGR to 2031.
Note: Market size and forecast figures in this report are generated using Mordor Intelligence’s proprietary estimation framework, updated with the latest available data and insights as of January 2026.
North America Warehousing And Storage Market Trends and Insights
Drivers Impact Analysis*
| Driver | (~) % Impact on CAGR Forecast | Geographic Relevance | Impact Timeline |
|---|---|---|---|
| Omni-channel retail shift to same-day delivery windows | +0.8% | United States metro clusters, Greater Toronto Area, Mexico City | Short term (≤ 2 years) |
| Rapid ROI improvements in warehouse automation and robotics | +0.9% | United States and Canada, selected Mexican border facilities | Medium term (2–4 years) |
| Post-USMCA duty-free thresholds boosting cross-border e-commerce flows | +0.6% | Laredo–Monterrey axis and broader border corridors | Medium term (2–4 years) |
| Surplus mall conversions into temperature-controlled distribution nodes | +0.3% | Midwest and Northeast legacy retail zones | Long term (≥ 4 years) |
| US West Coast port electrification grants opening brownfield warehouse sites | +0.2% | Oakland, Los Angeles, Stockton, Hueneme | Long term (≥ 4 years) |
| AI-driven dynamic slotting is increasing storage-density requirements | +0.5% | Tier-one United States hubs and Canadian e-commerce nodes | Medium term (2–4 years) |
| Source: Mordor Intelligence | |||
Omni-Channel Retail Shift to Same-Day Delivery Windows
Retailers now stage inventory within 10 miles of urban cores to meet shrinking delivery windows. Amazon’s Imperial, Pennsylvania, and Nampa, Idaho sites each process 20,000-plus daily orders, while Walmart’s 2.2 million square-foot McCordsville, Indiana hub uses automated storage and retrieval systems to cut pick-to-ship cycles below two hours. Vacancy in sub-50,000 square-foot last-mile facilities sits near 4% versus the 7.4% national average. Kase’s new 209,700 square-foot Fontana complex integrates parcel sortation with same-day staging for 4.6 million Inland Empire residents. Operators unable to secure infill land risk ceding profitable contracts to vertically integrated rivals as e-commerce penetration climbed to 16% of United States retail sales in Q1 2025.
Rapid ROI Improvements in Warehouse Automation & Robotics
Payback periods for robotics have fallen to two to three years as labor costs soar and equipment prices drop. GXO Logistics reports 30-40% throughput gains from autonomous mobile robots with sub-36-month paybacks. Lucas Systems’ voice-directed slotting delivers 20-40% productivity increases alongside 10-20% labor-cost reductions. Stord’s USD 40 million Hebron expansion embeds 525,000 square feet of automated sortation, undercutting legacy cost structures for mid-market shippers. The primary constraint is talent: 64% of operators struggle to hire maintenance technicians, pushing vendors to embed service staff in multi-year contracts[2]“Warehousing and Storage Employment Data,” U.S. Bureau of Labor Statistics, bls.gov.
Post-USMCA Duty-Free Thresholds Boosting Cross-Border E-Commerce Flows
Raising the de minimis threshold to USD 117 unleashes high-velocity parcel traffic. Bilateral trade crossed USD 780 billion in 2024, with Mexico overtaking China as the United States’ top partner. Ryder’s 21,000 square-meter Monterrey complex and DP World’s 10,869 square-meter Querétaro site pre-position inventories for automotive and consumer goods near the border. Wait times of two to six hours at Laredo, El Paso, and Otay Mesa drive demand for bonded near-border warehouses that buffer inventory and expedite customs clearance[3]“Biden-Harris Administration Announces USD 3," Environmental Protection Agency, epa.gov.
Surplus Mall Conversions into Temperature-Controlled Distribution Nodes
Retail vacancies have unlocked structurally sound, climate-controlled shells close to major highways. Bridge Industrial’s USD 150 million Ford City Mall project in Chicago and Walmart’s Monroeville, Pennsylvania, conversion illustrate a cost-effective route to last-mile cold storage. Yet retrofit expenses of USD 50-70 per square foot often outweigh the USD 12-15 per-square-foot leasing premiums cold storage commands. Operators, therefore, weigh speed-to-market conversions against purpose-built automated sites such as NewCold’s USD 300 million Lebanon facility.
Restraints Impact Analysis*
| Restraint | (~) % Impact on CAGR Forecast | Geographic Relevance | Impact Timeline |
|---|---|---|---|
| Double-digit industrial rent escalation compressing operator margins | -0.7% | United States coastal tier-one markets, Greater Toronto Area | Short term (≤ 2 years) |
| Enhanced CBP cargo screening slowing cross-border throughput | -0.3% | Laredo, El Paso, Otay Mesa crossings | Medium term (2–4 years) |
| Shortage of skilled automation technicians elevating downtime risk | -0.4% | Automation-intensive facilities across the region | Medium term (2–4 years) |
| Municipal moratoria on diesel yard trucks limiting site productivity | -0.2% | California, New York, New Jersey port-adjacent zones | Long term (≥ 4 years) |
| Source: Mordor Intelligence | |||
Double-Digit Industrial Rent Escalation Compressing Operator Margins
Asking rents in tier-one US markets reached USD 12-15 per square foot in 2025, up from USD 8-10 in 2020, while escalation clauses top 8% annually in Southern California. Resulting margin pressure pushes 3PLs toward Reno, Phoenix, and other secondary metros where land costs trail coastal gateways by 30-40%. Yet longer line-haul distances add 12-24 hours to delivery times, jeopardizing same-day offerings. Lease renewals coming due in 2026-2027 will impose 25-35% rent resets, forcing portfolio rationalization into automated, higher-density facilities.
Enhanced CBP Cargo Screening Slowing Cross-Border Throughput
Heightened fentanyl interdiction raised inspection rates to 7-10%, extending border dwell times by two to six hours. Texas protest blockades in early 2025 created 18-36-hour truck queues, compelling shippers to hold three to five days of buffer stock near ports of entry. Vertically integrated 3PLs offset delays through bonded warehouses and C-TPAT certification, while smaller firms without customs capability lose bid competitiveness[4]“Warehousing and Storage Employment Data,” U.S. Bureau of Labor Statistics, bls.gov.
*Our forecasts treat driver/restraint impacts as directional, not additive. The impact forecasts reflect baseline growth, mix effects, and variable interactions.
Segment Analysis
By Warehouse Type: Cold Storage Outpaces Ambient Growth
Refrigerated warehousing posted a 9.85% forecast CAGR, as operators chase pharmaceutical cold-chain mandates and fresh-food e-grocery flows, paying USD 12-15 per square foot in rent against ambient’s USD 8-10. NewCold’s fully automated Lebanon, Pennsylvania site delivers 30% higher pallet density compared with legacy blast-freeze layouts, while EVERSANA’s Memphis hub aligns -20 °C storage with AI inventory for biosimilars.
General warehousing retains the largest 2025 footprint, yet its 51.5% North America warehousing and storage market share erodes as commodity SKUs migrate toward higher-density automated sites. Farm-product storage stays niche, limited to Midwest grain corridors where seasonal volatility undermines automation ROI. Capital now flows to hybrid designs that partition ambient and cold zones under one roof, capturing diverse revenue streams while diluting site risk.


By End-User Industry: Pharma Leads, Manufacturing Anchors
Manufacturing and engineering goods controlled 31.11% of the 2025 North America warehousing and storage market size, anchored by automotive clustering under USMCA’s 75% content rule. Yet pharma and healthcare grow the fastest at 9.43% CAGR as GLP-1 injectables and biosimilars require GDP-compliant networks with constant temperature monitoring.
Electric-vehicle battery storage fuels specialized demand for fire-suppressed facilities that earn 25-30% rate premiums. Ambient grocery SKUs exhibit steady but lower-margin growth, prompting grocers to co-invest in automation to keep unit economics viable. The strategic debate balances vertical specialization, higher yields, and concentrated customer mix against horizontal diversification that tempers cyclicality but weakens pricing power.
Geography Analysis
The United States held 79.47% of the North America warehousing and storage market share in 2025, supported by coastal gateways and Midwest corridors. Yet vacancy rose to 7.4% in Q3 2025 as speculative builds in secondary metros outpaced demand, softening rent growth to 1.6%. Investment now targets retrofits that embed high-bay shuttle systems to extract density without additional land.
Mexico records the region’s fastest 7.40% CAGR, propelled by USD 40.9 billion of 2025 FDI that channels 37% into manufacturing and logistics. Plan México accelerates depreciation up to 91% for logistics assets, enticing developers toward interior hubs in Nuevo León and Guanajuato. Near-border vacancy remains 4.4% as automotive suppliers pre-position inventory to meet reduced content distances.
Canada's growth remains stable, driven by the Greater Toronto Area and Vancouver, which collectively contribute 60% of the country's capacity. Although capacity limitations and slower population growth moderate expansion, the e-grocery sector and data-center supply chains continue to support consistent demand for specialized real estate. Additionally, cross-border dependencies align Canadian throughput with US consumption cycles, strengthening the business case for portfolio diversification among operators active across all three markets.
Competitive Landscape
North America’s warehousing arena remains moderately fragmented, with the top 10 players controlling roughly 35-40% of capacity. Lineage Logistics and Americold dominate the temperature-controlled space, together operating more than 2 billion cubic feet of cold storage. GXO and DHL Supply Chain lead automation-rich fulfillment, harnessing autonomous mobile robots to lift throughput 30-40% and realize two-year paybacks.
Competitive advantage has shifted from land banks to talent-backed automation rollouts. Early movers lock in scarce technicians through vendor-embedded service models, erecting barriers for later entrants. Cross-border capability is an additional moat: C-TPAT and Mexican OEA certifications shorten customs cycles to two to three hours, steering high-value shippers toward integrated 3PLs.
Emerging disruptors aggregate third-party capacity via digital platforms, lowering capital intensity but struggling to guarantee peak-season service levels. Mid-tier incumbents counter by specializing in pharmaceutical GDP, automotive just-in-sequence or hybrid cold-ambient nodes, raising EBITDA multiples relative to undifferentiated ambient storage peers. Industrial REITs such as Prologis underwrite the sector with billion-square-foot portfolios, shaping rent trends yet ceding operational control to 3PL tenants.
North America Warehousing And Storage Industry Leaders
-
GXO Logistics
-
Lineage, Inc.
-
Americold
-
DHL Group
-
UPS Supply Chain Solutions
- *Disclaimer: Major Players sorted in no particular order

Recent Industry Developments
- March 2026: DHL Supply Chain announced 7 million square feet of new space aimed at AI-infrastructure supply chains, signaling growth beyond retail warehousing.
- May 2025: Kenco Logistics bought Drexel Industries’ 3PL arm in Ontario, adding four warehouses and 100 staff.
- February 2025: Lineage Logistics opened its USD 300 million Lebanon, Pennsylvania, automated cold store, lifting regional cold capacity.
- January 2025: EVERSANA launched a 358,000 square-foot Memphis cold-chain hub for biosimilars and GLP-1 injectables.


North America Warehousing And Storage Market Report Scope
| General Warehousing and Storage |
| Refrigerated Warehousing and Storage |
| Farm Product Warehousing and Storage |
| E-commerce & Retail |
| Food & Beverage |
| Pharma & Healthcare |
| Automotive |
| Manufacturing & Engineering Goods |
| Others |
| United States |
| Canada |
| Mexico |
| By Warehouse Type (Value) | General Warehousing and Storage |
| Refrigerated Warehousing and Storage | |
| Farm Product Warehousing and Storage | |
| By End-User Industry (Value) | E-commerce & Retail |
| Food & Beverage | |
| Pharma & Healthcare | |
| Automotive | |
| Manufacturing & Engineering Goods | |
| Others | |
| By Geography (Value) | United States |
| Canada | |
| Mexico |


Key Questions Answered in the Report
What is the forecast value of the North America warehousing and storage market by 2031?
The market is projected to reach USD 172.45 billion by 2031, growing at a 4.19% CAGR from 2026 to 2031.
Which warehouse type is expanding the fastest across the region?
Refrigerated warehousing leads with a 9.85% forecast CAGR as pharmaceutical and fresh-food shippers demand temperature-controlled capacity.
How large is the United States share of total regional capacity?
The United States commanded 79.47% of capacity in 2025, although its share is expected to edge lower as Mexico outpaces it in growth.
Why are operators investing heavily in warehouse automation?
Robotics now delivers 30-40% throughput gains with paybacks of two to three years, offsetting labor shortages and rising real-estate costs.
What regulatory changes most affect cross-border warehousing?
Enhanced CBP screening has raised inspection rates to as high as 10%, prompting demand for bonded near-border warehouses that buffer delays.
How will California’s zero-emission mandates shape yard operations?
The Advanced Clean Fleets rule phases out diesel drayage by 2035, driving early adoption of battery-electric yard trucks despite higher upfront costs.
Page last updated on:


