NPK Fertilizers Market Size and Share
Market Overview
| Study Period | 2021 - 2031 |
|---|---|
| Market Size (2026) | USD 103.20 Billion |
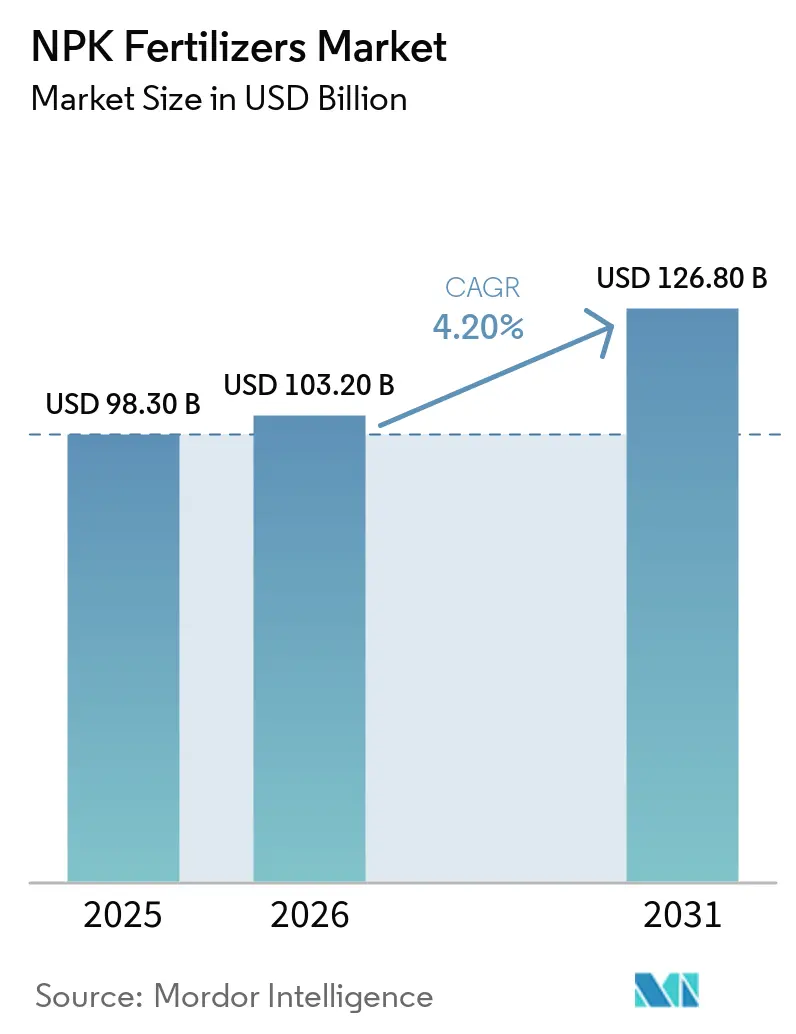
| Market Size (2031) | USD 126.80 Billion |
| Growth Rate (2026 - 2031) | 4.20% CAGR |
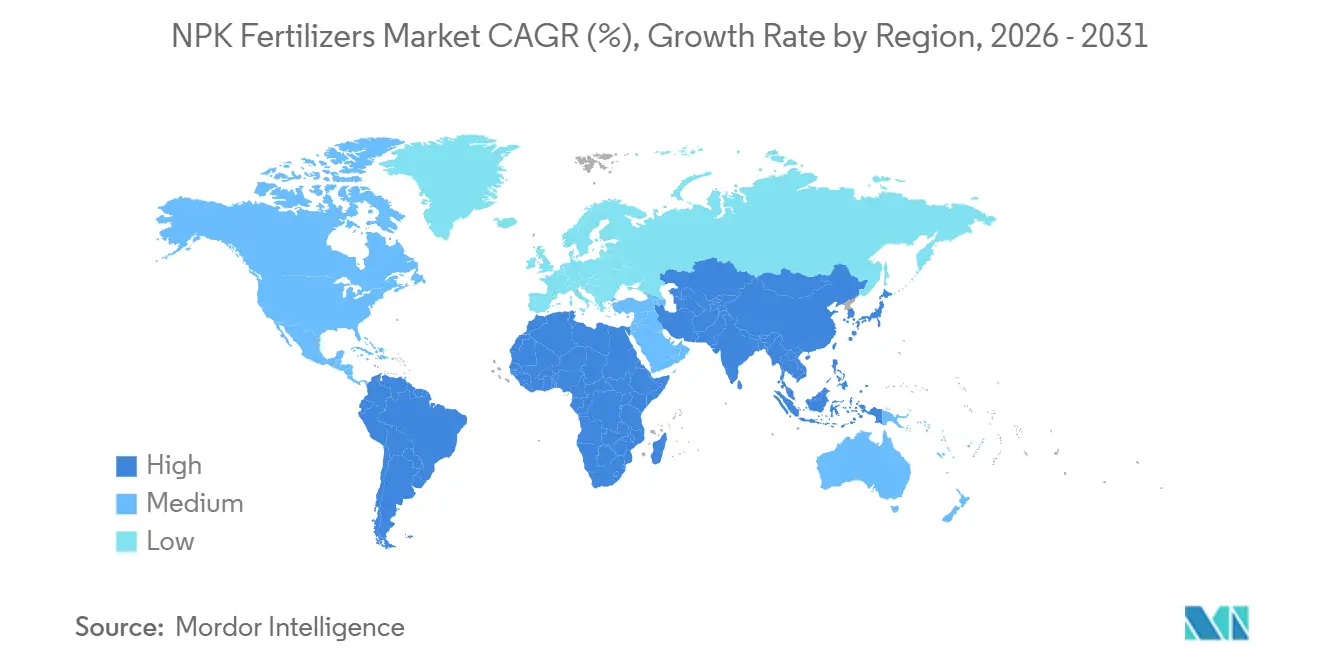
| Fastest Growing Market | Africa |
| Largest Market | Asia Pacific |
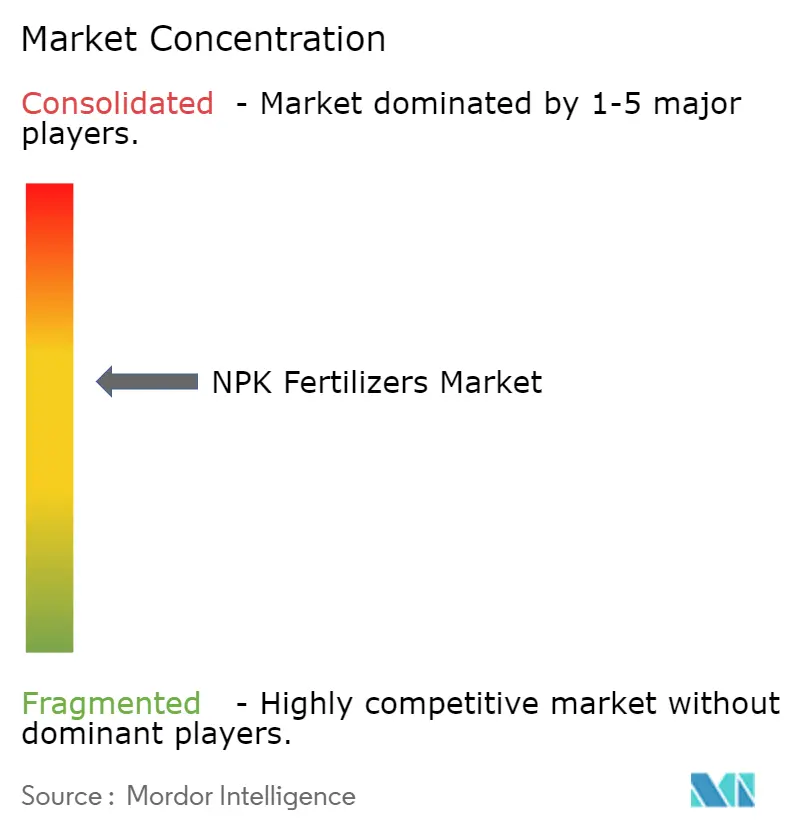
| Market Concentration | Medium |
Major Players *Disclaimer: Major Players sorted in no particular order Image © Mordor Intelligence. Reuse requires attribution under CC BY 4.0. | |
NPK Fertilizers Market Analysis by Mordor Intelligence
The NPK fertilizers market size is projected to grow from USD 98.3 billion in 2025 and USD 103.2 billion in 2026 to USD 126.8 billion by 2031, registering a CAGR of 4.2% between 2026 and 2031. This trend highlights the growing pressure on agricultural systems to increase yields per hectare while managing fluctuating input costs and adhering to stricter environmental regulations. The market remains moderately consolidated, with key players striving to secure low-carbon ammonia feedstock and phosphate-recovery technologies. Additionally, book-and-claim environmental attribute certificates are becoming the preferred method for food companies to support green-fertilizer premiums without disrupting physical supply chains. Stricter emission regulations on urea granulation lines and the European Union's Carbon Border Adjustment Mechanism are driving producers to implement nitrous-oxide abatement catalysts to avoid potential margin losses.
Key Report Takeaways
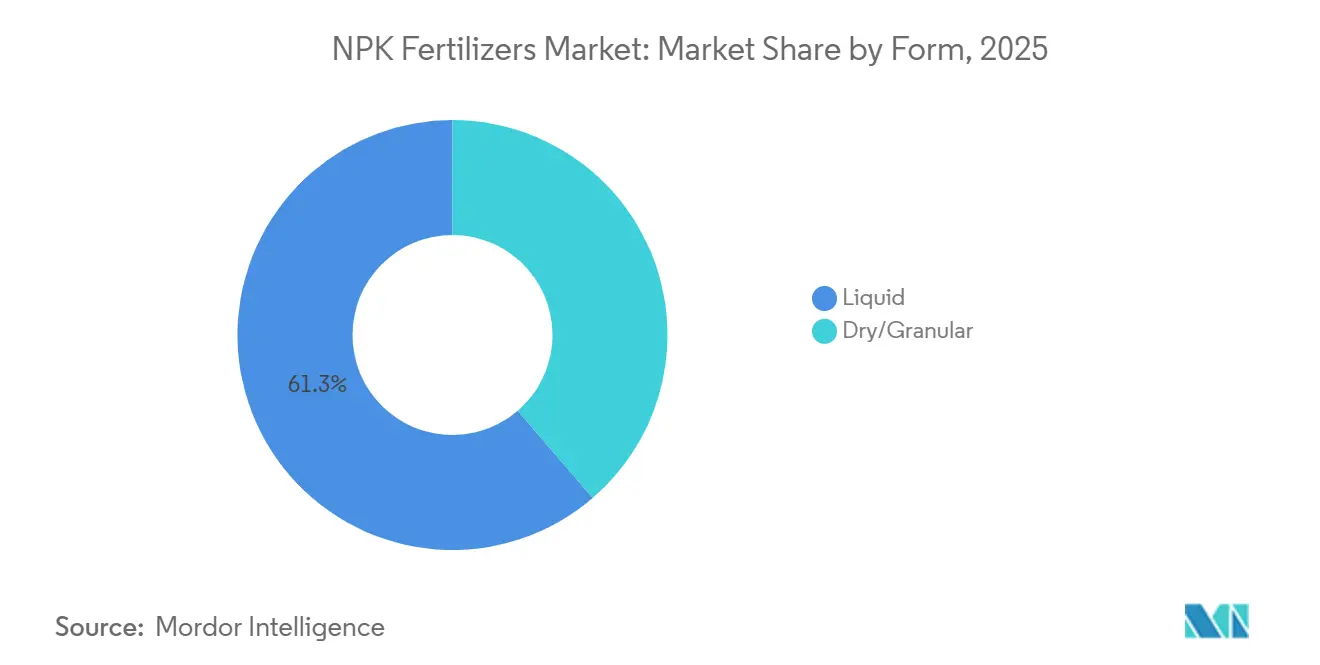
- By form, liquid led with the largest 61.3% of the NPK fertilizers market share in 2025. Dry/granular market size is projected to grow at the fastest 3.4% CAGR from 2026 to 2031.
- By crop type, cereals and grains held the largest 47% of the NPK fertilizers market share in 2025. Fruits and vegetables market size is anticipated to expand at the fastest 3.8% CAGR from 2026 to 2031.
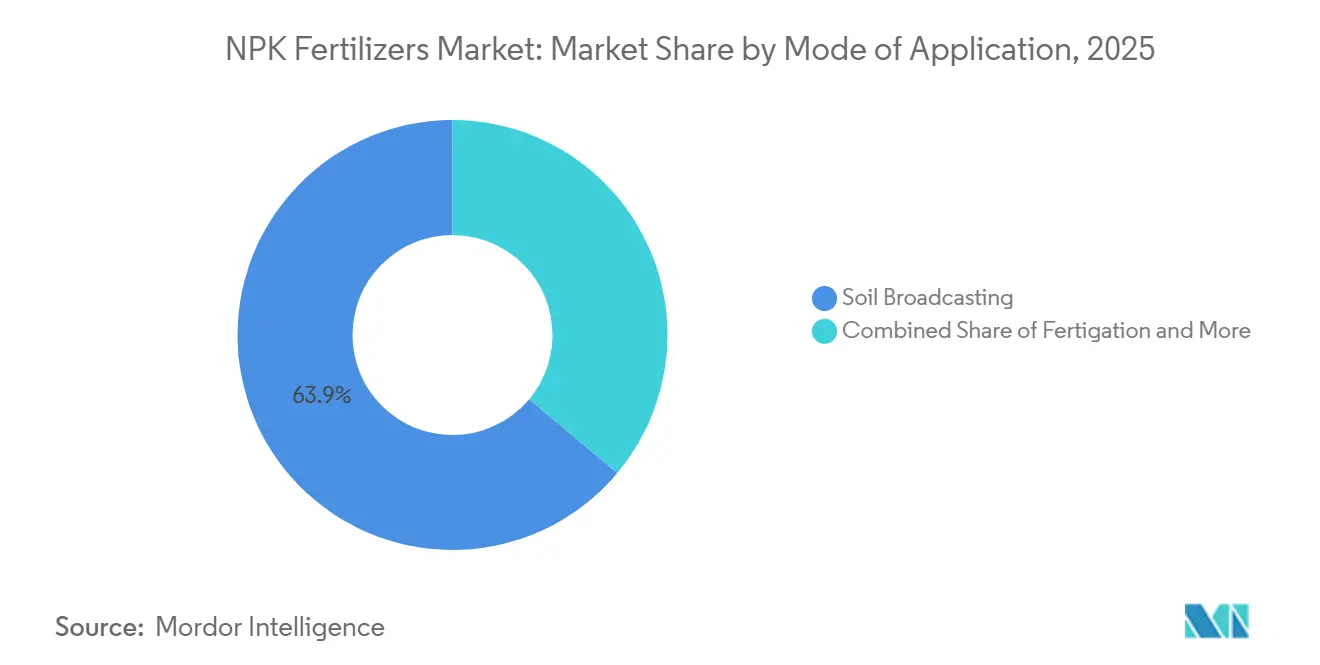
- By mode of application, soil broadcasting accounted for the largest 63.9% of the NPK fertilizers market share in 2025. The fertigation market size is forecast to advance at the fastest 5.4% CAGR from 2026 to 2031.
- By geography, Asia-Pacific dominated with the largest 53.1% of the NPK fertilizers market share in 2025. Africa market size is projected to grow at the fastest 5.8% CAGR from 2026 to 2031.
Note: Market size and forecast figures in this report are generated using Mordor Intelligence’s proprietary estimation framework, updated with the latest available data and insights as of January 2026.
Global NPK Fertilizers Market Trends and Insights
Drivers Impact Analysis*
| Driver | (~) % Impact on CAGR Forecast | Geographic Relevance | Impact Timeline |
|---|---|---|---|
| Population-driven food-demand surge | +0.8% | Global, peak intensity in Asia-Pacific and Africa | Long term (≥ 4 years) |
| Government nutrient-efficiency incentives | +0.7% | India, Brazil, European Union, and select African nations | Short term (≤ 2 years) |
| Precision fertilization adoption | +0.6% | North America and Europe core, spill-over to South America and Asia-Pacific | Medium term (2–4 years) |
| Shift to balanced NPK blends in specialty crops | +0.5% | Europe, North America, and greenhouse clusters in Middle East | Medium term (2–4 years) |
| Carbon-credit revenue for low-nitrous-oxide NPKs | +0.4% | North America and Europe, pilot extensions to South America | Long term (≥ 4 years) |
| Phosphate recovery from wastewater plants | +0.3% | Europe and North America, early adoption in urban Asia-Pacific hubs | Long term (≥ 4 years) |
| Source: Mordor Intelligence | |||
Population-Driven Food-Demand Surge
Global fertilizer demand is steadily increasing as population growth places greater pressure on agricultural systems to achieve higher yields from limited arable land. According to the United Nations (UN), the global population is projected to reach 9.7 billion by 2050 [1]Source: United Nations, “World Population Projected to Reach 9.7 Billion by 2050,” United Nations Department of Economic and Social Affairs, population.un.org. This population growth is directly impacting fertilizer consumption patterns, particularly for balanced NPK (Nitrogen, Phosphorus, and Potassium) products that promote sustainable crop productivity. Farmers are increasingly implementing nutrient-efficient practices to preserve soil fertility while addressing rising food demand amid environmental and land-use constraints.
Government Nutrient-Efficiency Incentives
Government initiatives are significantly contributing to the promotion of balanced fertilization and the enhancement of nutrient-use efficiency (NUE) in key agricultural economies. In India, the Nutrient Based Subsidy (NBS) scheme supports the use of phosphorus and potassium fertilizers, aiming to reduce the over-reliance on nitrogen-based inputs. These policies are shaping farmers' purchasing decisions toward NPK fertilizers with balanced nutrient compositions. As global sustainability regulations become more stringent, such measures are anticipated to drive the adoption of efficient fertilizer products and integrated nutrient management practices.
Precision Fertilization Adoption
Precision fertilization is transforming fertilizer application by facilitating targeted nutrient delivery and minimizing input waste in modern farming practices. A 2025 study published in Smart Agricultural Technology highlights that precision agriculture incorporates variable rate application (VRA), geographic information systems (GIS), and sensor-based monitoring to enable site-specific nutrient management and real-time soil analysis. These technologies help farmers optimize the application of nitrogen, phosphorus, and potassium based on field variability, enhancing efficiency and sustainability.
Shift to Balanced NPK Blends in Specialty Crops
The increasing demand for high-value and specialty crops is promoting the use of customized and balanced NPK (Nitrogen, Phosphorus, and Potassium) fertilizers designed to meet specific crop and soil needs. A growing emphasis on crop quality, consistent yields, and nutrient efficiency is driving growers to adopt advanced formulations, including water-soluble and controlled-release fertilizers. Additionally, regulatory requirements concerning fertilizer composition and environmental safety are compelling manufacturers to improve product quality and foster innovation. These factors are bolstering the premium segment of the market, with producers providing differentiated, crop-specific nutrient solutions.
Restraints Impact Analysis*
| Restraint | (~) % Impact on CAGR Forecast | Geographic Relevance | Impact Timeline |
|---|---|---|---|
| Potash and ammonia price volatility | -0.9% | Global, acute in import-dependent regions | Short term (≤ 2 years) |
| Stricter emission rules on urea granulation lines | -0.5% | European Union, North America, and expanding to Asia-Pacific | Medium term (2–4 years) |
| Rapid acreage shift to pulses and legumes | -0.3% | Europe, North America, and India | Medium term (2–4 years) |
| Rise of biological N-P-K substitutes | -0.4% | North America and Europe core, pilots in South America and Asia-Pacific | Long term (≥ 4 years) |
| Source: Mordor Intelligence | |||
Potash and Ammonia Price Volatility
Fluctuations in ammonia-related fertilizer prices continue to impact cost structures in the NPK fertilizers market. According to the World Bank Commodity Markets, urea prices rose significantly from USD 472 per metric ton in February 2026 to USD 725.6 per metric ton in March 2026, indicating notable short-term volatility [3]Source: International Fertilizer Association, “Short-Term Fertilizer Outlook 2024–2025,” fertilizer.org. Since urea is directly derived from ammonia, these price fluctuations underscore instability in nitrogen input costs, primarily influenced by changes in natural gas prices. This volatility increases production costs for NPK fertilizers, reduces affordability for farmers, and disrupts procurement cycles, ultimately resulting in inconsistent demand patterns across regions.
Stricter Emission Rules on Urea Granulation Lines
Stringent environmental regulations on fertilizer production are driving up compliance costs and adding operational complexity for manufacturers. In 2024, the United States Environmental Protection Agency (EPA) finalized updated emission standards for phosphate fertilizer plants under the National Emission Standards for Hazardous Air Pollutants (NESHAP), aimed at reducing hazardous air pollutants. These regulations mandate the installation of advanced emission control systems and process upgrades. Compliance with these standards increases capital expenditure requirements, particularly impacting smaller producers, which may hinder their operational efficiency and shift market competition in favor of larger, integrated fertilizer manufacturers.
*Our forecasts treat driver/restraint impacts as directional, not additive. The impact forecasts reflect baseline growth, mix effects, and variable interactions.
Segment Analysis
By Form: Liquid Grades Dominate as Granular Production Upgrades Accelerate
Liquid formulations led with the largest 61.3% of market share in 2025, supported by increasing adoption of fertigation systems that require fully soluble nutrients and uniform delivery. These products enable precise nutrient application and reduce losses during irrigation, making them suitable for high-value crops and controlled farming systems. Manufacturers are also improving storage, transport, and application infrastructure for liquids, including corrosion-resistant tanks and metering systems. This shift is reinforcing demand for liquid fertilizers, particularly in regions adopting precision agriculture practices and water-efficient farming techniques.
Dry/granular fertilizers remain essential for large-scale field crops due to ease of handling and cost efficiency. The dry/granular market size is projected to grow at the fastest 3.4% CAGR from 2026 to 2031 as producers invest in advanced granulation technologies and particle-size optimization. Uniform granules improve spreading accuracy and compatibility with variable rate equipment. Companies are upgrading coating and screening systems to reduce dust formation and enhance product consistency. Flexible manufacturing setups that support both liquid and granular formats are enabling producers to adapt to fluctuating demand and feedstock price dynamics.


By Crop Type: Cereals Anchor Volume while Fruits and Vegetables Propel Growth
Cereals and grains held the largest 47.0% of market share in 2025, driven by staple crop cultivation across Asia-Pacific, North America, and South America. These crops require consistent nutrient input to maintain yield stability under intensive farming systems. Government policies supporting food security and balanced fertilization are reinforcing demand for nitrogen, phosphorus, and potassium blends in cereal production. Large-scale farming operations prioritize cost-effective fertilizer solutions, sustaining volume demand for conventional nutrient formulations across major grain-producing regions.
Fruits and vegetables are anticipated to expand at the fastest 3.8% CAGR from 2026 to 2031, supported by rising consumption of high-value crops and increased adoption of protected cultivation. These crops demand precise nutrient management to enhance quality, yield, and shelf life. Producers are increasingly offering customized fertilizer blends and agronomic advisory services to meet crop-specific requirements. Specialty fertilizers, including water-soluble and micronutrient-enriched formulations, are gaining traction as growers focus on optimizing nutrient uptake and improving overall productivity in horticulture systems.
By Mode of Application: Broadcast Holds Majority Share as Fertigation Gains Momentum
Soil broadcasting accounted for the largest 63.9% of market share in 2025 due to its cost efficiency and suitability for large-scale cereal farming. This method allows rapid fertilizer application across extensive farmland with minimal labor and equipment complexity. Broadcast application remains dominant in rain-fed agricultural systems where irrigation infrastructure is limited. Farmers prefer this approach for its simplicity and ability to cover large areas quickly, supporting continued demand for granular fertilizer formats.
The fertigation market size is forecast to advance at the fastest 5.4% CAGR from 2026 to 2031, driven by the expansion of drip irrigation and precision farming systems. Fertigation enables synchronized nutrient and water delivery, improving nutrient-use efficiency and reducing environmental losses. Adoption is increasing in regions facing water scarcity and regulatory pressure on nutrient runoff. Equipment innovations, including automated dosing systems, are making fertigation more accessible to medium-scale farms. This transition is encouraging producers to expand their portfolio of water-soluble npk fertilizers.
Geography Analysis
Asia-Pacific is projected to hold the largest market share of 53.1% in 2025, driven by robust agricultural output and high fertilizer consumption in countries such as India and China. The region benefits from extensive arable land, multiple cropping cycles, and government initiatives promoting balanced fertilization. Expansion of domestic production capacity and integration across fertilizer value chains are enhancing supply stability. Additionally, the rising population and increasing food demand continue to fuel nutrient consumption, solidifying the region’s leadership in global fertilizer usage.
Africa market size is projected to grow at the fastest CAGR of 5.8% from 2026 to 2031, driven by rising investments in fertilizer blending facilities and agricultural modernization. Governments and development organizations are actively promoting balanced fertilization to enhance soil health and crop productivity. The expansion of local production capacity is reducing reliance on imports and improving access to fertilizer. Growth in staple crop cultivation, coupled with supportive agricultural policies, is boosting demand for nutrient solutions across key African economies.
Europe and North America represent mature markets where demand is primarily driven by sustainability regulations and efficiency-focused farming practices. Environmental policies in these regions encourage optimized nutrient application while discouraging excessive fertilizer use. Farmers are increasingly adopting precision agriculture technologies and improved nutrient management practices. These trends are shaping purchasing behaviors and driving demand for high-efficiency, environmentally compliant fertilizer products. According to the International Fertilizer Association, global fertilizer demand reached approximately 201 million metric tons of nutrients in the 2024/25 fertilizer year, including 114 million metric tons of nitrogen, 47 million metric tons of phosphate, and 40 million metric tons of potash [2]Source: International Fertilizer Association, “Short-Term Fertilizer Outlook 2024–2025,” fertilizer.org.

Competitive Landscape
The competitive landscape is moderately consolidated, dominated by vertically integrated companies such as Yara International ASA, Nutrien Ltd., The Mosaic Company, EuroChem Group AG, and ICL Group Ltd. These companies operate across mining, ammonia production, and large-scale blending, ensuring control over raw materials and supply chains. Their global presence and integrated operations provide cost advantages and resilience against fluctuations in input prices. Continuous investments in capacity expansion and product innovation are enhancing their positioning in both commodity and specialty fertilizer segments.
Leading companies are increasingly focusing on sustainability, digital agriculture, and specialty product development. Investments in low-carbon ammonia, enhanced-efficiency fertilizers, and precision farming solutions are becoming central to their competitive strategies. Collaborations with agritech firms and food companies are facilitating the development of traceable and sustainable nutrient supply chains. Additionally, companies are expanding their product portfolios with water-soluble and customised formulations to meet the needs of high-value crops. This emphasis on value-added solutions is enabling manufacturers to improve profit margins while differentiating themselves in a competitive and regulation-driven market environment.
Industry competition is influenced by global production capacities and supply dynamics. As per the International Fertilizer Association Short-Term Fertilizer Outlook 2024–2025, global fertilizer consumption (N + P₂O₅ + K₂O) reached 205 million metric tons of nutrients in 2025, reflecting a steady recovery in demand across various regions. Large integrated producers utilize economies of scale and advanced technologies to sustain their market leadership. In contrast, regional players focus on localized blending and agronomic services tailored to specific crop requirements. The growing emphasis on sustainability and efficiency continues to shape competitive strategies for both global and regional participants.
NPK Fertilizers Industry Leaders
Yara International ASA
Nutrien Ltd.
The Mosaic Company
EuroChem Group AG
ICL Group Ltd.
- *Disclaimer: Major Players sorted in no particular order

Recent Industry Developments
- February 2025: Haifa Chemicals Ltd., North West Europe introduced Haifa Soluble DUO, a water-soluble fertilizer available in two formulations. The product combines nitrate nitrogen, potassium, and calcium to promote sustainable cultivation practices.
- April 2025: Coromandel International Limited entered into a Memorandum of Understanding (MoU) with Saudi Arabian Mining Company (Ma’aden) to establish a long-term supply agreement for Di-Ammonium Phosphate (DAP) and NP/NPK fertilizers. This partnership aims to enhance supply chain stability and ensure a consistent supply of complex fertilizers.
- October 2024: Coromandel International Limited has commissioned a phosphoric acid plant in Kakinada to enhance backward integration of raw material supply for complex fertilizers, including NPK, thereby strengthening domestic production capacity.


Global NPK Fertilizers Market Report Scope
NPK fertilizers are compound fertilizers that provide nitrogen (N), phosphorus (P), and potassium (K) in specific ratios to meet crop needs. Nitrogen aids growth, phosphorus supports roots and flowering, and potassium improves plant health and stress tolerance. These formulations enhance crop yield, quality, and nutrient efficiency. The NPK fertilizers market report is segmented by form (dry/granular, liquid, and water-soluble powder), by crop type (cereals and grains, fruits and vegetables, oilseeds and pulses, and other crops), by mode of application (soil broadcasting, fertigation, and foliar spray), and by geography (North America, South America, Europe, Asia-Pacific, the Middle East, and Africa). The market forecasts are provided in terms of value (USD).
| Dry/Granular |
| Liquid |
| Water-Soluble Powder |
| Cereals and Grains |
| Fruits and Vegetables |
| Oilseeds and Pulses |
| Other Crops |
| Soil Broadcasting |
| Fertigation |
| Foliar Spray |
| North America | United States |
| Canada | |
| Mexico | |
| Rest of North America | |
| South America | Brazil |
| Argentina | |
| Rest of South America | |
| Europe | Germany |
| France | |
| Russia | |
| United Kingdom | |
| Rest of Europe | |
| Asia-Pacific | China |
| India | |
| Japan | |
| Australia | |
| Rest of Asia-Pacific | |
| Middle East | Saudi Arabia |
| Turkey | |
| Rest of Middle East | |
| Africa | Nigeria |
| South Africa | |
| Rest of Africa |
| By Form | Dry/Granular | |
| Liquid | ||
| Water-Soluble Powder | ||
| By Crop Type | Cereals and Grains | |
| Fruits and Vegetables | ||
| Oilseeds and Pulses | ||
| Other Crops | ||
| By Mode of Application | Soil Broadcasting | |
| Fertigation | ||
| Foliar Spray | ||
| By Geography | North America | United States |
| Canada | ||
| Mexico | ||
| Rest of North America | ||
| South America | Brazil | |
| Argentina | ||
| Rest of South America | ||
| Europe | Germany | |
| France | ||
| Russia | ||
| United Kingdom | ||
| Rest of Europe | ||
| Asia-Pacific | China | |
| India | ||
| Japan | ||
| Australia | ||
| Rest of Asia-Pacific | ||
| Middle East | Saudi Arabia | |
| Turkey | ||
| Rest of Middle East | ||
| Africa | Nigeria | |
| South Africa | ||
| Rest of Africa | ||


Key Questions Answered in the Report
How large will the NPK fertilizers market be by 2031?
It is projected to reach USD 126.8 billion by 2031 at a 4.2% CAGR over 2026-2031.
Which form currently dominates NPK demand?
Liquid grades hold the largest 61.3% share owing to widespread fertigation in high-value crops.
Which crop segment is growing fastest?
Fruits and vegetables are set to expand at the fastest 3.8% CAGR from 2026 to 2031.
How are producers lowering product carbon intensity?
Companies are installing carbon-capture units, shifting to renewable hydrogen, and issuing verified carbon-attribute certificates.
Page last updated on:


