Nano Fertilizers Market Size and Share
Market Overview
| Study Period | 2021 - 2031 |
|---|---|
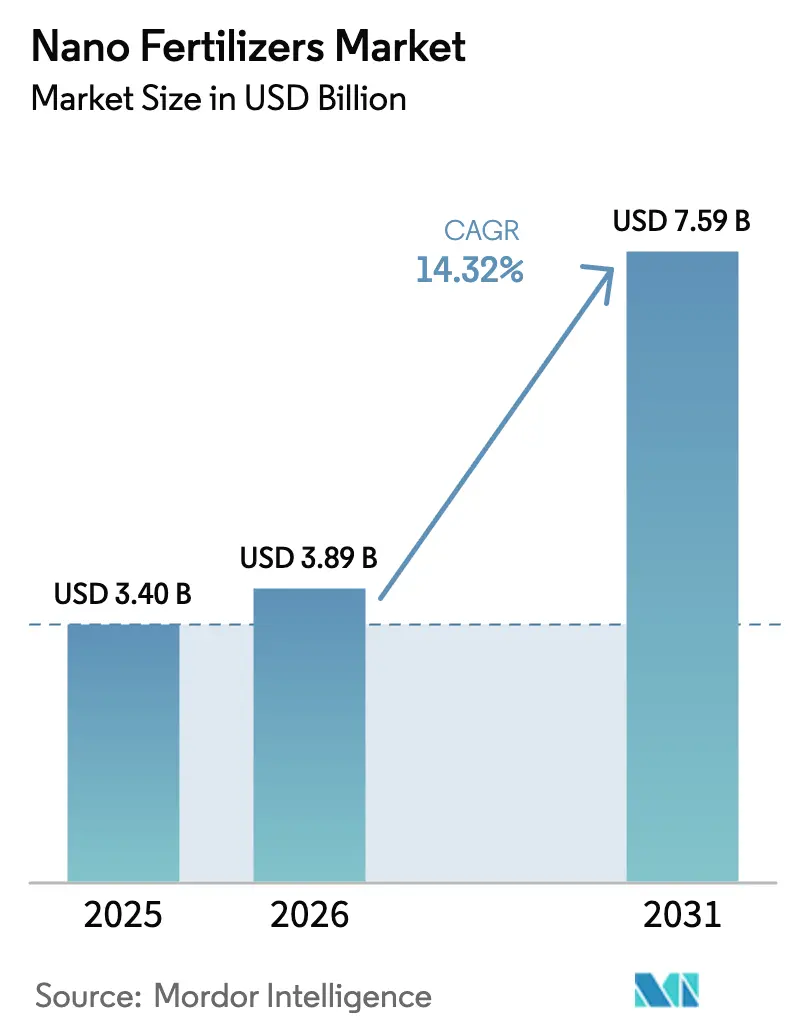
| Market Size (2026) | USD 3.89 Billion |
| Market Size (2031) | USD 7.59 Billion |
| Growth Rate (2026 - 2031) | 14.32% CAGR |
| Fastest Growing Market | Asia Pacific |
| Largest Market | North America |
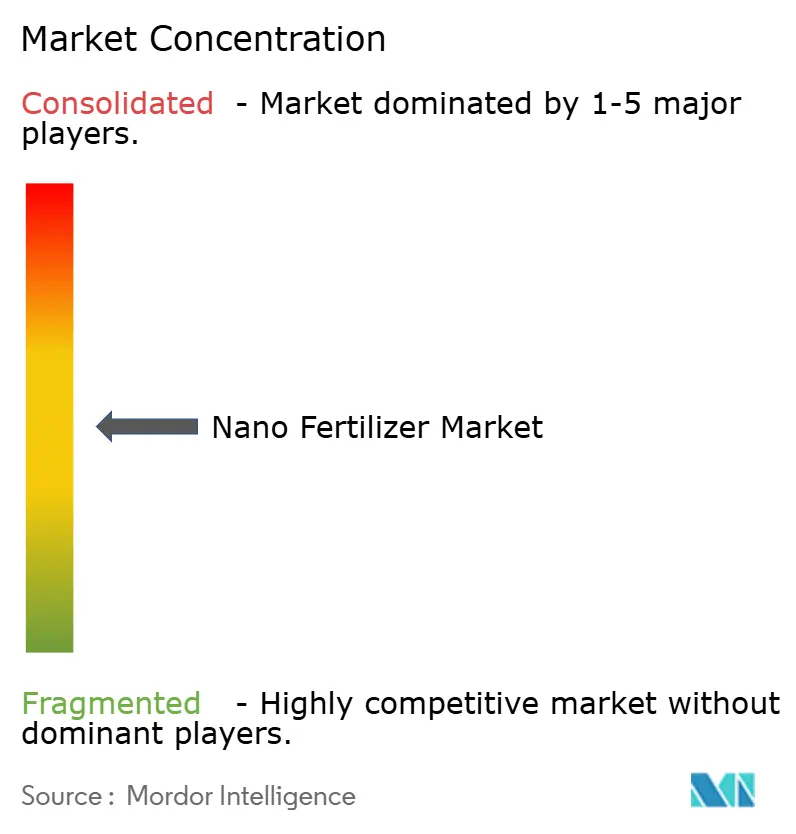
| Market Concentration | Medium |
Major Players *Disclaimer: Major Players sorted in no particular order Image © Mordor Intelligence. Reuse requires attribution under CC BY 4.0. | |
Nano Fertilizers Market Analysis by Mordor Intelligence
Nano fertilizers market size in 2026 is estimated at USD 3.89 billion, growing from 2025 value of USD 3.40 billion with 2031 projections showing USD 7.59 billion, growing at 14.32% CAGR over 2026-2031. The market growth is driven by precision nutrient delivery technologies that reduce input waste, support sustainable farming practices, and meet environmental regulations. The demand for nano fertilizers exceeds conventional fertilizers, indicating a shift toward more efficient agricultural inputs. Major agricultural producers are incorporating nano fertilizers into their integrated farming systems, combining satellite imaging, drone applications, and soil testing. Manufacturers are developing liquid and responsive formulations compatible with existing equipment, while advancements in bio-based nanocarriers help reduce the price difference compared to conventional fertilizer.
Key Report Takeaways
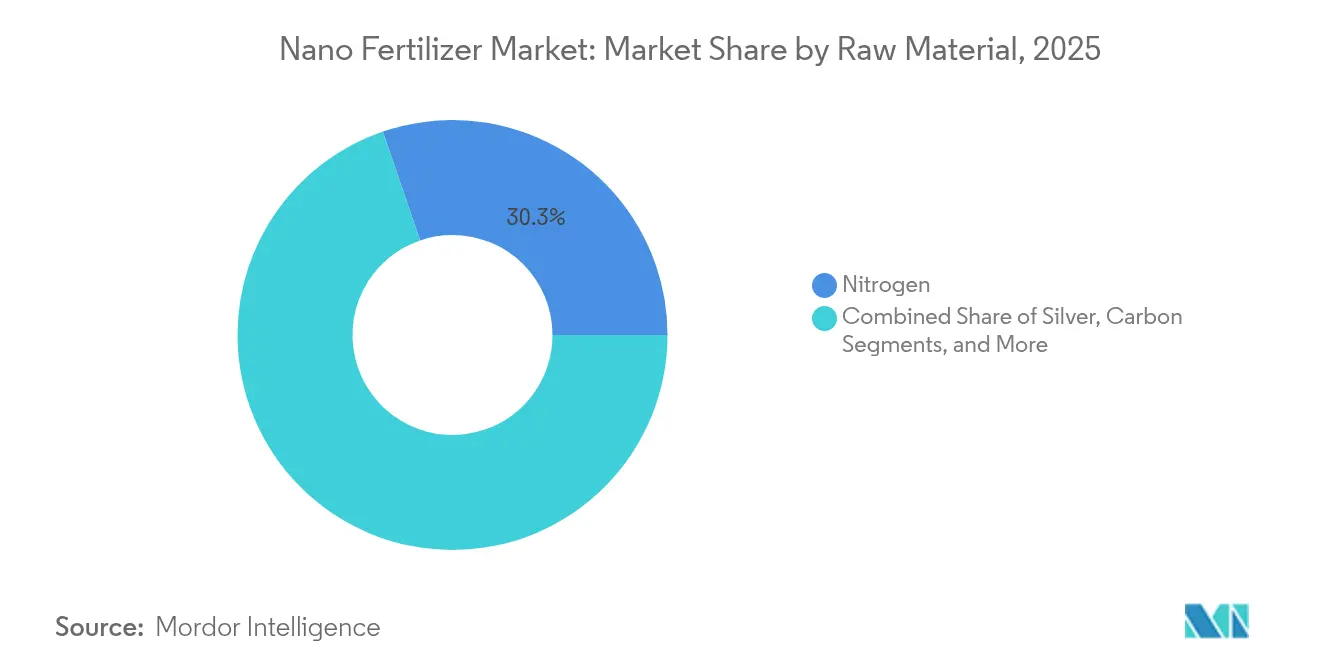
- By raw material, nitrogen dominated with 30.25% market share in 2025, while silver-based products are projected to grow at 12.6% CAGR through 2031.
- By application method, soil treatment led with 54.55% market share in 2025, with foliar spray showing the highest growth at 13.15% CAGR.
- By crop type, cereals and grains dominated with a 46.85% share in 2025, while the fruits and vegetables segment is expanding at a 12.35% CAGR.
- By formulation form, liquid products held 60.10% market share in 2025, while gel and hydrogel formats are growing at 15.95% CAGR.
- By release mechanism, conventional nano-suspension captured 49.95% share in 2025, with stimuli-responsive smart nano-carrier growing fastest at 16.85% CAGR.
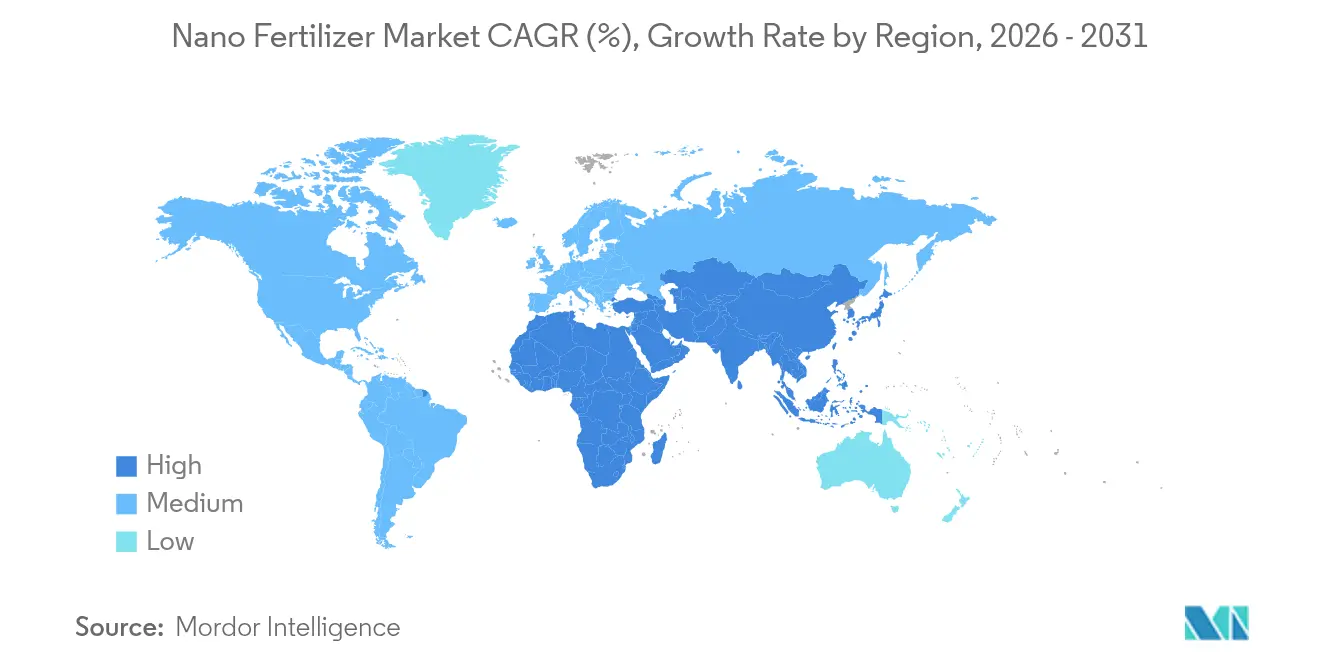
- By geography, North America led with 32.45% revenue share in 2025; Asia-Pacific is projected to expand at an 11.62% CAGR through 2031.
- Indian Farmers Fertiliser Cooperative Ltd. (IFFCO), EuroChem Group, and Aqua-Yield Operations LLC (Nano Yield), controlling 29.4% market share in 2025.
Note: Market size and forecast figures in this report are generated using Mordor Intelligence’s proprietary estimation framework, updated with the latest available data and insights as of 2026.
Global Nano Fertilizers Market Trends and Insights
Drivers Impact Analysis*
| Driver | (~) % Impact on CAGR Forecast | Geographic Relevance | Impact Timeline |
|---|---|---|---|
| Rising adoption of high-efficiency fertilizers | +3.2% | North America, Europe, Asia-Pacific | Medium term (2-4 years) |
| Need to Improve nutrient-use efficiency and land productivity | +2.8% | Global degraded-soil regions | Long term (≥ 4 years) |
| Government subsidies and carbon-credit incentives for Nano fertilizers | +2.4% | India, Europe, Canada, Brazil | Medium term (2-4 years) |
| Drone-enabled precision micro-dosing platforms | +1.9% | North America, Europe, China, Australia | Short term (≤ 2 years) |
| Bio-based Nanocarriers from agri-waste lowering regulatory hurdles | +1.7% | Global, with early adoption in Europe and Asia-Pacific | Medium term (2-4 years) |
| Integration of Nano-fertilizers in regenerative agriculture scoring systems | +1.1% | North America, Europe, Australia | Long term (≥ 4 years) |
| Source: Mordor Intelligence | |||
Rising Adoption of High-Efficiency Fertilizers
Nano formulations provide 30% higher nutrient-use efficiency compared to conventional fertilizers, helping farm operators increase yields while maintaining soil health. These formulations demonstrate absorption rates of up to 80%, enabling 20% higher yields while reducing application volumes by 50%. The shift from heavy bags to compact liquid containers reduces logistics costs for producers. North American corn and European wheat farmers have adopted these solutions, with advisory platforms integrating nano fertilizer guidance into seasonal crop modeling. While nano formulation prices exceed those of granular products, they offer lower total production costs in regions with high land rents and environmental compliance requirements.
Need to Improve Nutrient-use Efficiency and Land Productivity
Nutrient delivery that matches plant uptake is a front-line requirement in regions facing soil degradation. Traditional fertilizers lose up to 50% of their nutrients through leaching and volatilization. Controlled-release nano coatings align nutrient availability with root absorption periods, increasing zinc efficiency by 27% in wheat trials and reducing soil residue buildup by 33%. Food companies seeking to verify sustainable sourcing practices have responded positively to these results, leading to the inclusion of nano-enhanced fertilizers in contract farming specifications. This has created a growing market for suppliers who can demonstrate both agricultural productivity gains and environmental benefits.
Government Subsidies and Carbon-Credit Incentives for Nano Fertilizers
Government policies are creating favorable economic conditions for nano fertilizer products. India's nano urea subsidy reduces farmer costs by 10% compared to conventional urea and drives domestic production expansion. Canada's carbon trading system provides fertilizer-related credits of USD 35-45 per metric ton of CO₂-equivalent reduction, with nano fertilizers qualifying due to reduced nitrous-oxide emissions. These financial incentives increase adoption among price-sensitive users, particularly smallholder farmer cooperatives that combine resources and carbon credit income. Similar regulations in Brazil and the EU are likely to create comparable market effects in the coming years.
Drone-Enabled Precision Micro-Dosing Platforms
Agricultural drones equipped with nano-compatible spray systems deliver precise droplets to plant canopies, increasing foliar absorption to 90% while reducing application volumes by 50%. Field trials in soybean farms and orchards demonstrate 15% higher yields and 20% reduction in fertilizer usage through AI-enabled cameras and variable-rate application paths. Equipment manufacturers offer combined nano-formulation and drone packages through leasing options to reduce initial costs. This integration enables agricultural technology providers to deliver comprehensive nutrient and application services with subscription-based revenue models.
Restraints Impact Analysis*
| Restraint | (~) % Impact on CAGR Forecast | Geographic Relevance | Impact Timeline |
|---|---|---|---|
| High R&D and production costs | -2.10% | Global, smaller manufacturers | Medium term (2-4 years) |
| Competitive pricing pressure from conventional fertilizers | -1.80% | Price-sensitive markets | Short term (≤ 2 years) |
| Uncertain nanoparticle residue regulations in export markets | -1.60% | Europe, Japan, South Korea, and other stringent regulatory markets | Medium term (2-4 years) |
| Consumer perception and nano-toxicity concerns in fresh-produce chains | -1.30% | North America, Europe, high-value export markets | Long term (≥ 4 years) |
| Source: Mordor Intelligence | |||
High R&D and Production Costs
The production costs of laboratory-grade milling, encapsulation, and quality-control systems are three to five times higher than bulk fertilizers. The requirement for precision dispersion lines and advanced coating reactors demands significant capital investment, which creates barriers for smaller companies and maintains moderate market concentration. While scale economies are reducing these costs through bio-based nanocarrier processes that decrease raw material expenses by 35% and reduce processing time, analysts indicate that a 40% additional cost reduction is necessary to achieve price parity with premium conventional fertilizers. This cost gap suggests ongoing industry consolidation and licensing agreements in the medium term.
Competitive Pricing Pressure from Conventional Fertilizers
Bulk nitrogen and phosphate fertilizers maintain extensive distribution networks and low production costs, resulting in nano-fertilizer alternatives being priced 70-150% higher in many commodity crop markets. While farmer surveys indicate interest in the performance advantages of nano-fertilizers, only 25% of producers are willing to pay current premium prices. This pricing challenge is especially significant in feed-grain segments with narrow profit margins. Suppliers are responding by offering concentrated liquid formulations to reduce transportation costs and harvest-based payment plans to distribute costs throughout the growing season. The price sensitivity continues to limit market expansion in the short term.
*Our forecasts treat driver/restraint impacts as directional, not additive. The impact forecasts reflect baseline growth, mix effects, and variable interactions.
Segment Analysis
By Raw Material: Nitrogen Leads, Silver Gains Ground
Nitrogen-based formulations represent 30.25% of the nano fertilizers market size in 2025, due to their essential role in protein synthesis and chlorophyll formation in staple crops. These formulations achieve utilization rates of 80-90%, significantly higher than conventional urea's 35%. IFFCO's nano urea demonstrates the logistical advantages, as a 500 ml bottle replaces a 45 kg bag, reducing transport and handling costs. The widespread adoption in India's and South America's grain-producing regions demonstrates nitrogen's versatility, though regulatory bodies are increasing scrutiny of nanoparticle discharge, leading companies to emphasize biodegradability studies.
Silver-based nano fertilizers project a 12.6% CAGR through 2031, driven by their dual agricultural benefits. Research on tomatoes and berries shows a 70% reduction in pathogen presence at silver concentrations of 15-25 ppm, alongside improvements in yield quality. This combination particularly benefits export-focused horticulture operations where disease control directly impacts revenue. In response to stricter silver residue regulations, manufacturers are developing reduced-dose formulations that maintain antimicrobial effectiveness while complying with the EU and Japan's maximum-residue-level requirements.


By Application Method: Soil Treatment Dominates, Foliar Spray Accelerates
Soil treatments account for 54.55% of the nano fertilizers market size in 2025, primarily due to farmers' experience with in-furrow and broadcasting equipment. The controlled-release nano coatings reduce nutrient leaching by up to 60%, which is significant for regions with nitrate restrictions. The compatibility with existing farm machinery eliminates equipment upgrade costs, facilitating adoption among mid-sized family farms.
Foliar spray applications demonstrate a 13.15% CAGR, driven by rapid leaf absorption that reduces response time and overall nutrient requirements. With absorption rates reaching 90%, farmers can reduce application volumes, while drone-based delivery enhances application precision. Greenhouse vegetable growers in the Netherlands achieve a return on investment within one season due to increased marketable yield and decreased labor costs for ground spraying operations.
By Crop Type: Cereals and Grains Hold Sway, Fruits and Vegetables Advance
Cereals and grains hold a 46.85% market share in 2025, primarily due to extensive cultivation areas for wheat, rice, and maize. Research demonstrates that nano zinc applications increase rice yields by 20% and enhance grain micronutrient content, leading to sustained farmer adoption across growing seasons. Agricultural extension services in Asia have incorporated nano fertilizer guidelines into nutrient management protocols, facilitating widespread implementation.
The fruits and vegetables segment is projected to grow at a 12.35% CAGR, driven by improved crop quality through precise nutrient timing. Research indicates that silicon nano fertilizers increase tomato shelf life by 25% and boost vitamin C content by 15%, benefits that translate directly into favorable supermarket procurement terms. Despite higher input costs, the significant returns have led to increased adoption, particularly among export-oriented producers in the Mediterranean and Andean regions.
By Formulation Form: Liquid Reigns, Gel and Hydrogel Surge
Liquid products held a 60.10% market share in 2025, as their flow properties enable effective application through drip irrigation, pivot systems, and aerial spraying without nozzle blockage. These formulations achieve a 30-40% lower coefficient of variation compared to granular products, resulting in uniform crop development and increased marketable yields in broadacre farming.
The gel and hydrogel segment projects a 15.95% CAGR. These formulations utilize hydrophilic polymers to retain soil moisture and control nutrient release, reducing irrigation requirements by up to 30% in water-deficient areas. Their 35-45% improvement in nutrient-use efficiency makes them essential in regions with strict water regulations, particularly in Australia and North Africa.

By Release Mechanism: Conventional Nano-Suspension Leads, Smart Carriers Scale Up
Conventional nano-suspension formats maintained a 49.95% market share in 2025, combining effectiveness with manufacturing efficiency. These formulations, using basic dispersion stabilizers, provide farmers with 20-30% higher nutrient utilization compared to conventional inputs, supporting price premiums across oilseed and forage applications.
The stimuli-responsive smart nano-carrier segment is growing at a 16.85% CAGR. pH-triggered phosphorus carriers increase nutrient uptake by 45% in calcareous soils, and temperature-responsive shells synchronize nutrient release with seasonal temperature changes. While current production constraints limit manufacturing capacity, patent activities suggest increased scaling potential as major chemical manufacturers acquire university intellectual property and modify existing fertilizer granulation facilities for nano-material integration.
Geography Analysis
North America dominated the nano fertilizers market with a 32.45% share in 2025, supported by a research ecosystem that invests USD 2.2 billion annually in nanotechnology programs. Federal grants of USD 475 million support food-system innovations focused on reducing nutrient losses, enabling rapid product validation.Adoption rates are highest in precision-managed maize and specialty fruit operations, where performance benefits justify the 70-150% price premium over conventional fertilizers. Suppliers utilize established retailer networks and digital agronomy platforms to provide integrated advisory solutions, incorporating nano products within data-driven management systems.
Asia-Pacific exhibits the highest growth rate with an 11.62% CAGR through 2031. India drives volume growth through subsidized nano urea distribution to smallholders via cooperative networks, replacing traditional fertilizer bags with compact bottles. China addresses micronutrient deficiencies by implementing zinc and iron nano solutions to improve nutritional content in staple crops. Agricultural systems across Southeast Asia and Oceania adopt nano fertilizers to address soil degradation, water scarcity, and climate-related yield variations. Market adoption remains strongest in export-oriented plantations where meeting residue limits and sustainability certifications provides price advantages.
Europe's market development aligns with environmental regulations emphasizing biodegradability and minimal runoff. The Farm to Fork Strategy's goal to reduce nutrient losses by 50% by 2030 positions nano fertilizers as regulatory compliance solutions. Manufacturers focus on developing plant-based nanocarriers and biodegradable coatings to obtain European Food Safety Authority approvals. Adoption is concentrated in greenhouse horticulture and high-value field crops, where precise nutrient management enhances market position with quality-focused retail chains. University research partnerships facilitate pilot-scale testing, enabling the quick development of environmentally sustainable formulations.

Competitive Landscape
The nano fertilizers market demonstrates moderate concentration, with three major suppliers, Indian Farmers Fertiliser Cooperative Ltd. (IFFCO), EuroChem Group, and Aqua-Yield Operations LLC (Nano Yield), controlling 30.0% market share in 2024. Specialized innovators and regional firms operate in the remaining market segments. The industry's high intellectual-property requirements provide established companies with competitive advantages, while traditional fertilizer manufacturers are investing in acquisitions and research to accelerate new product development.
IFFCO maintains market leadership through its vertically integrated operations from research to distribution. The company's nano urea product improves logistics efficiency by replacing 45 kg bags with 500 ml bottles. The cooperative has increased annual production capacity to 2.5 billion bottles and facilitates adoption through educational programs at rural service centers across India's small-scale farming communities.
EuroChem Group serves premium horticultural and controlled-environment agriculture markets. The company's NutriSmart product line features pH-responsive coatings that increase phosphorus availability by 45% in alkaline soils. The integration with farm management software improves customer retention by providing precise application timing and dosage recommendations for variable-rate equipment.
Nano Fertilizers Industry Leaders
Indian Farmers Fertiliser Cooperative Ltd. (IFFCO)
EuroChem Group
Aqua-Yield Operations LLC
Lazuriton Nano Biotechnology Co., Ltd.
AG CHEMI GROUP s.r.o.
- *Disclaimer: Major Players sorted in no particular order

Recent Industry Developments
- May 2025: IFFCO inaugurated a new nano urea plant in Kandla, Gujarat, raising annual capacity to 2.5 billion bottles.
- December 2024: Coromandel International partnered with the Indian Agricultural Research Institute to commercialize rice-husk-based nanocarriers.
- November 2024: Geolife Agritech introduced NanoGel, a hydrogel nano fertilizer that trims irrigation by 25% in vegetable trials.
- August 2024: Indogulf BioAg launched BioDrone, integrating drone hardware with optimized nano-formulations for orchard crops.


Research Methodology Framework and Report Scope
Market Definitions and Key Coverage
Our study defines the nano-fertilizer market as commercial-grade plant nutrient products whose active ingredients are encapsulated, coated, or carried on nanomaterials to enable controlled, high-efficiency release into soil or foliar surfaces. According to Mordor Intelligence, value tracking begins only once a formulation receives regulatory clearance and is sold in bulk to distributors or directly to farms.
Scope Exclusion: laboratory research samples, nano-enhanced biostimulants, and conventional micro-nutrient coatings are outside this report.
Segmentation Overview
- By Raw Material
- Nitrogen
- Silver
- Carbon
- Zinc
- Other Raw Materials
- By Application Method
- Foliar Spray
- Soil Treatment
- Seed/Root Dipping
- Fertigation
- By Crop Type
- Cereals and Grains
- Oilseeds and Pulses
- Fruits and Vegetables
- Plantation and Cash Crops
- By Formulation Form
- Liquid
- Powder and Granule
- Gel and Hydrogel
- By Release Mechanism
- Conventional Nano-Suspension
- Controlled-Release Nanoshell
- Stimuli-Responsive Smart Nano-Carrier
- By Geography
- North America
- United States
- Canada
- Mexico
- Rest of North America
- Europe
- Germany
- United Kingdom
- France
- Russia
- Spain
- Rest of Europe
- Asia-Pacific
- India
- China
- Japan
- Australia
- Rest of Asia-Pacific
- South America
- Brazil
- Argentina
- Rest of South America
- Middle East
- Saudi Arabia
- United Arab Emirates
- Rest of Middle East
- Africa
- South Africa
- Rest of Africa
- North America
Detailed Research Methodology and Data Validation
Primary Research
Interviews with agronomists, nano-material chemists, and fertilizer wholesalers across North America, India, Brazil, and Kenya, plus structured surveys of farmer cooperatives, validated adoption curves, average selling prices, and energy-linked cost sensitivities that secondary data could not capture.
Desk Research
During desk work, we consulted open datasets such as FAO fertilizer consumption panels, OECD soil nutrient balance sheets, India's Department of Chemicals production bulletins, USGS nano-material patent counts, and peer-reviewed articles in ACS Nano that benchmark release kinetics. Company 10-Ks, World Bank ammonia price decks, and regional trade portals supplied baseline cost and trade clues.
Subscription inputs from D&B Hoovers, Dow Jones Factiva, and Questel let our team verify producer revenues, deal flow, and patent velocity, tightening supply-side estimates. The sources listed are illustrative; many other public records were assessed before figures progressed to modeling.
Market-Sizing & Forecasting
The model starts with a top-down reconstruction of global fertilizer spending, then assigns the share captured by nano formulations using uptake rates derived from the above sources. Supplier roll-ups of nano-urea and nano-zinc volumes, cross-checked with sampled CIF pricing, provide bottom-up sanity checks.
A multivariate regression links hectare expansion under precision farming, nutrient-use efficiency gains, oil-price-driven ammonia costs, per-ton carbon levy trajectories, regional yield-gap targets, and upcoming regulatory approvals to forecast demand through 2030. Data voids are bridged with nearest-neighbor estimates that are re-tested during review.
Data Validation & Update Cycle
Outputs pass variance screens, peer review, and director sign-off. We refresh models each year and trigger interim updates when policy changes, major capacity additions, or climate shocks alter assumptions, ensuring clients always receive the latest view.
Why Mordor's Nano Fertilizer Baseline Commands Reliability
Published figures often diverge because firms choose different product mixes, currency bases, and forecast cut-offs.
Key gap drivers include the bundling of nano-coatings with micro-nutrient products, uniform price erosion assumptions, and back-casting from pilot trials without on-field validation. Mordor keeps scope to market-ready, registered nano formulations and calibrates prices to regional energy indices, producing a balanced, transparent baseline.
Benchmark comparison
| Market Size | Anonymized source | Primary gap driver |
|---|---|---|
| USD 3.40 billion (2025) | Mordor Intelligence | - |
| USD 3.08 billion (2024) | Global Consultancy A | Bundles slow-release micro coatings; earlier base year |
| USD 3.01 billion (2022) | Global Consultancy B | Uses static ASPs; older currency conversion |
| USD 2.50 billion (2023) | Trade Journal C | Extrapolates from limited pilot projects |
The comparison shows that while external values cluster around ours, methodology gaps, especially on scope and price treatment, explain residual variance. By anchoring estimates to verified volumes, region-specific pricing, and disciplined refresh cycles, Mordor Intelligence delivers a reliable starting point for strategic decisions.


Key Questions Answered in the Report
What is the current size of the nano fertilizers market?
The nano fertilizers market is valued at USD 3.89 billion in 2026 and is projected to reach USD 7.59 billion by 2031.
Which region leads the nano fertilizers market?
North America holds the largest revenue share at 32.45% in 2025, supported by strong R&D funding and precision-agriculture adoption.
Why are liquid nano fertilizers so popular?
Liquid formulations represent 60.10% of market share in 2025 because they disperse easily, suit common equipment, and deliver uniform nutrient coverage.
How do government policies influence market growth?
Subsidies and carbon-credit schemes in India, Canada, and the EU lower farmer costs and reward emissions cuts, adding up to 2.4 percentage points to forecast CAGR.
Are production costs for nano fertilizers falling?
Yes. Bio-based nanocarriers and scaling efficiencies have trimmed costs by around 35%, and further declines are projected as manufacturing matures.
Page last updated on:


