Market Overview
| Study Period | 2021 - 2031 |
|---|---|
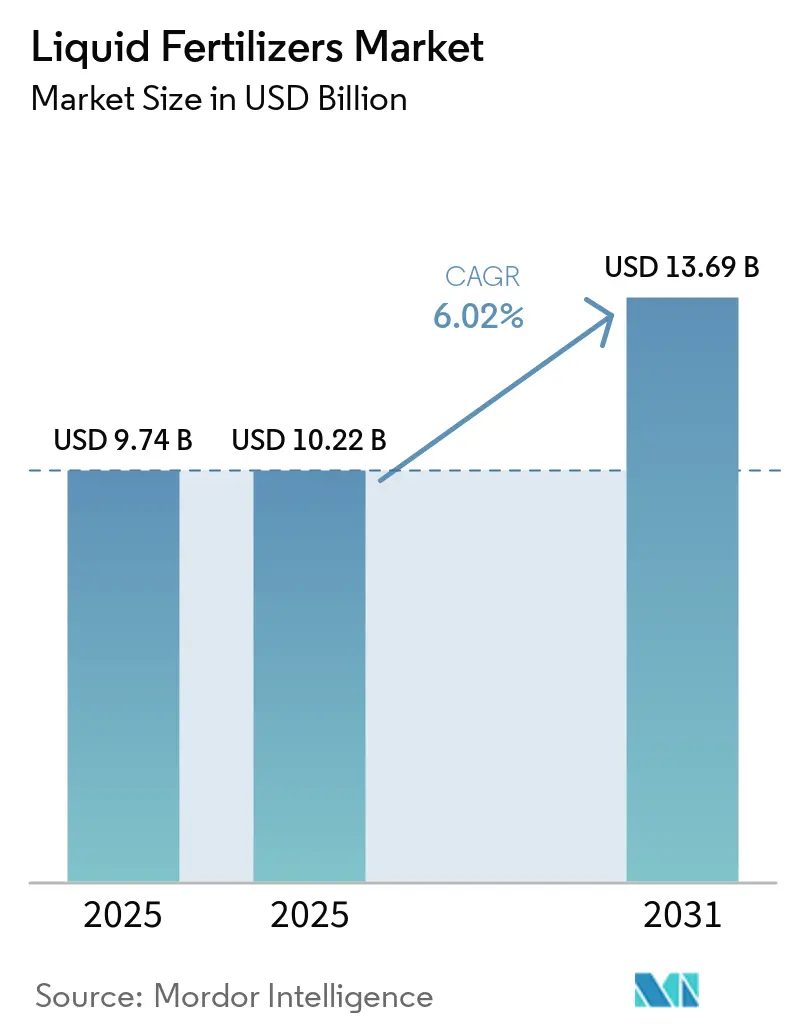
| Market Size (2025) | USD 10.22 Billion |
| Market Size (2031) | USD 13.69 Billion |
| Growth Rate (2026 - 2031) | 6.02% CAGR |
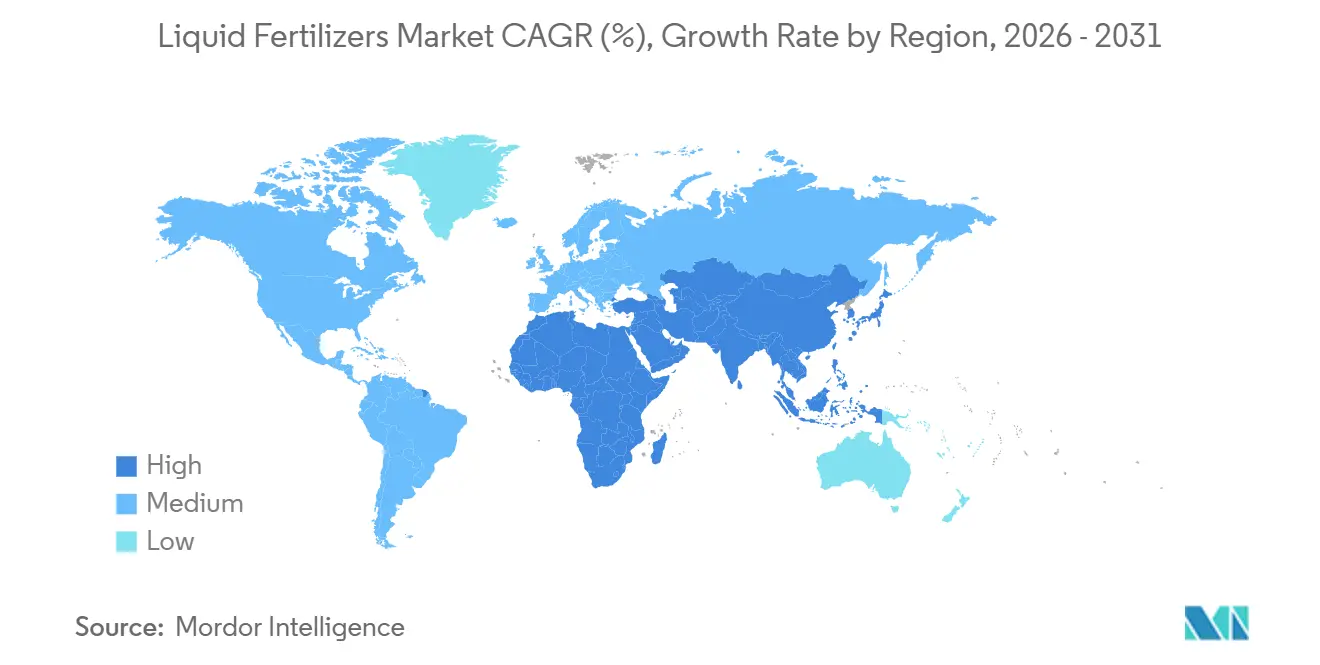
| Fastest Growing Market | Middle East |
| Largest Market | Asia Pacific |
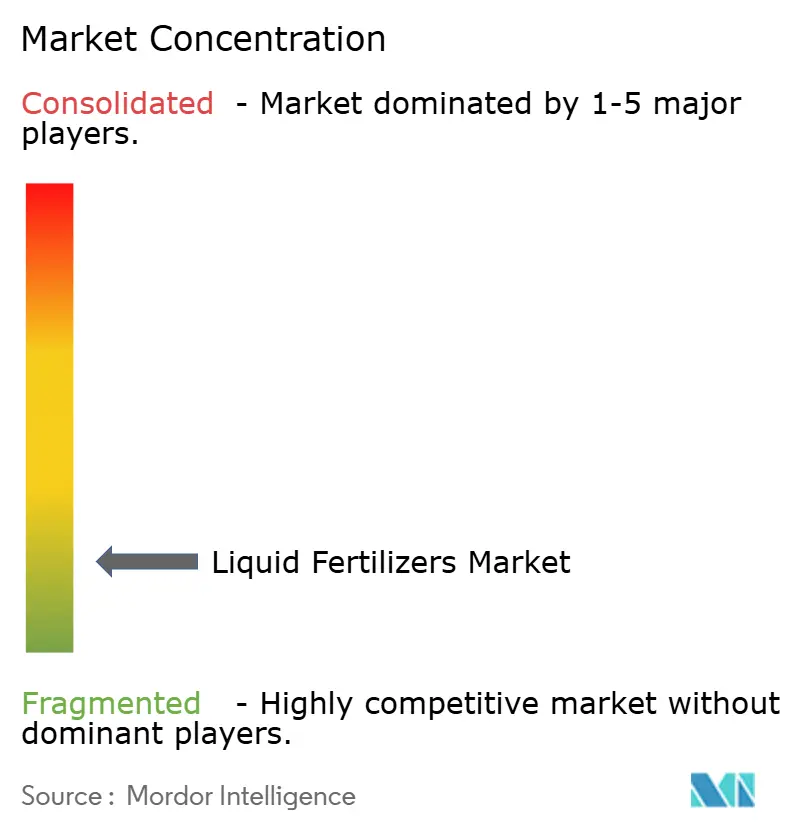
| Market Concentration | Low |
Major Players *Disclaimer: Major Players sorted in no particular order Image © Mordor Intelligence. Reuse requires attribution under CC BY 4.0. | |
Liquid Fertilizers Market Analysis by Mordor Intelligence
The liquid fertilizers market size was valued at USD 9.74 billion in 2025 and is estimated to grow from USD 10.22 billion in 2026 to USD 13.69 billion by 2031, at a CAGR of 6.02% during the forecast period (2026-2031). Precision irrigation, green ammonia electrolysis, and government subsidy programs are pulling soluble formulations into mainstream farm practice, particularly across the Asia-Pacific and water-stressed parts of Africa. Nitrogenous liquids retained dominance in 2025 because urea-ammonium nitrate solutions match cereal crop phenology, while micronutrient blends are surging as smallholder growers confront chronic zinc and boron deficiencies. Real-time IoT blending units and drone-based foliar platforms are reducing application waste, elevating return on investment for field crops and horticulture operators alike. At the same time, rising scrutiny of Per- and polyfluoroalkyl substances (PFAS) chelating agents and the capital burden of corrosive-resistant logistics temper widespread adoption, leaving profitability finely balanced through 2031.
Key Report Takeaways
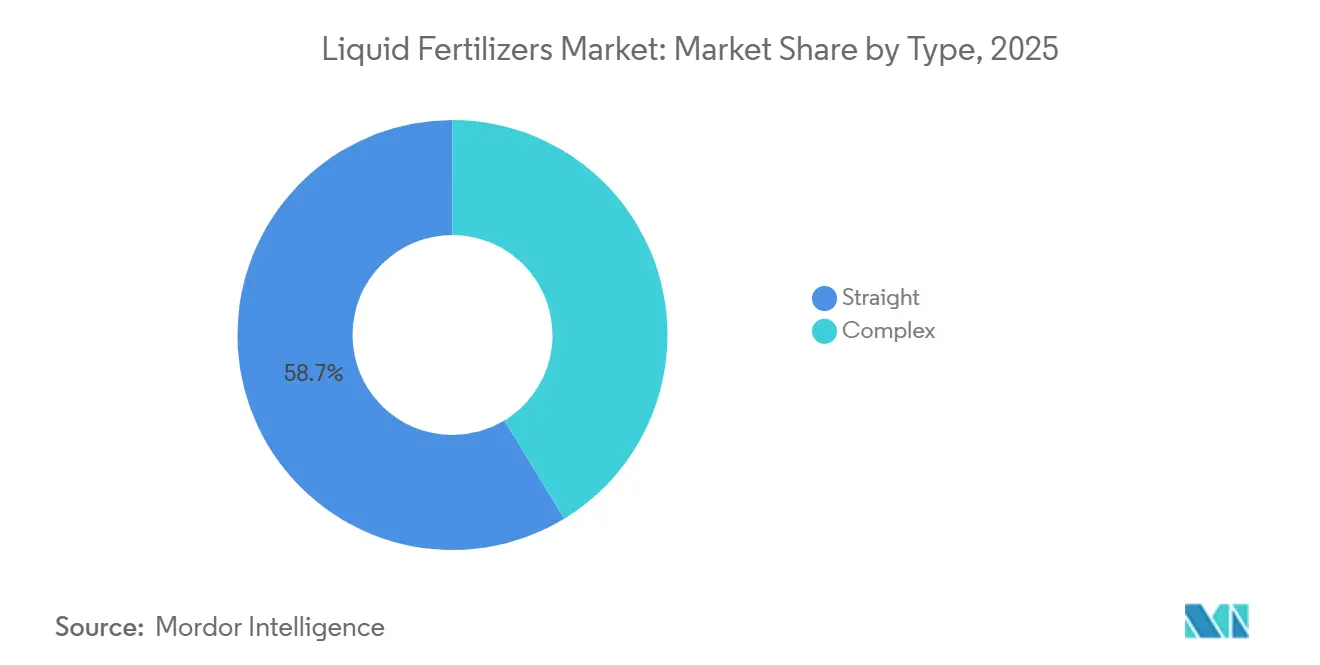
- By type, straight fertilizers accounted for 58.7% of the liquid fertilizers market share in 2025, making them the largest product category. Complex fertilizers are projected to be the fastest-growing segment, advancing at a CAGR of 7.7% during 2026 to 2031.
- By application mode, fertigation represented the largest application segment, contributing 62.6% of the liquid fertilizers market size in 2025, and is also forecast to record the fastest growth, expanding at a CAGR of 7.3% through 2031.
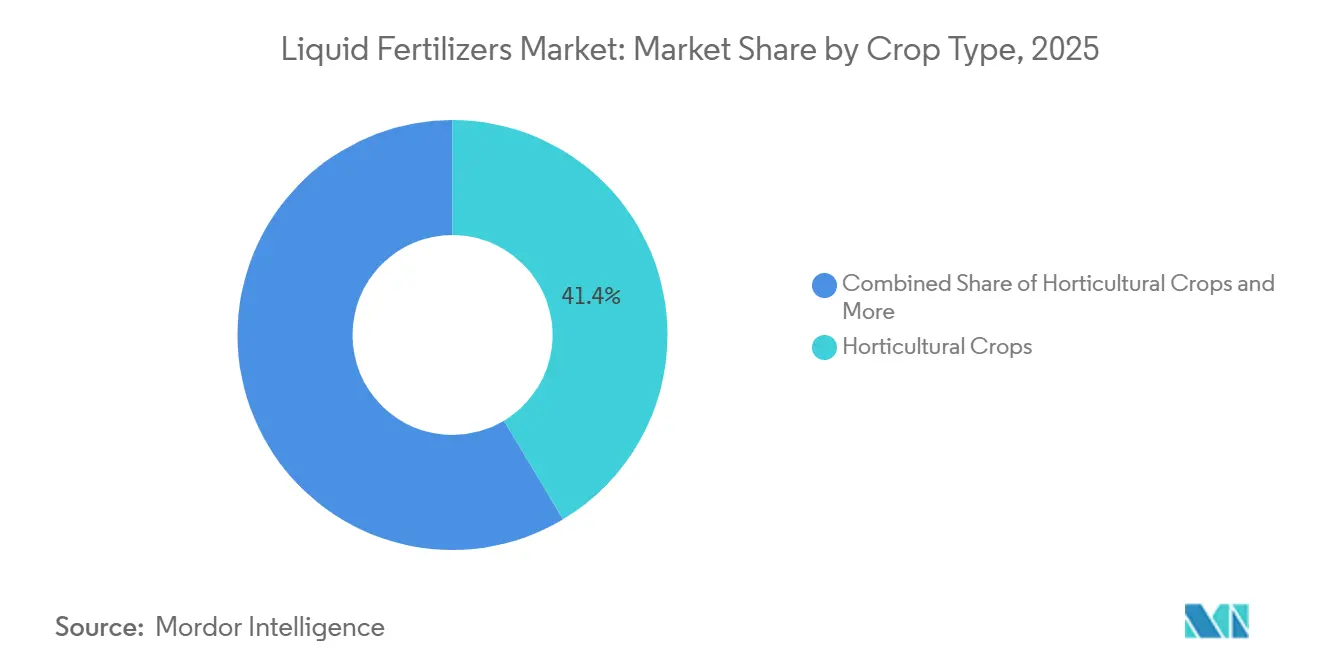
- By crop type, horticultural crops contributed 41.4% of liquid fertilizer market in 2025, remaining the largest demand center. Turf and ornamental crops are forecast to expand at the highest rate, registering a CAGR of 7.9% during 2026 to 2031.
- By geography, Asia-Pacific led global liquid fertilizer revenue with a 39.9% share in 2025, while the Middle East is projected to deliver the strongest regional growth at a CAGR of 8.1% through 2031.
Note: Market size and forecast figures in this report are generated using Mordor Intelligence’s proprietary estimation framework, updated with the latest available data and insights as of January 2026.
Global Liquid Fertilizers Market Trends and Insights
Drivers Impact Analysis*
| Driver | (~) % Impact on CAGR Forecast | Geographic Relevance | Impact Timeline |
|---|---|---|---|
| Precision irrigation adoption accelerates liquid uptake | +1.8% | Asia-Pacific core, the Middle East, Africa, and South America spillover | Medium term (2-4 years) |
| Rapid shift toward balanced crop nutrition programs | +1.3% | Global, concentrated in North America, Europe, and the Asia-Pacific | Medium term (2-4 years) |
| Government subsidies favoring fertigation solutions | +1.5% | India, Bangladesh, Vietnam, Nigeria, Kenya, and selected South America markets | Short term (≤ 2 years) |
| Drone-based micro-spray fertilization platforms | +0.9% | Smallholder zones in Asia-Pacific, emerging Africa, and South America pilots | Long term (≥ 4 years) |
| On-farm IoT blending systems enabling just-in-time mixes | +1.1% | North America, Europe, and advanced Asia-Pacific operations | Medium term (2-4 years) |
| Nitrate-from-ammonia electrolysis lowering production cost | +0.6% | Global, early adoption in Europe | Long term (≥ 4 years) |
| Source: Mordor Intelligence | |||


Precision Irrigation Adoption Accelerates Liquid Uptake
Water scarcity is propelling drip and micro-sprinkler rollouts, and fertigation lines paired with soluble liquids reduce nutrient waste by up to 30% compared with granular broadcasting. The extensive use of drip and micro-sprinkler systems aligns water and nutrient delivery, allowing farmers to shift from granular top-dressing to in-line fertigation. This approach reduces runoff and leaching. The United States Department of Agriculture 2024 Fertilizer Production Expansion Program has allocated USD 500 million to enhance capacity, directly benefiting precision irrigation users. This reflects public acknowledgment of the 15-30% nutrient-use efficiency improvements achieved with liquid fertilizers [1]Source: United States Department of Agriculture, “Fertilizer Production Expansion Program (FPEP) Grant Application Requirements,” usda.gov. Liquids dissolve instantly, eliminating emitter clogging that undermines granular solubility in narrow lines.
Rapid Shift Toward Balanced Crop Nutrition Programs
The 4R stewardship framework emphasizes right source, rate, time, and placement, and multi-nutrient liquids deliver balanced blends in a single pass. Extension agents in the United States and France now recommend split nitrogen-phosphorus-micronutrient applications tied to crop growth stages, boosting uptake efficiency. Growers facing plateauing yield curves for single-nutrient programs view balanced liquids as the next lever for incremental gains. Agronomists also note that liquids lower soil acidification relative to repeated urea granule use, preserving long-term field productivity. The liquid fertilizers market benefits because reformulated blends earn premium margins while meeting sustainability metrics demanded by downstream food brands.
Government Subsidies Favoring Fertigation Solutions
India’s Pradhan Mantri Krishi Sinchayee Yojana increased drip kit reimbursements in 2025 and bundled liquid-nutrition vouchers worth INR 5,000 (USD 60) per hectare, compressing payback periods to below 18 months. Bangladesh and Vietnam followed with rice-focused programs, while Nigeria and Kenya cover as much as 50% of the fertigation system costs for smallholders. These policies tilt economics toward the liquid fertilizers market, displacing granular imports from mature manufacturers. The momentum will continue through 2027 as governments seek food security amid erratic rainfall.
Drone-Based Micro-Spray Fertilization Platforms
Commercial drone services introduced across China, India, and Brazil in 2025 apply micro-doses of liquid micronutrients at the canopy level, correcting deficiencies within days. Variable-rate maps generated from multispectral imagery cut overlap, conserving expensive chelated trace elements. The technology shines on fragmented plots unreachable by tractor sprayers, a common barrier in smallholder landscapes. Regulatory approvals for agricultural drones widened across Asia-Pacific and South America in 2024, resolving safety bottlenecks. As battery life, payload, and autonomous flight software advance, drone spraying will move from high-value horticulture toward mainstream row crops before 2031.
Restraints Impact Analysis*
| Restraint | (~) % Impact on CAGR Forecast | Geographic Relevance | Impact Timeline |
|---|---|---|---|
| High volatilization and leaching losses in warm climates | -1.2% | Tropical Asia-Pacific, Sub-Saharan Africa, and humid South America | Short term (≤ 2 years) |
| Corrosive storage and handling infrastructure costs | -0.9% | Global, acute in emerging economies lacking specialized logistics | Medium term (2-4 years) |
| Per- and polyfluoroalkyl substances (PFAS) contamination scrutiny on certain chelating agents | -0.7% | North America, Europe, and regulatory spillover to the Asia-Pacific | Medium term (2-4 years) |
| Stricter container-weight rules are raising freight expenses | -0.6% | North America, Europe, and selected Asia-Pacific markets | Short term (≤ 2 years) |
| Source: Mordor Intelligence | |||
High Volatilization and Leaching Losses in Warm Climates
Soluble nitrogen faces rapid ammonia gas release above 30 °C, and monsoon rains wash unfixed nitrate below root zones within hours. Trials in Vietnam and Ghana showed nitrogen-use efficiency 15% to 25% lower than at temperate sites[2]Source: Food and Agriculture Organization, “Water Resources Management for the Four Betters 2024-25,” fao.org. Growers respond by limiting liquid use to greenhouses or protected horticulture, thereby capping volume growth. Inhibitor additives reduce losses but add USD 50-80 per metric ton, narrowing the cost gap with coated granules. Unless bio-based inhibitors become cheaper, adoption will lag in warm, humid regions.
Stricter Container-Weight Rules Raising Freight Expense
While federal weight limits remained steady in 2025, the introduction of the VARIANCE Act in June 2025 provided a 10% axle weight allowance for dry bulk tankers to improve payload efficiency. Simultaneously, the EU's December 2025 position on the Weights and Dimensions Directive aimed to increase total weight allowances for zero-emission trucks to 44 metric tons to offset the weight of heavy battery systems[3]Source: European Council, “Council sets position on maximum weights and dimensions for road vehicles,” consilium.europa.eu. Reducing liters per trip increases the cost per ton-kilometer, putting pressure on already narrow distributor margins. While rail freight offers an alternative, the limited availability of dedicated stainless steel cars creates scheduling challenges. Some suppliers are transitioning to regional blending hubs near agricultural areas, which raises the need for additional local storage. Without investments in specialized logistics assets, delivered prices are likely to remain high.
*Our forecasts treat driver/restraint impacts as directional, not additive. The impact forecasts reflect baseline growth, mix effects, and variable interactions.
Segment Analysis
By Type: Straight Fertilizers Lead Revenue, Complex Products Gain Momentum
Straight fertilizers accounted for 58.7% of the liquid fertilizers market share in 2025, establishing them as the largest product category. Their dominance is attributed to their extensive use in variable-rate nutrient programs, which enable growers to address specific nutrient deficiencies with greater precision through individual nutrient applications. Nitrogenous liquid fertilizers remain a key component of straight-product demand, particularly in cereal production systems. Additionally, on-farm blending capabilities enhance their operational flexibility across various cropping environments.
Complex fertilizers are anticipated to be the fastest-growing segment, with a projected CAGR of 7.7% during 2026–2031. Multi-nutrient formulations are increasingly utilized in orchard, horticultural, and specialty crop systems, where a single application provides balanced nutrition. The ongoing development of chelated and specialty nutrient blends is driving their adoption in high-value agriculture. Furthermore, advancements in formulation technology are improving their compatibility with modern fertigation and precision nutrient management systems.


By Application Mode: Fertigation Leads Adoption and Growth
Fertigation accounted for the largest application segment, contributing 62.6% of the liquid fertilizers market size in 2025. It is also projected to experience the fastest growth, with a CAGR of 7.3% through 2031. This method combines irrigation and nutrient delivery, reducing field labor and diesel consumption while enhancing nutrient-use efficiency. Many drip irrigation systems now come equipped with pre-installed venturi injectors, simplifying the adoption of liquid fertilizers for new installations. Additionally, equipment manufacturers are increasingly integrating moisture probes, electrical conductivity sensors, and flow meters with digital controllers, enabling automated nutrient dosing based on sensor data. The integration of these systems with cloud platforms allows agronomists to manage extensive areas remotely, further increasing the appeal of fertigation-based nutrient management programs.
Foliar application remains a significant method for addressing mid-season nutrient deficiencies that can impact crop yield and quality. By applying nutrients directly to leaves, this method bypasses root-zone limitations and is widely used in fruit and vegetable production and in protected cultivation systems. Instances such as Brazil's citrus belt and China's greenhouse tomato clusters highlight the effectiveness of foliar nutrient programs in addressing deficiencies like iron chlorosis. However, adoption varies depending on crop morphology, as factors like dusty maize leaves or waxy cabbage surfaces can hinder nutrient absorption. Straight formulations dominate foliar product portfolios due to their lower risk of phytotoxicity, though advancements in controlled-release coating technologies may enhance safety and performance in the future.
By Crop Type: Horticulture Dominates Consumption, Turf and Ornamentals Accelerate
Horticultural crops accounted for 41.4% of liquid fertilizer market size in 2025, representing the largest crop segment. This dominance is driven by the intensive nutrient management needs of greenhouse vegetables, berries, orchard fruits, and other high-value crops, resulting in higher per-hectare fertilizer expenditures. The adoption of liquid micronutrient and biostimulant blends is increasing, as these products enhance crop quality, size, color, and shelf life. In the Netherlands, hydroponic tomato growers are increasingly recirculating nutrient solutions to improve resource efficiency, while indoor farming systems in Japan and the United States utilize automated liquid nutrient dosing to enable year-round production.
Turf and ornamental crops are projected to be the fastest-growing category, registering a CAGR of 7.9% during 2026–2031. This growth is driven by golf course renovations, landscaping projects, sports facilities, and urban greening initiatives, all of which require consistent nutrient management and adherence to aesthetic standards. The segment is increasingly adopting premium liquid fertilizer formulations that enhance turf quality while minimizing nutrient losses. Field crops continue to account for a significant share of liquid fertilizer demand, driven by large-scale cultivation of maize, wheat, and rice in key agricultural regions.
Geography Analysis
Asia-Pacific was the largest regional market, accounting for 39.9% of the liquid fertilizers market in 2025., buoyed by India’s surge in drip subsidies and China’s precision farming push. Japan and South Korea use recirculating nutrient solutions in greenhouse vegetable production to comply with strict discharge rules. Australia’s broadacre cereal belt experiments with variable-rate liquid maps generated from conductivity scans, aiming to close intra-field yield gaps. Bangladesh, Pakistan, and Vietnam trail on absolute penetration, but demonstration plots under state extension programs are narrowing knowledge gaps among rice and vegetable growers.
The Middle East region is growing at an 8.1% CAGR through 2031, from a small base. Nigeria’s tomato clusters and Kenya’s avocado orchards adopted community fertigation hubs that pool stainless storage to manage capex hurdles. South Africa’s wine and citrus exporters rely on iron and zinc chelates to meet European residue standards, and success stories travel quickly through grower networks.
North America and Europe are focusing on upgrading existing agricultural acreage with IoT-optimized dosing systems rather than expanding cultivated areas. In the United States, corn and soybean growers use real-time aerial imagery to calibrate mid-season liquid nitrogen applications, reducing excess use that could exceed state nutrient regulations. In Europe, the Nitrates Directive drives demand for precision liquid fertilizers that comply with the 170 kg N/ha limit, with notable adoption in countries such as the Netherlands and Denmark. Eastern European markets face challenges due to fragmented farms and limited fertigation infrastructure. Nonetheless, European Union carbon border taxes may provide funding opportunities for efficiency improvements. South America is experiencing significant growth rate, driven by Brazil’s sugarcane fertigation practices and Argentina’s specialty fruit exports.

Competitive Landscape
The liquid fertilizers market remains highly fragmented, with the five largest players accounting for a significant share, including Yara International ASA, Sociedad Química y Minera de Chile S.A., Indian Farmers Fertiliser Cooperative Limited (IFFCO), Grupa Azoty S.A., and Nortox SA in 2025. Yara International integrates its proprietary N-Sensor platform with liquid UAN grades, offering a bundled subscription model that combines analytics and products. Sociedad Química y Minera de Chile S.A. utilizes Chilean nitrate brine to develop potassium nitrate foliar products specifically designed for berry and avocado orchards. Tessenderlo Kerley has expanded its regional presence through the acquisitions of Tiger-Sul Products and Eastman’s Metam labels, incorporating sulfur-enhanced liquids into a comprehensive nutritional product portfolio.
Strategic trends indicate a shift toward platform-based competition, where companies combine liquid fertilizer products with application services, agronomic support, and digital farm management tools to deliver differentiated value. Opportunities are emerging in on-farm blending systems that allow real-time nutrient customization, enabling farmers to tailor nutrient applications to specific crop needs and soil conditions, thereby optimizing yields and reducing waste. Additionally, the integration of advanced analytics and precision agriculture technologies within these platforms is further driving the adoption of such systems, as they provide actionable insights for better decision-making and resource management.
Emerging disruptors include technology firms developing electrochemical ammonia production systems, which have the potential to lower liquid nitrogen fertilizer production costs while enhancing environmental sustainability. For instancee, the FertigHy consortium is planning low-carbon nitrogen fertilizer plants in Europe. Competitive dynamics favor companies that integrate regulatory compliance capabilities with technical innovation, particularly as increased scrutiny of Per- and polyfluoroalkyl substances (PFAS) impacts chelating agent formulations and transportation regulations influence distribution economics.
Liquid Fertilizers Industry Leaders
Yara International ASA
Sociedad Química y Minera de Chile S.A.
Indian Farmers Fertiliser Cooperative Limited (IFFCO)
Grupa Azoty S.A.
Nortox SA
- *Disclaimer: Major Players sorted in no particular order

Recent Industry Developments
- May 2025: Liquiadubos has inaugurated its new liquid fertilizer plant in Ferreira do Alentejo, Portugal. The facility will produce NPK-based liquid fertilizers designed to support olive and almond crops. The company plans to invest significantly in environmental sustainability while reducing its reliance on imports. The plant will supply the Portuguese market with locally manufactured fertilizers.
- November 2024: Tessenderlo Kerley International inaugurated a liquid fertilizer plant at the Chemelot site in Geleen, Netherlands. The facility is designed to boost the production of liquid sulfur-based and ammonium-thiosulfate fertilizers (Thio-Sul), especially those adapted for precision agriculture and high-value crops.
- March 2024: EuroChem Group inaugurated a phosphate fertilizer complex in Serra do Salitre, Minas Gerais, Brazil. The facility, developed with an investment of nearly USD 1 billion, has an annual capacity of about one million metric tons of advanced phosphate-based fertilizers, including liquid formulations. This project enhances EuroChem’s capacity to meet the increasing demand for high-quality liquid and specialty fertilizers in South America.


Global Liquid Fertilizers Market Report Scope
Liquid fertilizer is a nutrient-rich, water-soluble, or liquid-concentrated plant food applied directly to soil or foliage for rapid absorption. It delivers essential nutrients such as nitrogen, phosphorus, potassium (NPK), and micronutrients, offering faster results, easier application through sprays or irrigation systems, and more precise dosing compared to granular fertilizers. The Liquid Fertilizers Market Report is Segmented by Type (Complex and Straight), by Application Mode (Fertigation and Foliar), by Crop Type (Field Crops, Horticultural Crops, and More), and by Geography (Asia-Pacific, Europe, North America, South America, Middle East, and Africa). The Market Forecasts are Provided in Terms of Value (USD) and Volume (Metric Tons).
Type
| Complex | ||
| Straight | By Nutrient | Micronutrients |
| Nitrogenous | ||
| Phosphatic | ||
| Potassic | ||
| Secondary Macronutrients | ||
Application Mode
| Fertigation |
| Foliar |
Crop Type
| Field Crops |
| Horticultural Crops |
| Turf and Ornamental |
Geography
| Asia-Pacific | Australia |
| Bangladesh | |
| China | |
| India | |
| Indonesia | |
| Japan | |
| Pakistan | |
| Philippines | |
| Thailand | |
| Vietnam | |
| Rest of Asia-Pacific | |
| Europe | France |
| Germany | |
| Italy | |
| Netherlands | |
| Russia | |
| Spain | |
| Ukraine | |
| United Kingdom | |
| Rest of Europe | |
| Middle East | Saudi Arabia |
| United Arab Emirates | |
| Turkey | |
| Rest of Middle East | |
| North America | Canada |
| Mexico | |
| United States | |
| Rest of North America | |
| South America | Brazil |
| Rest of South America | |
| Africa | South Africa |
| Nigeria | |
| Rest of Africa |
| Type | Complex | ||
| Straight | By Nutrient | Micronutrients | |
| Nitrogenous | |||
| Phosphatic | |||
| Potassic | |||
| Secondary Macronutrients | |||
| Application Mode | Fertigation | ||
| Foliar | |||
| Crop Type | Field Crops | ||
| Horticultural Crops | |||
| Turf and Ornamental | |||
| Geography | Asia-Pacific | Australia | |
| Bangladesh | |||
| China | |||
| India | |||
| Indonesia | |||
| Japan | |||
| Pakistan | |||
| Philippines | |||
| Thailand | |||
| Vietnam | |||
| Rest of Asia-Pacific | |||
| Europe | France | ||
| Germany | |||
| Italy | |||
| Netherlands | |||
| Russia | |||
| Spain | |||
| Ukraine | |||
| United Kingdom | |||
| Rest of Europe | |||
| Middle East | Saudi Arabia | ||
| United Arab Emirates | |||
| Turkey | |||
| Rest of Middle East | |||
| North America | Canada | ||
| Mexico | |||
| United States | |||
| Rest of North America | |||
| South America | Brazil | ||
| Rest of South America | |||
| Africa | South Africa | ||
| Nigeria | |||
| Rest of Africa | |||


Market Definition
- MARKET ESTIMATION LEVEL - Market Estimations for various types of fertilizers has been done at the product-level and not at the nutrient-level.
- NUTRIENT TYPES COVERED - Primary Nutrients: N, P and K, Secondary Macronutrients: Ca, Mg and S, Micronutients: Zn, Mn, Cu, Fe, Mo, B, and Others
- AVERAGE NUTRIENT APPLICATION RATE - This refers to the average volume of nutrient consumed per hectare of farmland in each country.
- CROP TYPES COVERED - Field Crops: Cereals, Pulses, Oilseeds, and Fiber Crops Horticulture: Fruits, Vegetables, Plantation Crops and Spices, Turf Grass and Ornamentals
| Keyword | Definition |
|---|---|
| Fertilizer | Chemical substance applied to crops to ensure nutritional requirements, available in various forms such as granules, powders, liquid, water soluble, etc. |
| Specialty Fertilizer | Used for enhanced efficiency and nutrient availability applied through soil, foliar, and fertigation. Includes CRF, SRF, liquid fertilizer, and water soluble fertilizers. |
| Controlled-Release Fertilizers (CRF) | Coated with materials such as polymer, polymer-sulfur, and other materials such as resins to ensure nutrient availability to the crop for its entire life cycle. |
| Slow-Release Fertilizers (SRF) | Coated with materials such as sulfur, neem, etc., to ensure nutrient availability to the crop for a longer period. |
| Foliar Fertilizers | Consist of both liquid and water soluble fertilizers applied through foliar application. |
| Water-Soluble Fertilizers | Available in various forms including liquid, powder, etc., used in foliar and fertigation mode of fertilizer application. |
| Fertigation | Fertilizers applied through different irrigation systems such as drip irrigation, micro irrigation, sprinkler irrigation, etc. |
| Anhydrous Ammonia | Used as fertilizer, directly injected into the soil, available in gaseous liquid form. |
| Single Super Phosphate (SSP) | Phosphorus fertilizer containing only phosphorus which has lesser than or equal to 35%. |
| Triple Super Phosphate (TSP) | Phosphorus fertilizer containing only phosphorus greater than 35%. |
| Enhanced Efficiency Fertilizers | Fertilizers coated or treated with additional layers of various ingredients to make it more efficient compared to other fertilizers. |
| Conventional Fertilizer | Fertilizers applied to crops through traditional methods including broadcasting, row placement, ploughing soil placement, etc. |
| Chelated Micronutrients | Micronutrient fertilizers coated with chelating agents such as EDTA, EDDHA, DTPA, HEDTA, etc. |
| Liquid Fertilizers | Available in liquid form, majorly used for application of fertilizers to crops through foliar and fertigation. |


Research Methodology
Mordor Intelligence follows a four-step methodology in all our reports.
- Step-1: IDENTIFY KEY VARIABLES: In order to build a robust forecasting methodology, the variables and factors identified in Step-1 are tested against available historical market numbers. Through an iterative process, the variables required for market forecast are set and the model is built on the basis of these variables.
- Step-2: Build a Market Model: Market-size estimations for the forecast years are in nominal terms. Inflation is not a part of the pricing, and the average selling price (ASP) is kept constant throughout the forecast period for each country.
- Step-3: Validate and Finalize: In this important step, all market numbers, variables and analyst calls are validated through an extensive network of primary research experts from the market studied. The respondents are selected across levels and functions to generate a holistic picture of the market studied.
- Step-4: Research Outputs: Syndicated Reports, Custom Consulting Assignments, Databases & Subscription Platforms


