Catalyst Fertilizers Market Size and Share
Market Overview
| Study Period | 2021 - 2031 |
|---|---|
| Market Size (2026) | USD 3.30 Billion |
| Market Size (2031) | USD 3.87 Billion |
| Growth Rate (2026 - 2031) | 3.26% CAGR |
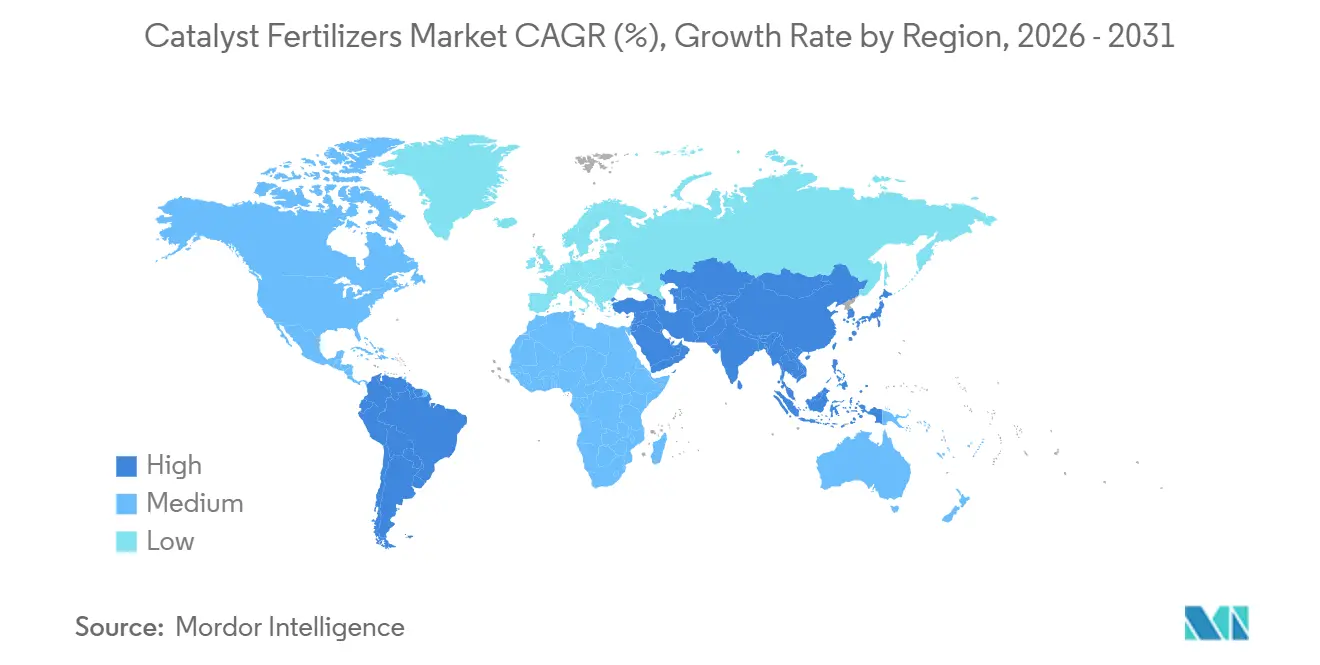
| Fastest Growing Market | Middle East |
| Largest Market | Asia Pacific |
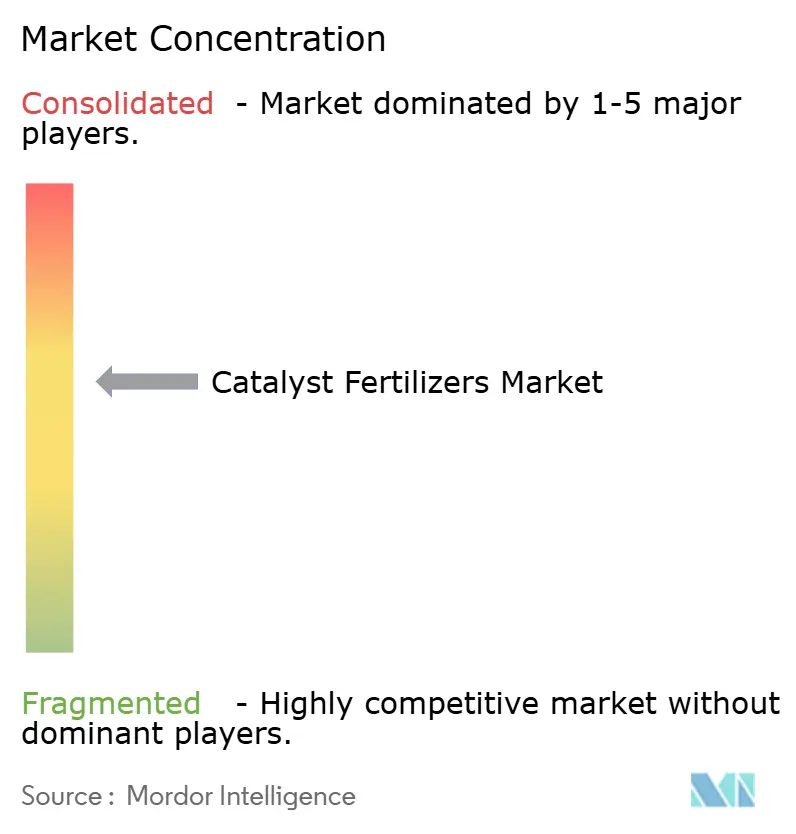
| Market Concentration | Medium |
Major Players *Disclaimer: Major Players sorted in no particular order Image © Mordor Intelligence. Reuse requires attribution under CC BY 4.0. | |
Catalyst Fertilizers Market Analysis by Mordor Intelligence
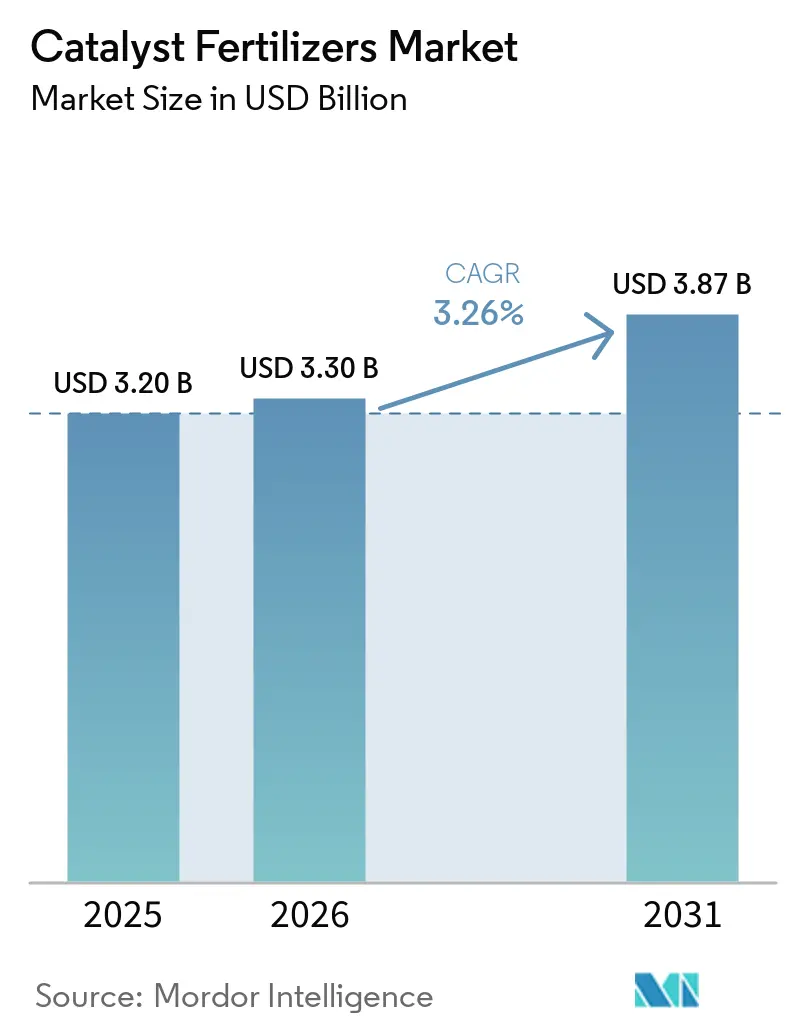
The catalyst fertilizers market size is projected to be USD 3.2 billion in 2025, USD 3.3 billion in 2026, and reach USD 3.87 billion by 2031, growing at a CAGR of 3.26% from 2026 to 2031. Energy-efficiency mandates, sharply lower nitrous oxide limits, and the capital requirements of green ammonia projects are changing how producers select catalyst technologies. Iron-oxide Haber-Bosch catalysts now cut energy use by as much as 30% versus earlier iron formulations, while platinum–rhodium gauze recycling and leasing programs are easing adoption costs for nitric-acid facilities. Specialty potassic systems using nano-structured copper are emerging for low-pressure synthesis lines, and their uptake is strongest in the Asia-Pacific and the Middle East. Capital spending on dynamic catalysts that can ramp with renewable hydrogen is accelerating as Saudi Arabia, India, and Australia commission large green-ammonia complexes. Simultaneously, secondary and tertiary nitrous oxide decomposition catalysts are replacing older emission controls to secure carbon credits under the European Union Emissions Trading System and similar programs.
Key Report Takeaways
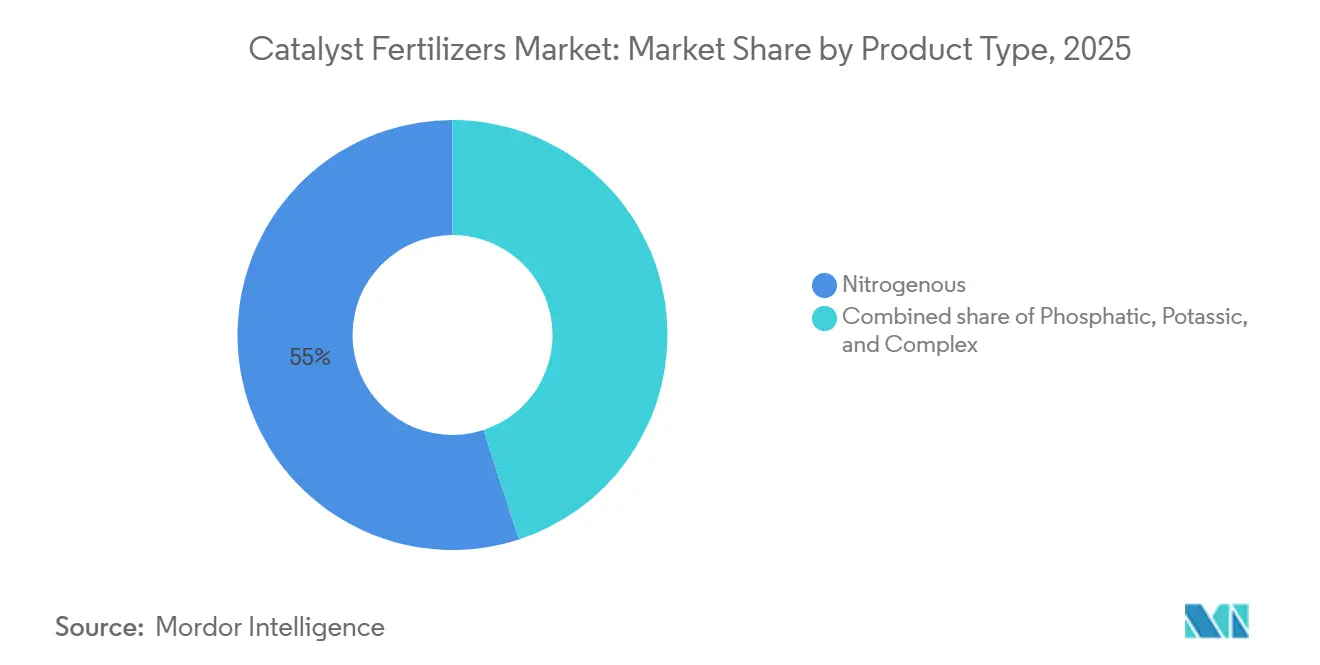
- By product type, nitrogenous catalysts accounted for the largest market share, leading with 55% of the catalyst fertilizers market in 2025, while potassic catalysts are anticipated to be the fastest growing segment, forecast to grow at a 13.9% CAGR through 2026-2031.
- By catalyst metal group, base-metal formulations hold the largest share, accounting for 55% of the catalyst fertilizers market size in 2025, and copper-based variants are projected to expand at the fastest CAGR of 12.4% from 2026-2031.
- By production process, Haber-Bosch ammonia synthesis holds the largest share, accounting for 60% of the catalyst fertilizers market size in 2025, whereas emission-control catalysts are advancing at the fastest CAGR of 11% through 2026-2031.
- By application stage, primary-synthesis catalysts held the largest 75.0% market share in 2025, whereas emission-control / De-NOx Catalysts are the fastest-growing segment, with a 9.5% CAGR projected through 2026-2031.
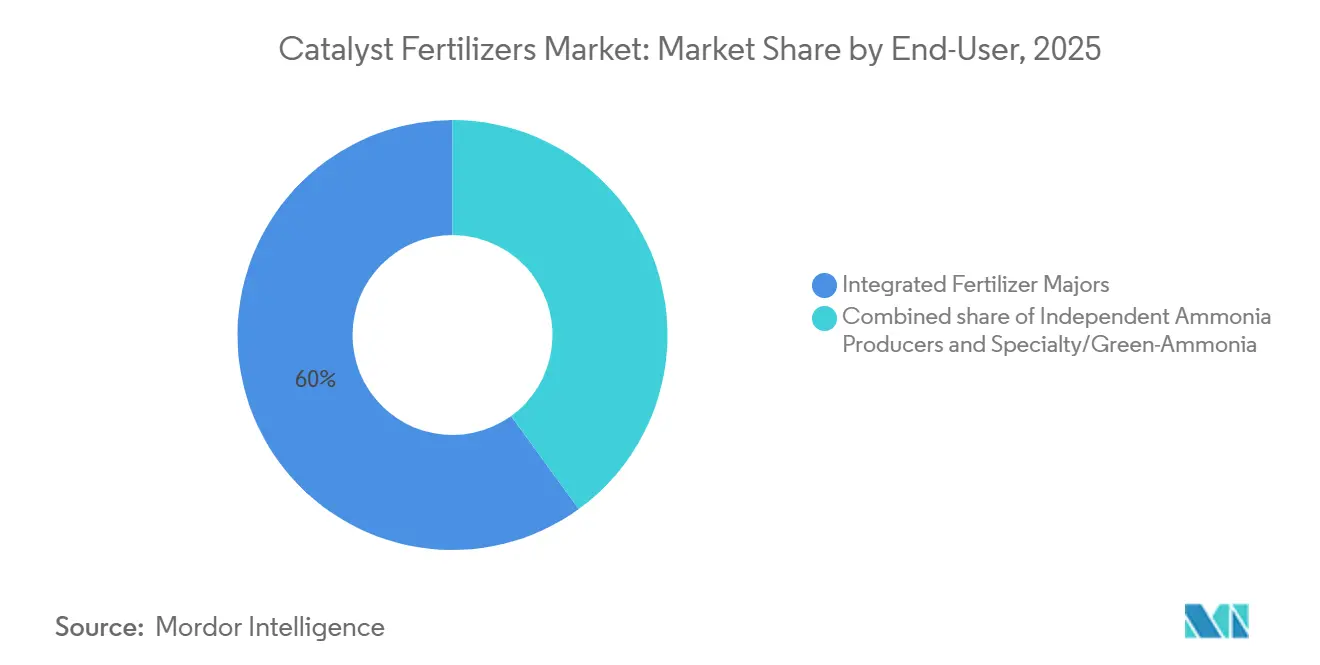
- By end-user, integrated majors commanded the largest 60% market share of catalyst demand in 2025. specialty ammonia developers are the fastest-growing group, with a 12% CAGR through 2026-2031.
- By geography, Asia-Pacific accounted for the largest share of 46% of the catalyst fertilizer market size demand in 2025, whereas the Middle East is the fastest-growing region, with a 14.2% CAGR from 2026-2031.
Note: Market size and forecast figures in this report are generated using Mordor Intelligence’s proprietary estimation framework, updated with the latest available data and insights as of January 2026.
Global Catalyst Fertilizers Market Trends and Insights
Drivers Impact Analysis*
| Driver | (~) % Impact on CAGR Forecast | Geographic Relevance | Impact Timeline |
|---|---|---|---|
| Iron-oxide Haber-Bosch catalysts cut energy use | +1.2% | Asia-Pacific and Europe | Medium term (2–4 years) |
| Stringent Nitrous oxide caps for nitric-acid plants | +0.9% | North America and Europe | Short term (≤ 2 years) |
| Green-ammonia build-outs in Asia-Pacific | +0.8% | Asia-Pacific and the Middle East | Long term (≥ 4 years) |
| Precious-metal catalyst leasing and recycling | +0.5% | North America and Europe | Medium term (2–4 years) |
| Nano-structured copper catalysts for low-pressure processes | +0.4% | Asia-Pacific and the Middle East | Long term (≥ 4 years) |
| Carbon-credit-linked catalyst replacement cycles | +0.3% | North America and Europe | Medium term (2–4 years |
| Source: Mordor Intelligence | |||
Iron-oxide Haber-Bosch Catalysts Cut Energy Use
Wustite-based iron catalysts lower ammonia-synthesis energy consumption by roughly 30%, trimming 1.5 to 2 gigajoules per metric ton of ammonia produced. The gain directly reduces natural gas costs and Scope 1 carbon emissions, which are critical because ammonia synthesis consumes around 2% of the global energy supply[1]Source: United States Environmental Protection Agency, “Nitrogen Oxides Emission Standards for Nitric Acid Plants,” epa.gov. Since its launch in 2020–2021, the AmoMax-Casale catalyst has achieved 30% higher efficiency than traditional wustite catalysts. This allows brownfield plants to increase ammonia yields or reduce loop pressures, delaying major capital upgrades by optimizing existing reactor systems. Adoption is fastest in China and India, where plant fleets are more than 25 years old, and governments are tightening carbon-intensity targets. Europe is following as volatile gas prices during 2022–2024 made energy savings a strategic imperative.
Stringent Nitrous oxide Caps for Nitric-Acid Plants
Recent Environmental Protection Agency (EPA) updates require nitric acid facilities to use Continuous Emission Monitoring Systems (CEMS) for tracking 30-day average emission rates. The guidance also recommends dual-span monitors for accurate measurements during startup and shutdown[2]Source: International Energy Agency, “Ammonia Technology Roadmap,” iea.org. Because nitrous oxide has a 273-times higher global-warming potential than carbon dioxide, new regulations are forcing rapid replacement of legacy Pt-Rh gauze and secondary abatement units. KATALCO tertiary decomposition systems from Johnson Matthey destroy up to 99% of Nitrous oxide, letting plants earn voluntary-market carbon credits that partially offset catalyst costs. Similar caps in Europe under the Industrial Emissions Directive sync replacement cycles across advanced economies. Short compliance deadlines between 2026 and 2028 keep the driver’s effect front-loaded.
Green-Ammonia Build-Outs in Asia-Pacific
Saudi Arabia’s USD 8.4 billion NEOM plant, a joint venture between NEOM, Air Products, and ACWA Power, aims to produce 1.2 million metric tons of green ammonia per year. Currently over 90% complete, the facility is anticipated to reach commercial production in 2027. Air Products serves as the exclusive offtaker for the full output, which utilizes Topsoe's high-efficiency ammonia synthesis technology to support global decarbonization. India’s National Green Hydrogen Mission and Australia’s Pilbara projects add further demand for catalysts that tolerate 20–100% load swings without deactivation[3]Source: Government of India Ministry of New and Renewable Energy, “National Green Hydrogen Mission,” mnre.gov.in. Developers value formulations that maintain activity at temperatures below 350 °C, matching electrolyzer-driven hydrogen supply. Because construction and commissioning timelines exceed four years, the sales impact builds gradually but remains durable. Early commitments already lift long-term order books for Topsoe and BASF SE.
Precious-Metal Catalyst Leasing and Recycling
High prices for Platinum and Rhodium make fresh ammonia oxidation gauzes a heavy upfront capital expense. Financial arrangements, such as precious metal leasing from refiners like Heraeus Precious Metals, shift ownership and price risk away from the plant operator. These refiners maintain a circular loop, using advanced catchment systems and refining processes to recover nearly all precious metals from spent gauzes for immediate reuse in new production campaigns. Circular flows buffer supply constraints, notably for iridium, whose global mine output was only 7 metric tons in 2024. The model gains traction when plants replace gauze every 12–18 months, providing a strong mid-term benefit.
Restraints Impact Analysis*
| Restraint | (~) % Impact on CAGR Forecast | Geographic Relevance | Impact Timeline |
|---|---|---|---|
| Vanadium pentoxide price volatility | –0.7% | Asia-Pacific and Europe | Short term (≤ 2 years) |
| Limited awareness among African mid-size urea plants | –0.4% | Sub-Saharan Africa | Medium term (2–4 years) |
| Phytotoxicity fears over trace-metal leaching | –0.3% | Europe and North America | Long term (≥ 4 years) |
| Ambiguity in nano‑porous carrier classification | –0.2% | Europe and North America | Long term (≥ 4 years) |
| Source: Mordor Intelligence | |||
Vanadium Pentoxide Price Volatility
Vanadium pentoxide, the active phase in sulfuric-acid contact catalysts, has traded between USD 5 and USD 9 per pound since 2022, mirroring shifts in ferro-vanadium demand and Chinese export adjustments. To cope, producers stretch catalyst life through regeneration, which restores only 60–70% activity and introduces process-control variability. While long-term offtake contracts exist, many buyers in the Asia-Pacific region prefer spot deals and thus are exposed to short-cycle volatility. The resulting uncertainty delays new installations in phosphate fertilizer complexes, especially in India and China.
Limited Awareness Among African Mid-Size Urea Plants
Roughly 70% of sub-Saharan ammonia and urea facilities were built before 1995 and still run first-generation catalysts. Management teams often lack dedicated process-optimization staff and defer upgrades that require capital outlays, even when the payback period is under 2 years. The African Development Bank and other lenders offer technical-assistance grants, yet uptake remains below 20% of the eligible plant base. Missed efficiency gains translate into 10–15% higher gas use and 2–3 metric tons of Carbon Dioxide Equivalent in extra emissions per metric ton of ammonia. Until awareness and financing frameworks broaden, catalyst sales into the region will lag global averages.
*Our forecasts treat driver/restraint impacts as directional, not additive. The impact forecasts reflect baseline growth, mix effects, and variable interactions.
Segment Analysis
By Product Type: Nitrogenous Base, Potassic Upside
Nitrogenous catalysts retained the largest market share at 55% in 2025, reflecting their role as anchors in ammonia and nitric acid production. Potassic systems are the fastest-expanding category, advancing at a fastest 13.9% CAGR through 2026-2031, driven by specialty-fertilizer demand and nano-copper-enabled low-pressure routes. Together, these two segments accounted for roughly three-quarters of the catalyst fertilizers market size in 2025. Producers prioritize nitrogenous upgrades for immediate energy savings, while potassic innovations attract investors looking for premium horticulture margins.
Phosphatic catalysts, tied to sulfuric-acid plants, face cost swings from volatile vanadium prices yet still post steady mid-single-digit growth in Morocco and Saudi Arabia. Complex-fertilizer catalyst packages bundle ammonia, nitric acid, and sulfuric acid stages, appealing to integrated plants seeking one-stop procurement. Uptake of complex catalysts improves operating synergy and trims total cost of ownership by as much as 18%. Suppliers use these bundled offerings to deepen customer relationships and offset pricing pressure in mature nitrogenous lines.


By Catalyst Metal Group: Iron Strength, Copper Momentum
Base-metal formulations, dominated by iron oxides, captured the largest 55% of the market share in 2025, owing to cost advantages and entrenched Haber-Bosch demand. Copper-based alternatives are the fastest-growing, projected to grow at a fastest 12.4% CAGR from 2026-2031, as low-pressure ammonia synthesis gains traction in green projects. The two categories combined account for over 80% of current sales, underscoring their strategic importance in technology roadmaps. Producers balance iron’s affordability with copper’s superior low-temperature activity to meet evolving efficiency targets.
Precious-metal Pt-Rh gauze holds a stable high-value niche for nitric-acid plants that monetize carbon credits. Vanadium systems support sulfuric-acid production but face margin pressure from raw-material volatility and environmental scrutiny. Nickel and zinc catalysts play specialized roles in urea conditioning and emission reduction, accounting for a modest share of revenue. Suppliers with broad metal portfolios hedge commodity risk and offer recycling programs that curb customer exposure to price swings
By Production Process: Haber-Bosch Scale, Emission-Control Upswing
Haber-Bosch ammonia synthesis maintained its largest market share of 60% of catalyst demand in 2025, leveraging its century-long dominance and 180 million metric tons of output. Emission-control lines centered on secondary and tertiary nitrous oxide decomposition are the fastest-growing, with a 11% CAGR from 2026-2031, driven by tightening global limits on nitrous oxide release. These two processes define current investment priorities, pairing core production stability with new environmental mandates. Plant operators allocate capital first to secure baseline ammonia output, then to unlock carbon-credit revenue via advanced abatement catalysts.
Nitric-acid oxidation consumes less catalyst volume yet commands a premium due to platinum and rhodium loadings. Urea plants continue to absorb zinc- and chromium-based formulations that cut biuret formation and improve product quality. Sulfuric-acid contact units rely on vanadium pentoxide systems that now integrate pore-structure refinements to extend life. Emission-control retrofits often coincide with scheduled shutdowns of urea or sulfuric-acid lines, allowing multiprocess catalyst overhauls in a single maintenance window.
By Application Stage: Primary Synthesis Core, De-NOx Growth
Primary-synthesis catalysts covering ammonia, urea, and sulfuric-acid lines held the largest 75% market share in 2025 due to predictable five- to seven-year replacement cycles. Removal or reduction of nitrogen oxides and tertiary nitrous oxide systems are the fastest-growing segment, with a 9.5% CAGR through 2026-2031, as plants strive for sub-0.5 kilogram-per-metric-ton nitrous oxide compliance. The clear split between core production and emission control shapes supplier strategy and customer budgeting. Operators view primary catalysts as reliability enablers and the removal or reduction of nitrogen oxides units as regulatory necessities that also unlock carbon credits.
Catalysts for selective catalytic reduction merge ammonia slip control with nitrous oxide destruction, trimming hardware count, and capital costs. Dual-function designs from BASF SE shorten retrofit timelines while raising margins for vendors. Ancillary sorbent beds and guard catalysts preserve activity by capturing poisons, further extending runtime. Service contracts that bundle both primary and emission-control products help suppliers secure multi-cycle commitments.
By End-User: Integrated Majors Dominate, Green Developers Accelerate
Integrated majors such as Yara International and CF Industries commanded the largest 60% market share of catalyst demand in 2025, leveraging multi-year contracts and global purchasing scale. Green-ammonia developers are the fastest-growing group, with a 12% CAGR through 2026-2031, and are seeking load-following catalysts to address renewable-power variability. The two user classes together dictate innovation agendas, pairing base-load efficiency with dynamic-operation resilience. Vendors tailor offerings to satisfy majors’ cost targets while hitting green developers’ flexibility metrics.
Independent exporters in the Middle East and China favor low-cost Chinese iron-oxide catalysts to protect margins on commoditized urea. Mid-size African plants upgrade slowly because of financing gaps and limited technical staff, leaving an untapped efficiency pool. Specialty producers targeting controlled-release fertilizers drive demand for advanced copper and nano-porous systems that support premium crop segments. Suppliers nurture these smaller accounts with modular packages and training programs that lower adoption barriers.
Geography Analysis
Asia-Pacific held the largest market share at 46% in 2025, supported by China’s sizable ammonia base and India’s new urea capacities. The Middle East is the fastest-growing region, advancing at a 14.2% CAGR through 2026-2031, as mega-projects such as the NEOM green-ammonia complex move from construction to start-up. Producers in both regions favor high-activity iron-oxide catalysts that lower energy bills and qualify for carbon credits. Their procurement pipelines already include dynamic formulations designed for renewable-hydrogen inputs, signaling sustained demand through 2031.
North America and Europe focus on catalyst replacements that meet stricter nitrous-oxide and energy-efficiency rules, a trend that stabilizes sales despite limited new capacity. South America benefits from acreage expansion in Brazil and improving logistics for fertilizer distribution, while Africa adds units mainly in Morocco, Nigeria and Egypt as financing becomes available. Russia remains supply-constrained, relying more on Chinese vendors after recent trade disruptions. These five regions together diversify the customer base and buffer suppliers against localized downturns.
Looking ahead, Asia-Pacific will continue to expand lead volumes through brownfield retrofits and government incentives that promote self-sufficiency. The Middle East plans additional green-ammonia hubs that integrate low-cost solar power, ensuring a long runway for load-following catalysts. North America and Europe are upgrading nitric-acid lines for deeper nitrous oxide cuts, creating recurring orders for emission-control formulations. Emerging economies in South America and Africa are scaling specialty-crop output, which should lift demand for next-generation potassic and copper-based systems across the forecast window.

Competitive Landscape
Clariant AG, Johnson Matthey Plc, Haldor Topsoe A/S, BASF SE, and Honeywell International Inc. (same) accounted for the majority share in 2025, indicating a moderately concentrated catalyst fertilizers market. Clariant AG led, leveraging its AmoMax iron-oxide platform and licensing ties with Casale, although BASF SE’s December 2025 integration of Clariant AG’s catalysts business introduces transitional uncertainty. Johnson Matthey Plc, with its moderate share, relies on Pt-Rh gauze and closed-loop recycling, which reduces customer cash exposure to precious metals. Haldor Topsoe A/S holds a significant share, advancing dynamic catalysts that handle rapid load swings demanded by renewable-hydrogen projects. Honeywell International Inc. rounds out the top tier through UOP DeNOx systems and digital performance dashboards that heighten switching costs.
Haldor Topsoe A/S, BASF SE, and Honeywell International Inc. form the balance of the leading pack and position themselves through differentiated technology niches rather than price. Topsoe’s dynamic catalysts maintain 85% activity after 500 rapid load swings, giving it an edge in the fast-growing green ammonia pipeline. BASF SE solidified its footing by integrating Clariant AG’s former catalyst unit and investing EUR 120 million (USD 127 million) in a new iron-oxide plant that doubles regional output capacity. Honeywell International Inc. rounds out the group with digitalized DeNOx systems that upload real-time performance data to cloud dashboards, raising switching costs for nitric-acid operators.
Looking ahead, each major supplier is expanding through capacity buildouts, joint development deals, and service bundles that lock in multi-cycle revenue. Haldor Topsoe A/S and Yara International ASA’s Australian partnership exemplifies how dynamic catalysts will mainstream as renewable hydrogen scales. BASF SE and Johnson Matthey Plc are both expanding recycling loops in the 2024-2026 period, which secure precious-metal feedstock and align with customers’ sustainability metrics. Clariant AG and Honeywell International Inc. are layering predictive-maintenance software onto hardware sales, a move anticipated to deepen client ties and expand the overall addressable market for catalyst fertilizers over the next five years.
Catalyst Fertilizers Industry Leaders
Haldor Topsoe A/S
Johnson Matthey Plc
BASF SE
Clariant AG
Honeywell International Inc.
- *Disclaimer: Major Players sorted in no particular order

Recent Industry Developments
- January 2026: The NEOM green-ammonia project has reached final construction and pre-commissioning, with Topsoe providing dynamic ammonia-synthesis technology. Scheduled for start-up in 2027, the project is anticipated to drive demand for advanced ammonia-synthesis catalysts, supporting growth in the catalyst fertilizers market through green-ammonia adoption.
- September 2025: CF Industries has completed catalyst and process efficiency upgrades at its Donaldsonville ammonia complex, resulting in double-digit reductions in energy intensity and facilitating incremental carbon credit generation. High-activity wustite-based ammonia-synthesis catalysts, such as Clariant’s, are being increasingly adopted by large North American ammonia plants to achieve comparable efficiency improvements.
- July 2024: Clariant Catalysts (Clariant AG) and KBR have expanded their collaboration to advance low-carbon, green ammonia production by combining KBR’s K-GreeN technology with Clariant’s AmoMax catalysts. Their solution has been adopted for over 10 green-ammonia fertilizer projects globally, improving energy efficiency and reducing emissions in large-scale plants.
- November 2024: Clariant AG installed its EnviCat Nitrous Oxide-S catalyst at Hengli Petrochemical’s 300,000-ton-per-annum nitric acid plant, achieving 95% nitrous oxide abatement and cutting greenhouse gas emissions by nearly 690,000 metric tons of Carbon Dioxide Equivalent annually. Nitric acid is a key input for nitrogen fertilizers, driving rapid growth in the Nitrous Oxide-control catalysts segment of the catalyst fertilizers market.


Global Catalyst Fertilizers Market Report Scope
The Catalyst Fertilizers Market encompasses the global industry focused on the production and distribution of specialized chemical substances, primarily metal-based, that enhance and expedite chemical reactions in fertilizer manufacturing. The Catalyst Fertilizers Market Report is Segmented by Product Type (Nitrogenous, Phosphatic, Potassic, Complex), Catalyst Metal Group (Base-metal, Precious-metal), Production Process (Haber-Bosch Ammonia Synthesis, Urea Plant Catalysts, Nitric Acid, Sulfuric Acid), Application Stage (Primary Synthesis Catalysts, Emission-control and De-nox Catalysts), End-user (Integrated Fertilizer Majors, Independent Ammonia Producers, Specialty and Green-Ammonia Developers), and Geography (North America, South America, Europe, Asia-Pacific, Middle East, Africa). The Market Forecasts are Provided in Terms of Value (USD).
| Nitrogenous |
| Phosphatic |
| Potassic |
| Complex |
| Base-metal (Iron, Nickel, Vanadium, Zinc) |
| Precious-metal (Platinum, Rhodium, Ruthenium) |
| Haber Bosch Ammonia Synthesis |
| Urea Plant Catalysts |
| Nitric Acid |
| Sulfuric Acid |
| Primary Synthesis Catalysts |
| Emission-control / De-NOx Catalysts |
| Integrated Fertilizer Majors |
| Independent Ammonia Producers |
| Specialty Ammonia Developers |
| North America | United States |
| Canada | |
| Mexico | |
| Rest of North America | |
| South America | Brazil |
| Argentina | |
| Rest of South America | |
| Europe | Germany |
| France | |
| Spain | |
| Russia | |
| Rest of Europe | |
| Asia-Pacific | China |
| India | |
| Japan | |
| Rest of Asia-Pacific | |
| Middle East | Saudi Arabia |
| Turkey | |
| Rest of Middle East | |
| Africa | South Africa |
| Egypt | |
| Rest of Africa |
| By Product Type | Nitrogenous | |
| Phosphatic | ||
| Potassic | ||
| Complex | ||
| By Catalyst Metal Group | Base-metal (Iron, Nickel, Vanadium, Zinc) | |
| Precious-metal (Platinum, Rhodium, Ruthenium) | ||
| By Production Process | Haber Bosch Ammonia Synthesis | |
| Urea Plant Catalysts | ||
| Nitric Acid | ||
| Sulfuric Acid | ||
| By Application Stage | Primary Synthesis Catalysts | |
| Emission-control / De-NOx Catalysts | ||
| By End-user | Integrated Fertilizer Majors | |
| Independent Ammonia Producers | ||
| Specialty Ammonia Developers | ||
| By Geography | North America | United States |
| Canada | ||
| Mexico | ||
| Rest of North America | ||
| South America | Brazil | |
| Argentina | ||
| Rest of South America | ||
| Europe | Germany | |
| France | ||
| Spain | ||
| Russia | ||
| Rest of Europe | ||
| Asia-Pacific | China | |
| India | ||
| Japan | ||
| Rest of Asia-Pacific | ||
| Middle East | Saudi Arabia | |
| Turkey | ||
| Rest of Middle East | ||
| Africa | South Africa | |
| Egypt | ||
| Rest of Africa | ||


Key Questions Answered in the Report
What is the current size of the catalyst fertilizers market?
The catalyst fertilizers market size stands at USD 3.3 billion in 2026 and is anticipated to reach USD 3.87 billion by 2031, reflecting a 3.26% CAGR over 2026–2031.
Which segment leads demand for catalyst fertilizers?
Nitrogenous catalysts accounted for largest share with 55% of catalyst fertilizer market in 2025 revenue due to the scale of ammonia and nitric acid production.
Which region is growing the fastest?
The Middle East accounted for the fastest growth rate at 14.2% CAGR from 2026 to 2031, driven by green ammonia investments such as the NEOM project.
How do new catalysts help meet emission rules?
High-efficiency Pt-Rh gauze and tertiary Nitrous Oxide catalysts reduce nitrous oxide emissions by up to 99%, enabling plants to qualify for carbon credits and comply with tighter limits.
What role do dynamic catalysts play in green ammonia?
Dynamic iron-oxide and copper systems maintain activity under rapid load swings, letting electrolyzer-based plants run efficiently on variable solar and wind power.
Page last updated on:


