Market Overview
| Study Period | 2021 - 2031 |
|---|---|
| Market Size (2026) | USD 26.89 Billion |
| Market Size (2031) | USD 36.5 Billion |
| Growth Rate (2026 - 2031) | 6.30% CAGR |
| Fastest Growing Market | Middle East |
| Largest Market | Asia-Pacific |
| Market Concentration | Low |
Major Players *Disclaimer: Major Players sorted in no particular order Image © Mordor Intelligence. Reuse requires attribution under CC BY 4.0. | |
Specialty Fertilizer Market Analysis by Mordor Intelligence
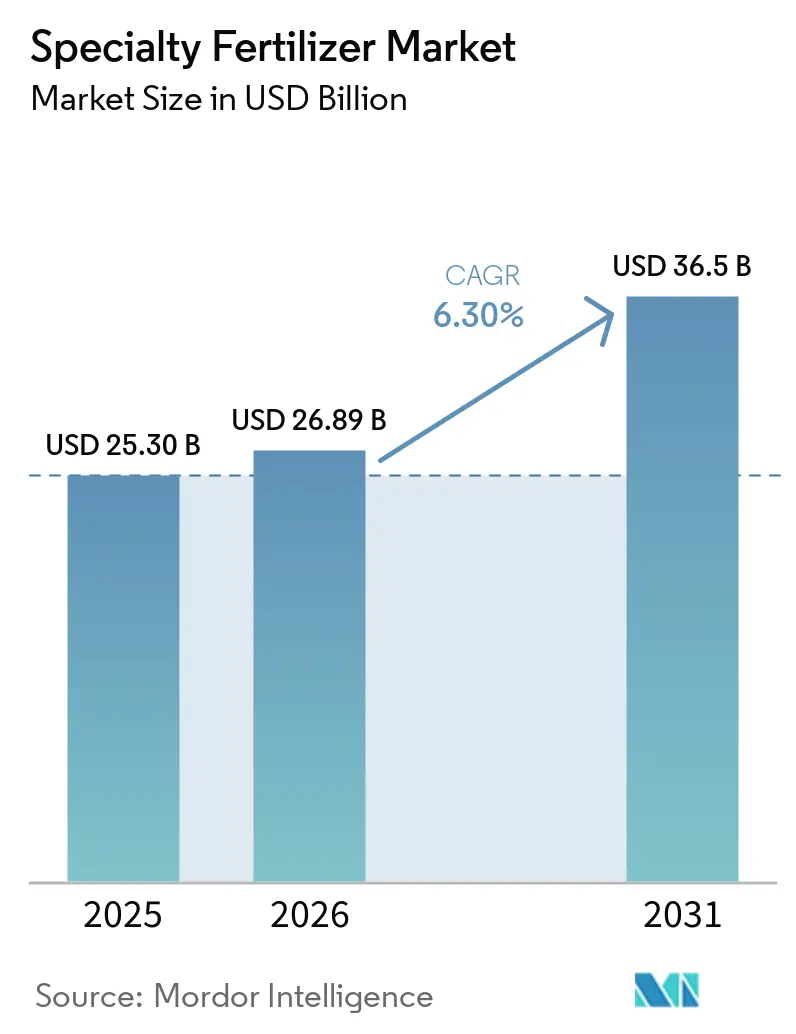
The specialty fertilizer market size was valued at USD 25.30 billion in 2025 and estimated to grow from USD 26.89 billion in 2026 to reach USD 36.50 billion by 2031, at a CAGR of 6.30% during the forecast period (2026-2031). A measured but durable expansion is unfolding as growers shift spending toward precision nutrition products that raise water-use efficiency and unlock carbon-credit revenue. Liquid offerings dominate current demand because fertigation systems reduce labor requirements and integrate seamlessly with variable-rate controllers. Polymer-coated controlled-release grades are gaining momentum in turf, greenhouse, and high-value horticulture because a single application covers the entire growth cycle and reduces application losses. Digital agronomy platforms that prescribe field-specific micronutrient blends are also widening the adoption funnel for specialty solutions, while green-ammonia investments position low-carbon nitrogen to win future procurement mandates. Input-cost volatility and tightening heavy-metal limits remain prominent obstacles, yet product innovation and data-driven advisory services continue to reinforce the specialty fertilizer market growth trajectory.
Key Report Takeaways
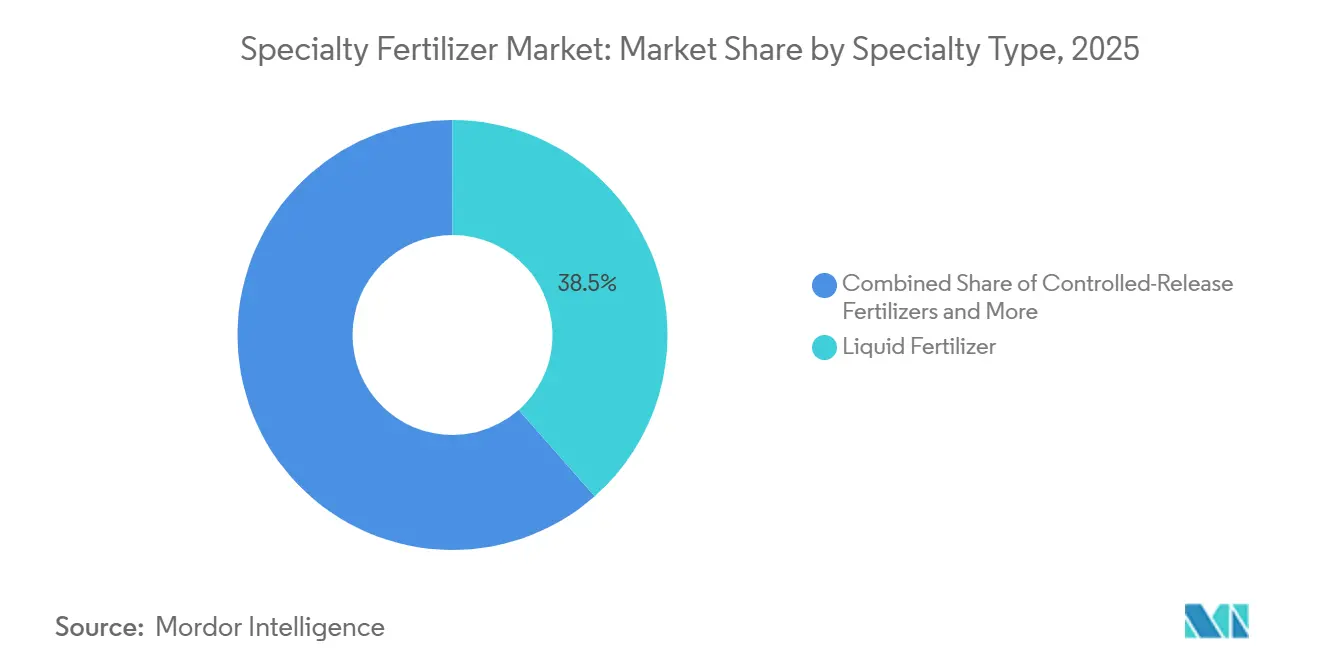
- By specialty type, liquid fertilizers accounted for the largest specialty fertilizer market share of 38.5% in 2025, while controlled-release fertilizers are projected to be the fastest-growing segment, registering a CAGR of 8.8% during 2026–2031.
- By application mode, fertigation represented the largest application segment, contributing 48.1% of the specialty fertilizer market size in 2025, and is projected to remain the fastest-growing application mode, with a CAGR of 7.3% through 2031.
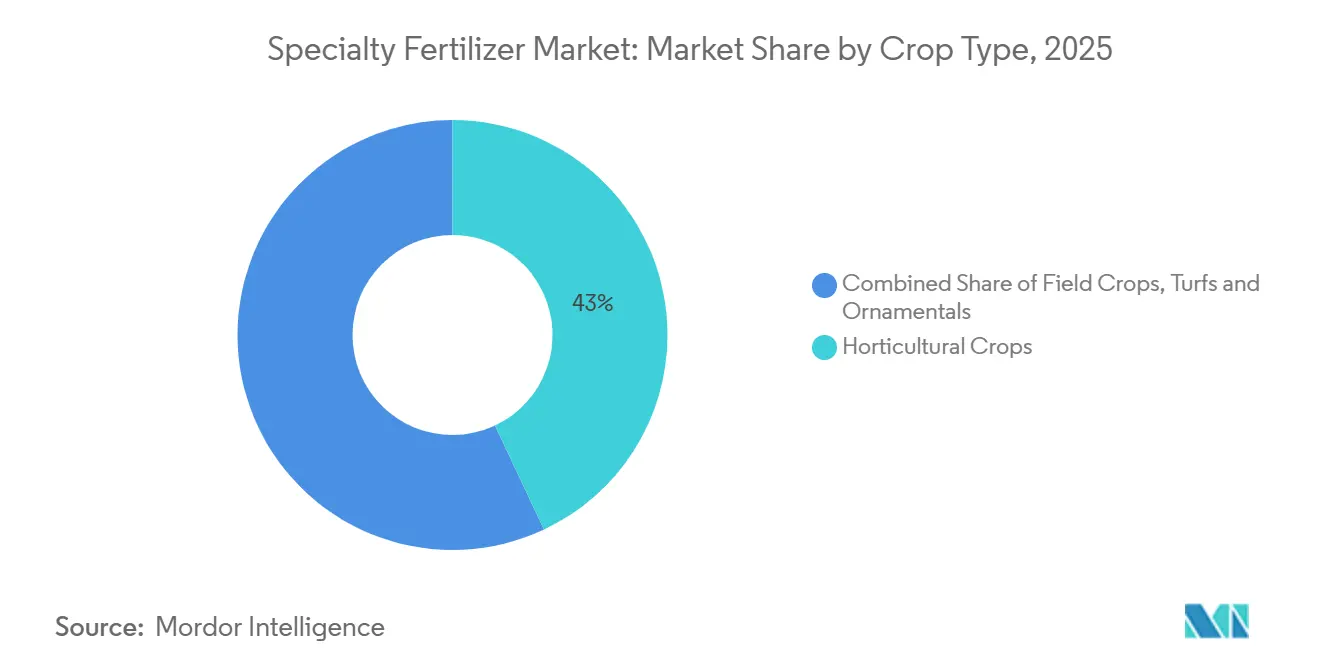
- By crop type, horticultural crops accounted for 43.0% of global demand in 2025 as the largest crop segment, whereas turf and ornamental crops are forecast to be the fastest-growing, expanding at a CAGR of 7.9% during 2026–2031.
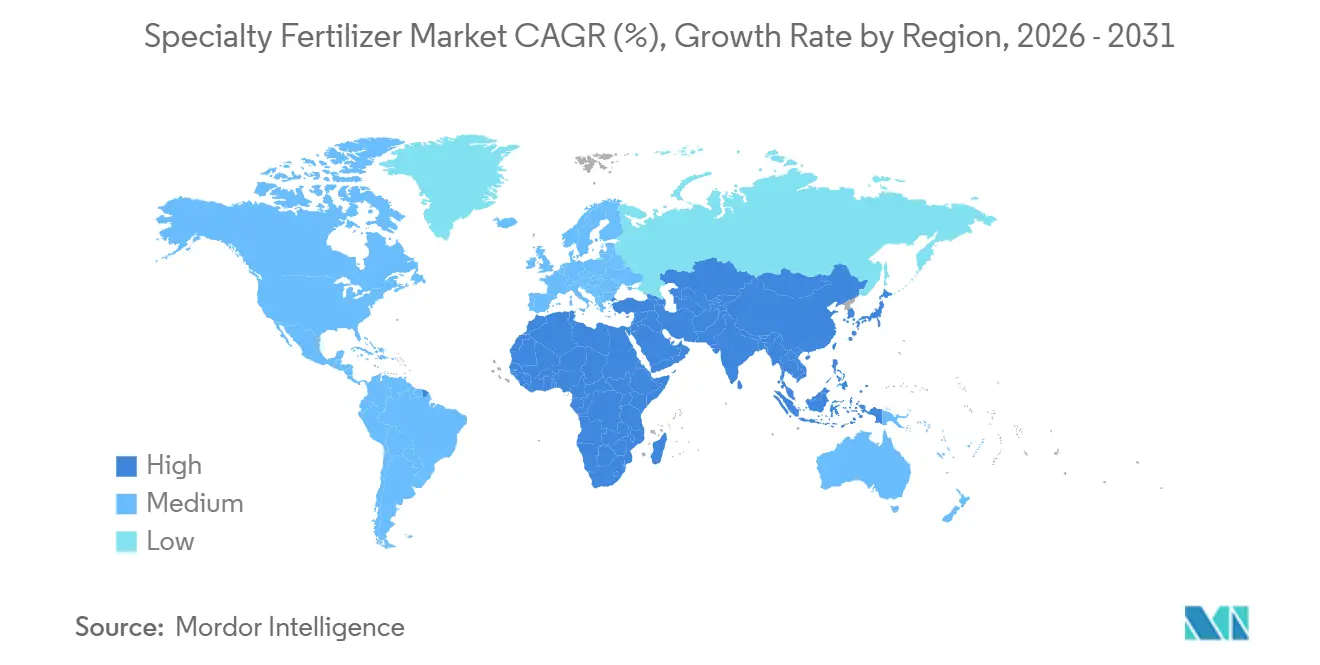
- By region, Asia-Pacific accounted for 33.8% of global revenue in 2025, making it the largest regional market, while the Middle East is anticipated to record the fastest growth, advancing at a CAGR of 8.8% through 2031.
Note: Market size and forecast figures in this report are generated using Mordor Intelligence’s proprietary estimation framework, updated with the latest available data and insights as of 2026.
Global Specialty Fertilizer Market Trends and Insights
Drivers Impact Analysis*
| Driver | (~) % Impact on CAGR Forecast | Geographic Relevance | Impact Timeline |
|---|---|---|---|
| Precision-agriculture adoption | +1.1% | North America, Europe, Oceania within Asia-Pacific | Short term (≤ 2 years) |
| Water scarcity and irrigation efficiency improvements | +0.9% | Middle East, North Africa, and South Asia | Medium term (2-4 years) |
| Greenhouse and vertical-farm expansion | +0.8% | Global, concentrated in the Asia-Pacific and the Middle East | Medium term (2-4 years) |
| Carbon-credit incentives for nutrient-use-efficient inputs | +0.7% | North America, Europe, and South America | Medium term (2-4 years) |
| CRISPR-enabled nutrient-dense crops | +0.4% | North America, Europe, and with spillover to the Asia-Pacific | Long term (≥ 4 years) |
| Digital traceability premiums for low-footprint produce | +0.5% | Europe, North America, and Japan | Medium term (2-4 years) |
| Source: Mordor Intelligence | |||


Precision-Agriculture Adoption
Precision agriculture is a significant driver of specialty fertilizer demand, as it focuses on targeted nutrient delivery. Technologies such as GPS-guided variable-rate application (VRA), soil nutrient mapping, and IoT-enabled fertigation systems allow farmers to apply nutrients site-specifically rather than uniformly. Specialty fertilizers, including water-soluble fertilizers (WSF), controlled-release fertilizers (CRF), and micronutrient blends, align well with these systems due to their uniform granulation and predictable nutrient-release profiles. Globally, the adoption of precision agriculture has grown rapidly. According to the United States Department of Agriculture, over the past 20 years, United States, farms have significantly increased their use of precision agriculture technologies. In 2023, guidance autosteering systems were utilized by 52% of midsize farms and 70% of large-scale crop-producing farms on tractors, harvesters, and other equipment[1]Source: United States Department of Agriculture Economic Research Service, “Adoption of Precision Agriculture Technologies on U.S. Farms, 2023 Update,” ers.usda.gov.
Water Scarcity and Irrigation Efficiency Improvements
Global water scarcity is driving the modernization of irrigation systems, increasing demand for specialty fertilizers compatible with drip and sprinkler systems. Agriculture accounts for a significant share of global freshwater withdrawals, with water-stressed regions such as the Middle East, North Africa, and South Asia actively adopting micro-irrigation technologies. Drip irrigation systems require fully soluble nutrient formulations to prevent clogging and ensure uniform nutrient distribution. Consequently, water-soluble fertilizers (WSFs) and liquid specialty blends are preferred. Between 2021 and 2025, Saudi Arabia's Agricultural Development Fund (ADF) has allocated SAR 825 million (USD 220 million) to promote high-tech greenhouse farming[2]Source: Agricultural Development Fund, “ADF Finances SAR 825 Million for High-Tech Greenhouse Projects (2021-2025),” adf.gov.sa. This trend supports the use of liquid and water-soluble fertilizers over granular alternatives, as they dissolve instantly, avoid clogging emitters, and enable real-time nutrient adjustments based on crop growth stages.
Carbon-Credit Incentives for Nutrient-Use-Efficient Inputs
Governments and carbon markets are promoting improved nutrient-use efficiency to mitigate nitrous oxide (N₂O) emissions, a greenhouse gas nearly 300 times more potent than CO₂. Enhanced-efficiency fertilizers (EEFs), such as controlled-release fertilizers and nitrification inhibitors, can reduce nitrogen losses by 30–50% compared to conventional urea. In South America, bio-enhanced blends that combine synthetic NPK with microbial inoculants are gaining popularity, particularly among Brazilian soybean growers. These growers can claim carbon credits through biological nitrogen fixation under the country's ABC+ low-carbon agriculture program. This trend supports the adoption of specialty nitrogen formulations over straight urea. In North America and Europe, voluntary carbon markets now reward growers who use enhanced-efficiency fertilizers to lower nitrous oxide emissions, providing a revenue stream that helps offset the higher costs of stabilized products.
Digital Traceability Premiums for Low-Footprint Produce
Retailers are increasingly focusing on traceable and sustainably produced food products. Digital platforms are being utilized to track farm-level input usage, including fertilizer types and nutrient-efficiency metrics. Specialty fertilizers support producers in documenting reduced nutrient runoff and minimizing environmental impact. In Europe and North America, retailers and food-service chains are demanding verifiable sustainability claims for fresh produce, offering price premiums of 8-15% to growers who provide data on fertilizer application rates, emission reductions, and water-use efficiency through digital platforms. This growing emphasis on traceability benefits specialty fertilizer suppliers that incorporate digital tracking into their products, as manual documentation of application data across multiple fields and crop cycles is impractical for growers.
Restraints Impact Analysis*
| Restraint | (~) % Impact on CAGR Forecast | Geographic Relevance | Impact Timeline |
|---|---|---|---|
| Raw material and energy price volatility | -1.0% | Europe, North America, and the Asia-Pacific | Short term (≤ 2 years) |
| High capital cost of fertigation hardware | -0.6% | Africa, South Asia, and South America | Medium term (2-4 years) |
| Emerging microplastic coating bans | -0.3% | Europe, North America, and with spillover to the Asia-Pacific | Long term (≥ 4 years) |
| Data-standard gaps for carbon accounting | -0.4% | Global, most acute in North America and Europe | Medium term (2-4 years) |
| Source: Mordor Intelligence | |||
Raw-Material and Energy Price Volatility
Specialty fertilizers rely significantly on upstream raw materials such as ammonia, phosphoric acid, and potash. Ammonia production is particularly energy-intensive, with natural gas accounting for a substantial portion of production costs. When gas prices rise sharply, as observed in Europe, where prices have exceeded historical averages in recent years, fertilizer production costs increase correspondingly. This cost inflation reduces margins for specialty nitrogen formulators, who are unable to fully pass on higher ammonia costs to growers already affected by volatile crop commodity markets.
Emerging Micro-Plastic Coating Bans
Controlled-release fertilizers often utilize polymer coatings to regulate nutrient release, but increasing regulatory scrutiny over microplastic pollution poses challenges. If polymer coatings are subject to stricter environmental standards, manufacturers will need to reformulate their products using biodegradable alternatives, which will increase production costs. Investments in R&D to ensure compliance may reduce short-term profitability. While innovation could mitigate these challenges in the long term, transitional costs are likely to impose moderate constraints on growth. Regulatory uncertainty also causes hesitation among turf managers and nursery operators, who depend on polymer-coated slow-release products for multi-month nutrient supply. Bio-based alternatives have yet to demonstrate equivalent performance in field trials, further complicating the transition.
*Our forecasts treat driver/restraint impacts as directional, not additive. The impact forecasts reflect baseline growth, mix effects, and variable interactions.
Segment Analysis
By Specialty Type: Liquid Formulations Anchor Leadership
Liquid fertilizers accounted for the largest specialty fertilizer market share of 38.5% in 2025, as fertigation systems continued to penetrate high-value crop segments. Stabilized liquids that incorporate urease inhibitors are also scaling up because carbon credit protocols reward lower nitrous oxide emissions. Conventional granular blends still dominate broad-acre cereals, but their share is eroding as growers retrofit pivots for fertigation and adopt variable-rate banding strategies. The rapid dissolution and ease of blending make these products suitable for variable-rate rigs requiring precise homogeneity. The adoption of large irrigated acreage in Asia-Pacific and South America sustains high volumes, while indoor farming values their low salt risk. Additionally, the segment benefits from an expanded distribution infrastructure that facilitates bulk shipments and on-farm blending.
Controlled-release fertilizers are the fastest-growing segment, projected to expand at a 8.8% CAGR through 2031, driven by polymer-coated urea, which delivers season-long nutrition for turf and greenhouse vegetables. The specialty fertilizer market for controlled-release offerings is projected to grow steadily as bio-based coatings that degrade within 90 days address microplastic concerns. Polymer-sulfur variants are increasingly adopted in sulfur-deficient regions, while biodegradable films address emerging microplastic regulations. Precision agriculture tools enhance efficiency by enabling a single application to support crops across multiple growth stages, thereby improving return on investment.


By Application Mode: Fertigation Dominates and Gains Velocity
Fertigation accounted for 48.1% of the specialty fertilizer market size in 2025 and is projected to remain the fastest-growing application mode, with a CAGR of 7.3% during 2026–2031. Water scarcity and subsidy-driven adoption of drip irrigation in countries such as India and Turkey continue to support its widespread use. The integration of dosing pumps with moisture sensors enables real-time nutrient adjustments, improving nutrient uptake rates and reducing runoff losses. Additionally, government regulations promoting water-efficient agriculture further encourage the adoption of specialty fertilizers through fertigation systems.
Soil application remains a widely used method in large-scale field crop production, where equipment compatibility and single-pass nutrient placement enhance operational efficiency. Foliar application continues to serve as a targeted nutrient delivery approach, particularly for correcting deficiencies during critical growth stages and improving crop quality. While fertigation leads in market adoption, the ongoing use of soil and foliar applications underscores the diverse nutrient management strategies employed across various cropping systems within the specialty fertilizer market.
By Crop Type: Horticulture Dominates Demand, Turf and Ornamental Records Fastest Growth
Horticultural crops accounted for the largest share of the specialty fertilizer market, at 43.0% in 2025. This dominance is attributed to the intensive nutrient requirements of fruits, vegetables, greenhouse crops, and other high-value agricultural systems. Growers are increasingly utilizing water-soluble fertilizers, specialty blends, and precision nutrient programs to enhance crop quality, ensure yield consistency, and improve marketable output. The segment continues to drive strong demand for premium fertilizer products across both protected cultivation and open-field production systems.
Turf and ornamental crops are anticipated to be the fastest-growing category, with a projected CAGR of 7.9% during 2026 to 2031. Increased investments in landscaping, golf courses, sports facilities, and urban green infrastructure are key factors supporting fertilizer consumption in this segment. While field crops remain a significant contributor, driven by extensive cultivation areas and the adoption of enhanced-efficiency fertilizers, turf and ornamental applications are projected to grow the fastest over the forecast period.
Geography Analysis
Asia-Pacific accounted for 33.8% of global specialty fertilizer revenue in 2025, making it the largest regional market. This is supported by China’s soil-testing subsidies and India’s specialty nutrient incentives for smallholders. Intensive land use in Japan and South Korea further propels per-hectare spending, while Australia’s drought management rules promote the use of fertigation systems with liquid blends. Southeast Asian palm and rice producers adopt enhanced-efficiency inputs to comply with sustainability certifications, adding incremental volume.
The Middle East registers the fastest regional expansion, with a 8.8% CAGR through 2031, led by Saudi Arabia’s USD 2.7 billion greenhouse build-out under Vision 2030 and Turkey’s 40% drip subsidy that converts citrus and vegetable acreage to fertigation[3]Source: Saudi Vision 2030, “Agriculture Strategy,” vision2030.gov.sa. Limited arable land and chronic water scarcity make precision nutrition non-negotiable, positioning polymer-coated and water-soluble grades for sustained outperformance.
North America experienced growth driven by carbon-credit enrollment programs that incentivize the use of nitrification inhibitors. Europe expanded as fertilizer taxes encouraged growers to adopt more efficient products, despite high gas prices. South America achieved growth, primarily due to the adoption of micronutrient-fortified Monoammonium phosphate (MAP) in Brazil's cerrado region. Africa progressed with localized blending initiatives in Nigeria and the adoption of fertigation practices in South Africa's fruit sector to maintain export quality.

Competitive Landscape
The specialty fertilizers market remains fragmented, with key players including Yara International ASA, The Mosaic Company, Sociedad Quimica y Minera de Chile SA (SQM), Nutrien Ltd, and Koch Industries Inc in 2025. Yara International holds a significant market share in 2025, followed by The Mosaic Company, while regional players and start-ups collectively account for a substantial share. Leading companies utilize vertical integration, covering raw materials to digital advisory services, to manage costs and secure customer loyalty through comprehensive solution offerings. Mid-sized firms differentiate themselves by focusing on biological additives, microgranulation, and crop-specific blends tailored to local agronomic needs.
Key areas of focus in the market include biodegradable coatings, nitrification inhibitors, and microbial consortia. Strategic initiatives continue to shape the industry, such as Yara’s acquisition of AgroNutri and Nutrien’s establishment of a new Controlled Release Fertilizers (CRF) plant, which enhance technology portfolios and expand regional presence. Partnerships with digital farming platforms, such as Mosaic’s launch of CropNutrition Pro, highlight a growing emphasis on data-driven service models that increase switching costs for growers.
Barriers to market entry include regulatory registration, environmental compliance, and the extent of dealer networks. Environmental certifications, such as the ISO 14001 recently obtained by SQM in Chile, reflect the increasing importance of sustainability credentials valued by buyers. Emerging opportunities in the market include specialty fertilizers designed for urban farming and combined seed-nutrient packages for CRISPR crops. These areas present growth potential for agile innovators to capture market share before larger incumbents fully engage.
Specialty Fertilizer Industry Leaders
Yara International ASA
The Mosaic Company
Sociedad Quimica y Minera de Chile SA
Nutrien Ltd
Koch Industries Inc.
- *Disclaimer: Major Players sorted in no particular order


Recent Industry Developments
- May 2024: ICL commenced commercial shipments of its controlled-release fertilizers featuring the eqo.x biodegradable coating, marking the first large-scale rollout of this technology. The initial launch targeted high-value European crops such as potatoes and onions, offering improved nutrient-use efficiency while addressing environmental concerns over traditional polymer coatings.
- April 2024: COMPO EXPERT has partnered with OCI Global to procure low-carbon ammonia for the production of NPK specialty fertilizers, resulting in a potential reduction of up to 60% in its carbon footprint.
- April 2023: Coramandel International introduced Acumist Calcium, a liquid calcium fertilizer developed to address calcium deficiencies in crops efficiently.


Global Specialty Fertilizer Market Report Scope
Specialty fertilizers are high-value nutrient formulations, including water-soluble, slow/controlled-release, and micronutrient-based products, designed to improve nutrient efficiency, minimize environmental impact, and address specific crop or soil needs. The Specialty Fertilizer Market is Segmented by Specialty Type (Controlled Release Fertilizers (CRF), Liquid Fertilizer, Slow-release fertilizers (SRF), and Water Soluble fertilizer), by Application Mode (Fertigation, Foliar, and Soil), by Crop Type (Field Crops, Horticultural Crops, and Turf and Ornamental), and by Region (Asia-Pacific, Europe, Middle East, Africa, North America, and South America). The Market Forecasts are Provided in Terms of Value (USD) and Volume (Metric Tons).
Specialty Type
| Controlled-Release Fertilizer (CRF) | Polymer Coated |
| Polymer-Sulfur Coated | |
| Others | |
| Liquid Fertilizer | |
| Slow-Release Fertilizer (SRF) | |
| Water-Soluble Fertilizer |
Application Mode
| Fertigation |
| Foliar |
| Soil |
Crop Type
| Field Crops |
| Horticultural Crops |
| Turf and Ornamental |
Region
| Asia-Pacific | Australia |
| Bangladesh | |
| China | |
| India | |
| Indonesia | |
| Japan | |
| Pakistan | |
| Philippines | |
| Thailand | |
| Vietnam | |
| Rest of Asia-Pacific | |
| Europe | France |
| Germany | |
| Italy | |
| Netherlands | |
| Russia | |
| Spain | |
| Ukraine | |
| United Kingdom | |
| Rest of Europe | |
| Middle East | Saudi Arabia |
| Turkey | |
| Rest of Middle East | |
| North America | Canada |
| Mexico | |
| United States | |
| Rest of North America | |
| South America | Argentina |
| Brazil | |
| Rest of South America | |
| Africa | South Africa |
| Nigeria | |
| Rest of Africa |
| Specialty Type | Controlled-Release Fertilizer (CRF) | Polymer Coated |
| Polymer-Sulfur Coated | ||
| Others | ||
| Liquid Fertilizer | ||
| Slow-Release Fertilizer (SRF) | ||
| Water-Soluble Fertilizer | ||
| Application Mode | Fertigation | |
| Foliar | ||
| Soil | ||
| Crop Type | Field Crops | |
| Horticultural Crops | ||
| Turf and Ornamental | ||
| Region | Asia-Pacific | Australia |
| Bangladesh | ||
| China | ||
| India | ||
| Indonesia | ||
| Japan | ||
| Pakistan | ||
| Philippines | ||
| Thailand | ||
| Vietnam | ||
| Rest of Asia-Pacific | ||
| Europe | France | |
| Germany | ||
| Italy | ||
| Netherlands | ||
| Russia | ||
| Spain | ||
| Ukraine | ||
| United Kingdom | ||
| Rest of Europe | ||
| Middle East | Saudi Arabia | |
| Turkey | ||
| Rest of Middle East | ||
| North America | Canada | |
| Mexico | ||
| United States | ||
| Rest of North America | ||
| South America | Argentina | |
| Brazil | ||
| Rest of South America | ||
| Africa | South Africa | |
| Nigeria | ||
| Rest of Africa | ||


Market Definition
- MARKET ESTIMATION LEVEL - Market Estimations for various types of fertilizers has been done at the product-level and not at the nutrient-level.
- NUTRIENT TYPES COVERED - Primary Nutrients: N, P and K, Secondary Macronutrients: Ca, Mg and S, Micronutients: Zn, Mn, Cu, Fe, Mo, B, and Others
- AVERAGE NUTRIENT APPLICATION RATE - This refers to the average volume of nutrient consumed per hectare of farmland in each country.
- CROP TYPES COVERED - Field Crops: Cereals, Pulses, Oilseeds, and Fiber Crops Horticulture: Fruits, Vegetables, Plantation Crops and Spices, Turf Grass and Ornamentals
| Keyword | Definition |
|---|---|
| Fertilizer | Chemical substance applied to crops to ensure nutritional requirements, available in various forms such as granules, powders, liquid, water soluble, etc. |
| Specialty Fertilizer | Used for enhanced efficiency and nutrient availability applied through soil, foliar, and fertigation. Includes CRF, SRF, liquid fertilizer, and water soluble fertilizers. |
| Controlled-Release Fertilizers (CRF) | Coated with materials such as polymer, polymer-sulfur, and other materials such as resins to ensure nutrient availability to the crop for its entire life cycle. |
| Slow-Release Fertilizers (SRF) | Coated with materials such as sulfur, neem, etc., to ensure nutrient availability to the crop for a longer period. |
| Foliar Fertilizers | Consist of both liquid and water soluble fertilizers applied through foliar application. |
| Water-Soluble Fertilizers | Available in various forms including liquid, powder, etc., used in foliar and fertigation mode of fertilizer application. |
| Fertigation | Fertilizers applied through different irrigation systems such as drip irrigation, micro irrigation, sprinkler irrigation, etc. |
| Anhydrous Ammonia | Used as fertilizer, directly injected into the soil, available in gaseous liquid form. |
| Single Super Phosphate (SSP) | Phosphorus fertilizer containing only phosphorus which has lesser than or equal to 35%. |
| Triple Super Phosphate (TSP) | Phosphorus fertilizer containing only phosphorus greater than 35%. |
| Enhanced Efficiency Fertilizers | Fertilizers coated or treated with additional layers of various ingredients to make it more efficient compared to other fertilizers. |
| Conventional Fertilizer | Fertilizers applied to crops through traditional methods including broadcasting, row placement, ploughing soil placement, etc. |
| Chelated Micronutrients | Micronutrient fertilizers coated with chelating agents such as EDTA, EDDHA, DTPA, HEDTA, etc. |
| Liquid Fertilizers | Available in liquid form, majorly used for application of fertilizers to crops through foliar and fertigation. |


Research Methodology
Mordor Intelligence follows a four-step methodology in all our reports.
- Step-1: IDENTIFY KEY VARIABLES: In order to build a robust forecasting methodology, the variables and factors identified in Step-1 are tested against available historical market numbers. Through an iterative process, the variables required for market forecast are set and the model is built on the basis of these variables.
- Step-2: Build a Market Model: Market-size estimations for the forecast years are in nominal terms. Inflation is not a part of the pricing, and the average selling price (ASP) is kept constant throughout the forecast period for each country.
- Step-3: Validate and Finalize: In this important step, all market numbers, variables and analyst calls are validated through an extensive network of primary research experts from the market studied. The respondents are selected across levels and functions to generate a holistic picture of the market studied.
- Step-4: Research Outputs: Syndicated Reports, Custom Consulting Assignments, Databases & Subscription Platforms


