Nitrogenous Fertilizers Market Size and Share
Market Overview
| Study Period | 2021 - 2031 |
|---|---|
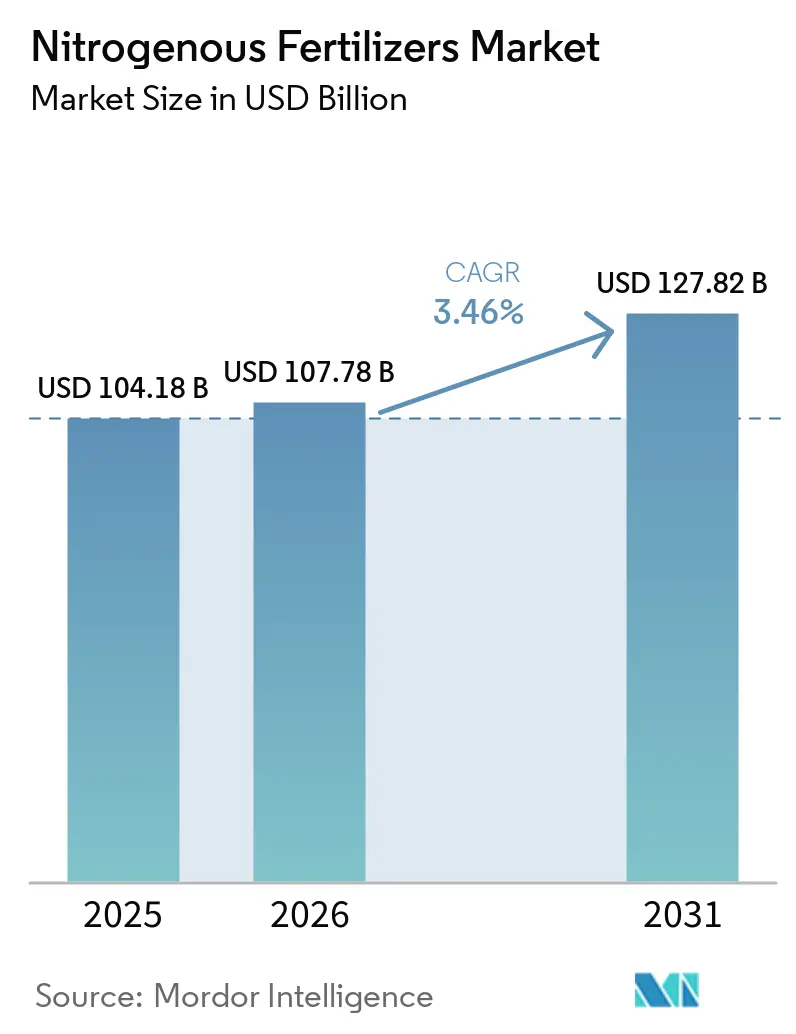
| Market Size (2026) | USD 107.78 Billion |
| Market Size (2031) | USD 127.82 Billion |
| Growth Rate (2026 - 2031) | 3.46% CAGR |
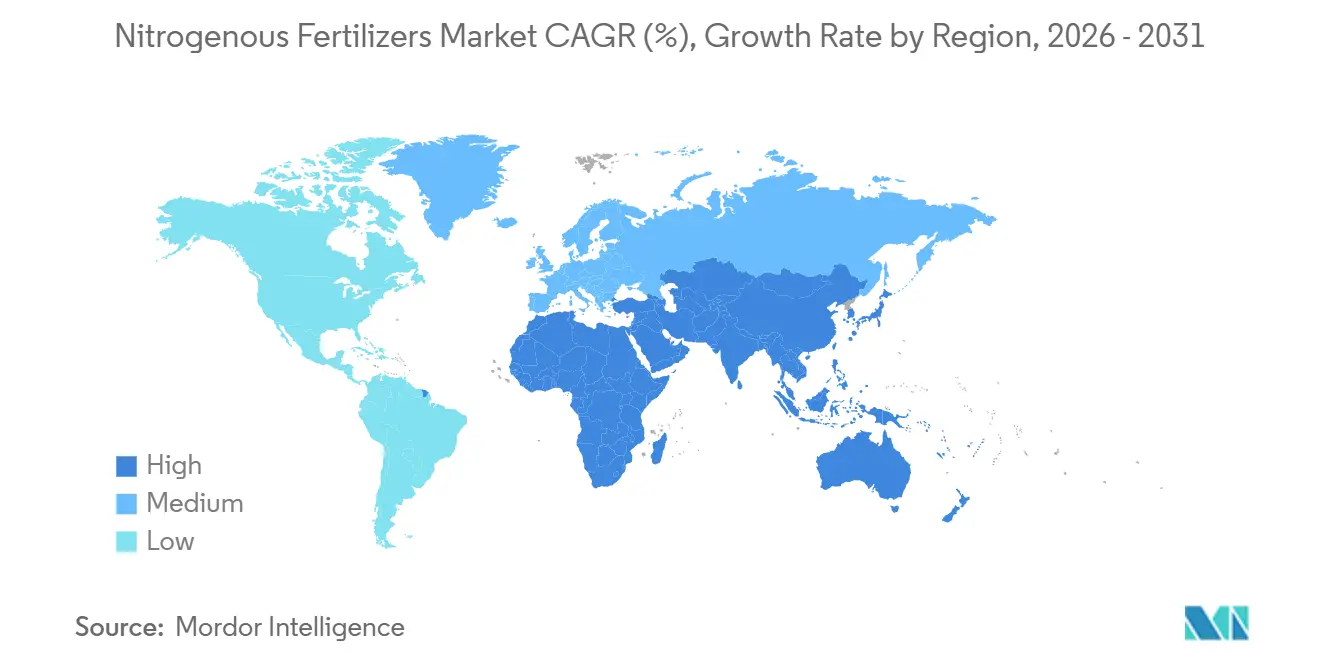
| Fastest Growing Market | Middle East |
| Largest Market | Asia-Pacific |
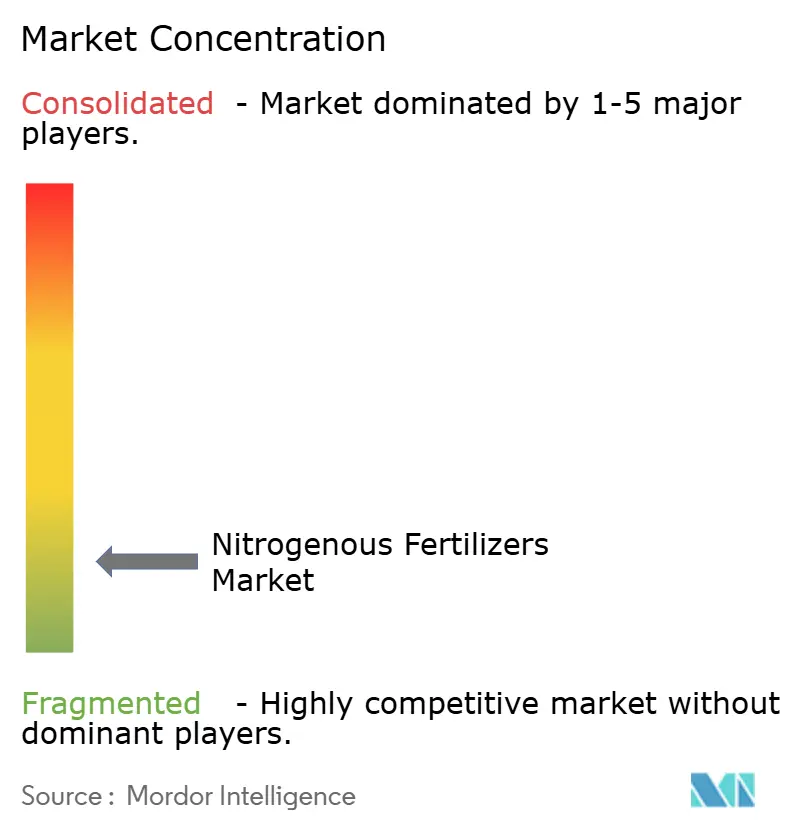
| Market Concentration | Low |
Major Players *Disclaimer: Major Players sorted in no particular order Image © Mordor Intelligence. Reuse requires attribution under CC BY 4.0. | |
Nitrogenous Fertilizers Market Analysis by Mordor Intelligence
The nitrogenous fertilizers market size was valued at USD 104.18 billion in 2025 and estimated to grow from USD 107.78 billion in 2026 to reach USD 127.82 billion by 2031, at a CAGR of 3.46% during the forecast period (2026-2031). The growing population continues to sustain baseline demand for wheat, rice, and corn. However, growth is now influenced by several key developments. Early green-ammonia plants are transitioning from pilot projects to commercial operations, introducing a premium segment of low-carbon products supported by long-term offtake agreements. Digital soil-health platforms enable variable-rate fertilizer application, reducing waste and encouraging the adoption of higher-priced enhanced-efficiency fertilizers. Food brands with carbon-reduction targets are driving demand for fertilizers certified for lower emissions, prompting producers to implement nitrous oxide abatement technologies and to use renewable hydrogen inputs. These factors are shaping a dual-speed market, where bulk urea maintains volume leadership, while specialty products offer opportunities for higher margins.
Key Report Takeaways
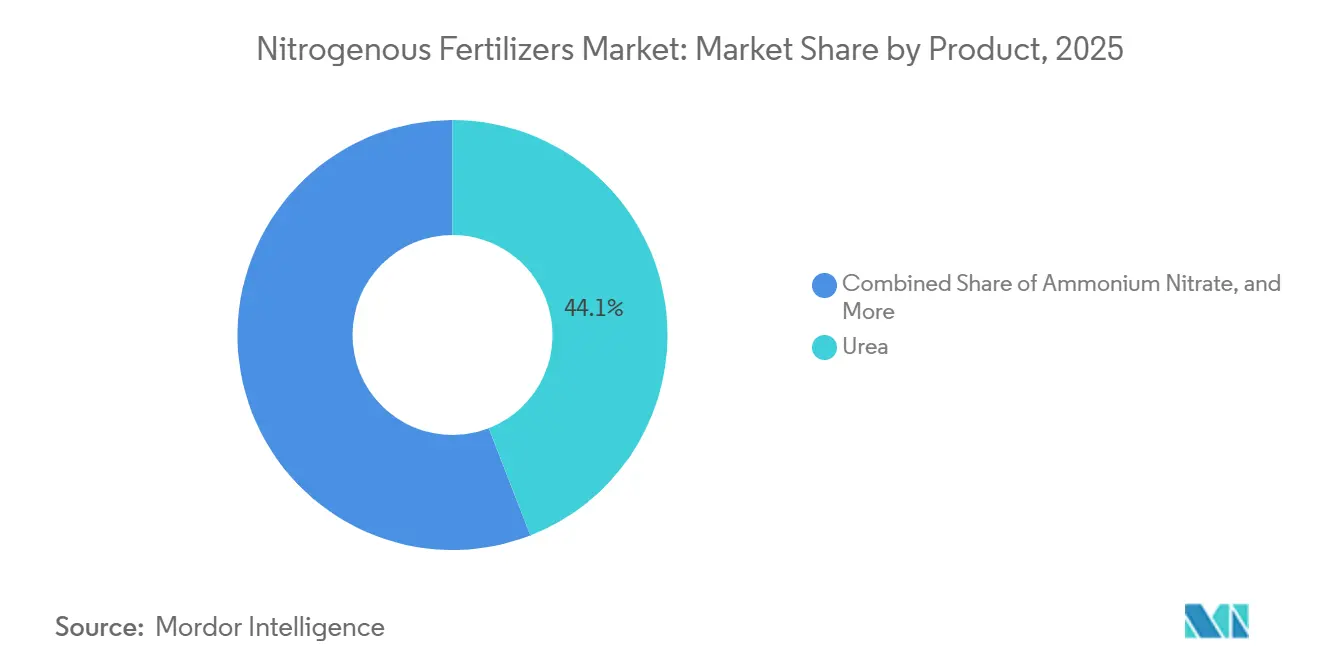
- By product category, urea led with 44.1% of the nitrogenous fertilizers market share in 2025 and is projected to advance at a 6.7% CAGR through 2031.
- By form, conventional products accounted for 61.8% of the nitrogenous fertilizers market size in 2025, and specialty products are the fastest-growing, with a 7.4% CAGR through 2026-2031.
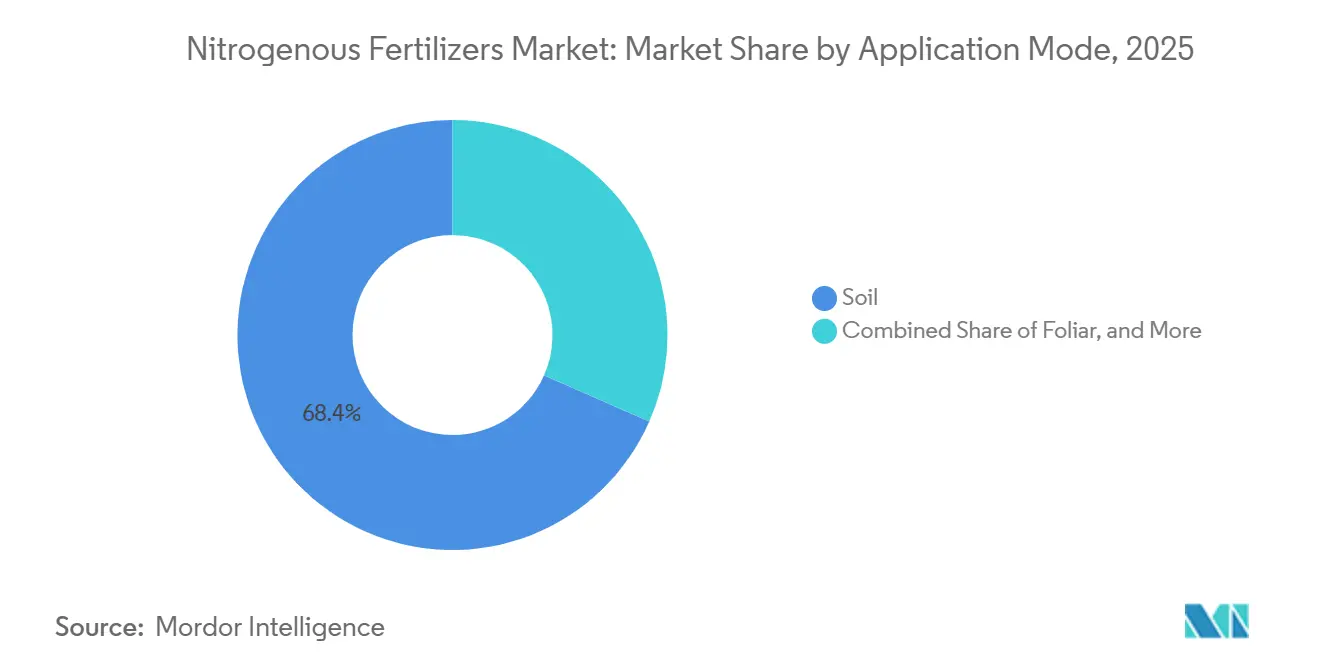
- By application mode, soil methods captured 68.4% of the market share in 2025, and fertigation is expanding at a 7.1% CAGR through 2026-2031.
- By crop type, field crops absorbed 56.9% of the market share in 2025, while horticultural crops are forecast to grow at a 6.9% CAGR through 2026-2031.
- By geography, Asia-Pacific accounted for 36.0% of global value in 2025, and the Middle East was forecast to log the fastest regional expansion at a 4.8% CAGR through 2026-2031.
- The nitrogenous fertilizers market is fragmented, with a mix of global players and prominent regional producers. Key companies include CF Industries Holdings, Inc., EuroChem Group, Nutrien Ltd., SABIC Agri-Nutrients Co., and Yara International ASA.
Note: Market size and forecast figures in this report are generated using Mordor Intelligence’s proprietary estimation framework, updated with the latest available data and insights as of 2026.
Global Nitrogenous Fertilizers Market Trends and Insights
Drivers Impact Analysis*
| Driver | (~) % Impact on CAGR Forecast | Geographic Relevance | Impact Timeline |
|---|---|---|---|
| Rising demand for staple crops | +1.2% | Global, strongest in Asia-Pacific and Africa | Medium term (2–4 years) |
| Sustained government support for fertilizer subsidies | +1.0% | India, Indonesia, Bangladesh, Saudi Arabia, Egypt, and Nigeria | Short term (≤ 2 years) |
| Diversification of low-cost ammonia feedstock sources | +0.8% | China, Middle East, and North America | Long term (≥ 4 years) |
| Acceleration of green-ammonia pilot plants | +0.6% | Europe, Middle East, and Chile | Long term (≥ 4 years) |
| Digitized soil-health mapping for nitrogen use optimization | +0.5% | North America, Europe, Australia, and Japan | Medium term (2–4 years) |
| Corporate carbon-footprint targets driving low-emission nitrogen production | +0.5% | Global, led by North America and Europe | Medium term (2–4 years) |
| Source: Mordor Intelligence | |||


Rising Demand for Staple Crops
Global population growth and the reliance on dietary staples continue to support steady nitrogen demand across wheat, rice, and corn cultivation cycles. As per the Global Agriculture Report on the Organization for Economic Co-operation and Development (OECD) and Food and Agriculture Organization (FAO) Projections, the Asia-Pacific region accounts for over 60% of global rice production and 45% of global wheat output in 2025, driving consistent demand for urea and ammonia, even as yield improvements slow. According to the Ministry of Agriculture, Government of India, the country's wheat production target of more than 115 million metric tons for the 2026 crop year sustains fertilizer demand, despite subsidy reforms aimed at reducing fiscal pressures[1]Source: Ministry of Agriculture, Government of India, “Digital Agriculture Mission,” agricoop.nic.in. Strategically, nitrogen consumption remains robust, shielding the market from significant demand declines during economic downturns. Future growth is projected to rely more on yield intensification rather than the expansion of cultivated acreage.
Sustained Government Support for Fertilizer Subsidies
Policy incentives play a crucial role in reducing farmers' input costs and increasing nitrogen usage, particularly in price-sensitive markets. In 2024, Bangladesh introduced a pilot direct benefit transfer scheme. This model aims to reduce market distortions while maintaining farmers' purchasing power. These initiatives indicate robust demand, encouraging private sector investment in production capacity, distribution infrastructure, and innovation. Additionally, some governments are promoting domestic ammonia production to reduce dependency on imports and strengthen supply chains. This policy shift is designed to enhance long-term resilience in fertilizer availability, extending beyond reliance on price controls.
Acceleration of Green-Ammonia Pilot Plants
Demonstration plants are driving long-term demand for low-carbon nitrogen by proving technical feasibility and securing offtake agreements with food companies. Topsoe's solid oxide electrolyzer cell technology, implemented in a 5-megawatt pilot project in Denmark in 2024, achieved more than 80% electrical efficiency in hydrogen production. This efficiency level makes green ammonia economically viable when renewable electricity costs drop below USD 30 per megawatt-hour. Chile's HyEx project aims to produce 750,000 metric tons of green ammonia by 2030, leveraging Patagonian wind resources with capacity factors exceeding 50%. The Ammonia Energy Association tracked a cumulative pipeline of more than 485 green and blue ammonia projects in 2025. This indicates a structural shift toward decarbonized nitrogen, although fewer than 5% of these projects had reached a final investment decision by the end of the year.
Digitized Soil-Health Mapping for Nitrogen Use Optimization
High-resolution nitrogen recommendation platforms help reduce wastage and improve nutrient uptake by tailoring application rates to field-level variability. Under India's Digital Agriculture Mission, launched in 2024, soil health cards were distributed to 140 million farmers, providing crop-specific nitrogen recommendations based on soil organic carbon and pH levels. While this optimization improves nitrogen use efficiency and reduces per-hectare demand, it also poses a challenge. The expansion of total cultivated area requires adjustments in revenue models. As a result, producers are increasingly prioritizing premium-priced enhanced-efficiency fertilizers over bulk commodity volumes.
Restraints Impact Analysis*
| Restraint | (~) % Impact on CAGR Forecast | Geographic Relevance | Impact Timeline |
|---|---|---|---|
| Natural-gas price volatility | −1.1% | Europe, North America, and gas-importing Asian nations | Short term (≤ 2 years) |
| Tightening environmental regulations on nitrate leaching | −0.7% | European Union, selected North American states | Medium term (2–4 years) |
| Ocean-freight bottlenecks on key ammonia routes | −0.4% | South America, Africa, and Southeast Asia | Short term (≤ 2 years) |
| On-farm adoption of biological nitrogen-fixation products | −0.3% | United States corn belt, Brazil soybeans, pilot trials in India | Long term (≥ 4 years) |
| Source: Mordor Intelligence | |||
Natural-Gas Price Volatility
Fluctuations in natural gas prices substantially raise nitrogen production costs and retail prices, leading to reduced demand in price-sensitive markets. This dynamic particularly impacts agricultural sectors reliant on nitrogen-based fertilizers, as higher costs can strain budgets and limit usage. As a result, gas-dependent producers face margin compression during price surges, which affects their profitability and operational efficiency. These challenges are driving a shift toward alternative production methods, such as coal gasification in China, which leverages the country's abundant coal reserves, and renewable-powered electrolysis in regions with ample wind and solar energy resources, offering a more sustainable and cost-stable solution.
Tightening Environmental Regulations on Nitrate Leaching
The European Union and specific states have introduced stricter regulations on nitrogen usage in intensive agricultural regions, including application limits and associated fines. The program mandates adherence to application rate caps at agronomic-optimum levels and requires growers to electronically report nitrogen use. These regulations aim to address environmental concerns, such as water contamination and greenhouse gas emissions, caused by excessive nitrogen application. As a result, compliance costs and administrative burdens for growers have increased, encouraging growers to adopt enhanced-efficiency fertilizers with nitrification and urease inhibitors to reduce leaching losses and improve nitrogen use efficiency. These fertilizers, designed to minimize environmental impact while maintaining crop productivity, are considerably more expensive than conventional urea, adding to farmers' financial pressures.
*Our forecasts treat driver/restraint impacts as directional, not additive. The impact forecasts reflect baseline growth, mix effects, and variable interactions.
Segment Analysis
By Product Category: Urea Sustains Volume Leadership
Urea accounted for the largest sub-segment, with a 44.1% share of the nitrogenous fertilizers market in 2025, and also the fastest-growing segment, is projected to advance at a 6.7% CAGR through 2031. Urea's high nitrogen content, cost advantage over ammonium nitrate and anhydrous ammonia, and compatibility with existing field-crop application equipment drive its widespread adoption. In India, the neem-coated urea mandate, which requires 100% of domestically produced urea to include neem oil by 2025, has reduced nitrogen volatilization losses by 15-20% and extended nutrient release [2]Source: Fertilizer Department, Government of India, “PLI Scheme Guidelines,” fert.nic.in. This initiative improves agronomic efficiency without necessitating behavioral changes among farmers. Both cost considerations and infrastructure dependencies influence the strategic preference for urea. Farmers in Asia-Pacific and Africa have invested in broadcast spreaders and fertigation systems designed for granular urea, creating switching costs that protect urea demand from competition posed by liquid nitrogen solutions.
Urea's cost-effectiveness and compatibility with soil incorporation and fertigation systems solidify its role in large-scale grain production. Producers are modernizing plants with energy-efficient catalysts and emission control technologies to ensure supply security at competitive costs. Investments such as CF Industries’ Donaldsonville expansion bolster regional self-sufficiency and export capabilities, maintaining urea's dominance in the nitrogen fertilizer market. Specialty urea grades are increasingly used in irrigated horticulture and high-value cash crops, where precise nutrient delivery enhances profitability. Meanwhile, ammonium nitrate remains significant in regions with established regulations and storage infrastructure, and anhydrous ammonia continues to support direct injection systems in North American row crop farming.


By Form: Specialty Gains Despite Conventional Dominance
Conventional products are the largest segment by form, accounting for 61.8% of the nitrogenous fertilizers market share in 2025. This growth reflects the established role of bulk urea, ammonium nitrate, and anhydrous ammonia in large-scale row-crop agriculture. Large centralized production facilities benefit from economies of scale, reducing unit costs and ensuring competitiveness, particularly in developing markets. Additionally, extensive dealer networks and farmer familiarity further reinforce the dominance of conventional nitrogen fertilizers in broad-acre cropping systems. Their widespread use in major crops such as cereals, rice, wheat, and maize is driven by their cost-effectiveness, high nutrient availability, and well-established production and distribution infrastructure.
The nitrogen fertilizer market size for specialty exhibits the fastest growth trajectory, with a 7.4% CAGR through 2031, signaling a clear premium shift in how value is created across the category. That shift is strongest in horticulture, greenhouse cultivation, and professional crop systems, where growers can justify higher unit pricing by achieving higher yield quality and lower waste. Regulation is adding another layer of support, especially in Europe, where tighter nutrient controls raise the appeal of products designed for more efficient uptake. India’s neem-coated urea policy also matters because it familiarized a very large farmer base with enhanced-efficiency concepts at scale, even though it began as a public policy tool rather than a premium commercial program. Across the nitrogen fertilizer industry, specialty growth therefore looks less like a niche story and more like a gradual restructuring of the value chain around performance, compliance, and service.
By Application Mode: Soil Retains Dominance
Soil methods are the largest segment, captured 68.4% of the nitrogenous fertilizer market share in 2025. These methods, including broadcast spreading, banding, and incorporation, dominate field-crop agriculture. Farmers prefer these techniques as they integrate effectively with existing machinery, minimizing the need for additional capital investment. Ongoing research on optimal placement and timing continues to refine these practices, ensuring consistent yield responses across diverse soil types. Additionally, soil incorporation reduces volatilization losses, enhancing cost efficiency.
The nitrogen fertilizer market for fertigation is the fastest-growing segment, projected to grow at a 7.1% CAGR through 2031, and that pace reflects both infrastructure expansion and stronger evidence of agronomic benefits. The 2025 Horticulturae study cited in the draft showed higher yields, greater nitrogen use efficiency, and a better return on investment when irrigation and nutrient delivery were optimized together in tomatoes. Foliar application remains on a much smaller scale, but it is gaining a clearer role in orchards, vineyards, and specialty crops, where rapid correction of nutrient deficiencies can protect crop quality. In more advanced farm systems, the line between these application modes is becoming less rigid because growers use fertigation as the base program and foliar sprays as a targeted correction tool. The practical outcome is that the nitrogen fertilizer market is increasingly tied to delivery systems and farm technology, rather than just the fertilizer product itself.
By Crop Type: Field Crops Drive Volume Demand
Field crops are the largest segment by crop type, accounting for 56.9% of the nitrogenous fertilizer market share in 2025, primarily due to the cultivation of wheat, rice, corn, and oilseeds, which require 100-200 kilograms of nitrogen per hectare annually. Factors such as government support programs, reliable commodity offtake, and well-established extension services contribute to consistent fertilizer demand across extensive grain belts in regions like the Asia Pacific, North America, and Europe. The economies of scale, standardized equipment, and predictable agronomic practices associated with field crops ensure their central role in the nitrogen fertilizer market, providing a stable baseline for volume demand.
Horticultural crops are the fastest segment forecast to grow at a 6.9% CAGR through 2031, marking the fastest growth among crop types. This growth is driven by increasing per-capita consumption of fresh produce and the expansion of greenhouse cultivation. The accelerated demand for horticultural crops is driven by dietary shifts toward fruits and vegetables in emerging markets, greenhouse production's ability to enable year-round cultivation in temperate regions, and premium pricing that offsets higher nitrogen input costs. Advancements in greenhouse technologies, such as improved climate control systems and efficient irrigation methods, are enhancing productivity and reducing resource wastage, further driving the adoption of horticultural crops. The ability of these crops to cater to the rising demand for organic and sustainably grown produce also contributes to their robust growth trajectory.
Geography Analysis
Asia-Pacific is the largest geography, and accounted for 36.0% of the nitrogenous fertilizers market in 2025, supported by extensive agricultural land, high cropping intensity, and favorable subsidy frameworks. China's focus on food security and India's efforts to modernize smallholder farming ensure a steady baseline demand. The increasing adoption of multiple-cropping systems and higher-yielding hybrids necessitates consistent nitrogen inputs. Additionally, domestic production capacities in the region reduce reliance on imports for many market participants. Emerging Southeast Asian economies are witnessing gradual growth as they expand crop cultivation, including palm, rice, and vegetables, to meet the needs of growing urban populations.
The Middle East is anticipated to log the fastest regional expansion, with a 4.8% CAGR through 2026-2031. This growth is driven by Saudi Arabia's investments in green ammonia. Saudi Arabia's NEOM green hydrogen project, aiming to produce 1.2 million metric tons of green ammonia annually by 2026, has secured offtake agreements with European and Asian buyers seeking low-carbon nitrogen solutions, positioning the country as a premium exporter [3]Source: NEOM, “Green Hydrogen and Ammonia Project,” neom.com. In Sub-Saharan Africa, nitrogen consumption is increasing due to the expansion of maize cultivation and government subsidy programs in Kenya, Tanzania, and Ethiopia. Challenges such as infrastructure deficits and limited credit access continue to hinder fertilizer adoption in the region.
North America and Europe represent mature but evolving markets. North American producers benefit from shale gas economics, which enhance export competitiveness, while the adoption of precision agriculture supports incremental volume growth. In Europe, stringent environmental policies limit overall tonnage but drive demand for enhanced-efficiency fertilizers and digital advisory services that align with the Farm to Fork strategy. South America is experiencing growth fueled by Brazilian agricultural frontier expansion and yield recovery in Argentina. Meanwhile, Africa holds long-term growth potential as improvements in infrastructure, credit access, and extension services gradually enhance fertilizer penetration across the continent.

Competitive Landscape
The nitrogenous fertilizers market is fragmented, with a mix of global players and prominent regional producers. Key companies include CF Industries Holdings, Inc., EuroChem Group, Nutrien Ltd., SABIC Agri-Nutrients Co., and Yara International ASA, which leverage integrated retail distribution networks in North America and employ potash-nitrogen bundling strategies to capture margin premiums. Yara International ASA differentiates itself through its Climate Choice portfolio, which offers products with carbon intensities 30-90% lower than competitors. This has enabled the company to secure contracts with European dairy cooperatives and North American grain processors, who are willing to pay premiums of USD 20-50 per metric ton.
Strategic priorities in the nitrogenous fertilizers market are increasingly focused on sustainability, capacity expansion, and digital transformation. Companies are making significant investments in low-carbon ammonia production, reflecting a long-term commitment to environmentally sustainable inputs. Additionally, digital agronomy platforms and precision tools are being adopted to enhance product differentiation and provide customized nutrient recommendations. These technologies also generate valuable data to guide future product development. Collectively, these initiatives are reshaping competition and enabling companies to expand their market share through innovation and customer-focused strategies.
Innovation in logistics and storage has become a key area of focus for fertilizer producers aiming to manage costs and strengthen supply chain resilience. Investments in specialized transport solutions and upgraded energy systems are enhancing operational efficiency. As environmental regulations become more stringent, compliance with global standards is critical for maintaining market access. This has driven continuous investment in monitoring technologies and mitigation practices aligned with sustainability objectives. In this evolving market environment, operational excellence and adherence to regulatory requirements are essential for maintaining a competitive position in the nitrogenous fertilizers industry.
Nitrogenous Fertilizers Industry Leaders
CF Industries Holdings, Inc.
EuroChem Group
Nutrien Ltd.
SABIC Agri-Nutrients Co.
Yara International ASA
- *Disclaimer: Major Players sorted in no particular order

Recent Industry Developments
- May 2026: The European Commission implemented the Fertilizer Action Plan, which integrates emergency support measures, such as duty-free tariff rate quotas for urea and ammonia, along with a medium-term strategy to decrease reliance on imported mineral nitrogen. This plan aims to address immediate challenges in the fertilizer market while promoting long-term sustainability by encouraging the adoption of alternative sources and reducing dependency on external supplies.
- December 2025: Yara International ASA entered advanced negotiations with Air Products to collaborate on low-emission ammonia projects. These projects include the Louisiana Clean Energy Complex, which focuses on reducing carbon emissions in industrial processes, and the NEOM Green Hydrogen Project in Saudi Arabia, aimed at producing sustainable hydrogen and ammonia to support global energy transition goals.
- April 2025: CF Industries Holdings, Inc., JERA Co., Inc., and Mitsui & Co., Inc. have announced a final investment decision to develop a low-carbon ammonia facility with a production capacity of 1.4 million metric tons per year at the Blue Point Complex in Ascension Parish, Louisiana. This facility supports the nitrogenous fertilizers market by providing a sustainable, low-carbon source of ammonia, a key component of fertilizer production.


Global Nitrogenous Fertilizers Market Report Scope
Nitrogenous fertilizer is a nutrient-rich compound, available in solid or liquid form, applied to soil to supply the essential nitrogen required for plant growth, chlorophyll production, and increased crop yields. It is essential, as natural soil often lacks sufficient nitrogen to meet plant needs. Common types include urea, ammonium nitrate, and anhydrous ammonia.
The Nitrogen Fertilizers Market Report is Segmented by Product Category (Ammonium Nitrate, Anhydrous Ammonia, and More), by Form (Conventional and Specialty), by Application Mode (Fertigation, and More), by Crop Type (Field Crops, Horticultural Crops, and More), and by Geography (Asia-Pacific, Europe, The Middle East, Africa, and More). The Market Forecasts are Provided in Terms of Value (USD) and Volume (Metric Tons).
| Ammonium Nitrate |
| Anhydrous Ammonia |
| Urea |
| Others |
| Conventional | |
| Speciality | Controlled Release Fertilizers (CRFs) |
| Liquid Fertilizer | |
| Slow-Release Fertilizers (SRFs) | |
| Water Soluble |
| Fertigation |
| Foliar |
| Soil |
| Field Crops |
| Horticultural Crops |
| Turf and Ornamental |
| Asia-Pacific | Australia |
| Bangladesh | |
| China | |
| India | |
| Indonesia | |
| Japan | |
| Pakistan | |
| Philippines | |
| Thailand | |
| Vietnam | |
| Rest of Asia-Pacific | |
| Europe | France |
| Germany | |
| Italy | |
| Netherlands | |
| Russia | |
| Spain | |
| Ukraine | |
| United Kingdom | |
| Rest of Europe | |
| Middle East | Turkey |
| Saudi Arabia | |
| Rest of Middle East | |
| Africa | South Africa |
| Nigeria | |
| Rest of Africa | |
| North America | Canada |
| Mexico | |
| United States | |
| Rest of North America | |
| South America | Argentina |
| Brazil | |
| Rest of South America |
| By Product Category | Ammonium Nitrate | |
| Anhydrous Ammonia | ||
| Urea | ||
| Others | ||
| By Form | Conventional | |
| Speciality | Controlled Release Fertilizers (CRFs) | |
| Liquid Fertilizer | ||
| Slow-Release Fertilizers (SRFs) | ||
| Water Soluble | ||
| By Application Mode | Fertigation | |
| Foliar | ||
| Soil | ||
| By Crop Type | Field Crops | |
| Horticultural Crops | ||
| Turf and Ornamental | ||
| By Geography | Asia-Pacific | Australia |
| Bangladesh | ||
| China | ||
| India | ||
| Indonesia | ||
| Japan | ||
| Pakistan | ||
| Philippines | ||
| Thailand | ||
| Vietnam | ||
| Rest of Asia-Pacific | ||
| Europe | France | |
| Germany | ||
| Italy | ||
| Netherlands | ||
| Russia | ||
| Spain | ||
| Ukraine | ||
| United Kingdom | ||
| Rest of Europe | ||
| Middle East | Turkey | |
| Saudi Arabia | ||
| Rest of Middle East | ||
| Africa | South Africa | |
| Nigeria | ||
| Rest of Africa | ||
| North America | Canada | |
| Mexico | ||
| United States | ||
| Rest of North America | ||
| South America | Argentina | |
| Brazil | ||
| Rest of South America | ||


Market Definition
- MARKET ESTIMATION LEVEL - Market Estimations for various types of fertilizers has been done at the product-level and not at the nutrient-level.
- NUTRIENT TYPES COVERED - All Nitrogenous Fertilizers
- AVERAGE NUTRIENT APPLICATION RATE - This refers to the average volume of nutrient consumed per hectare of farmland in each country.
- CROP TYPES COVERED - Field Crops: Cereals, Pulses, Oilseeds, and Fiber Crops Horticulture: Fruits, Vegetables, Plantation Crops and Spices, Turf Grass and Ornamentals
| Keyword | Definition |
|---|---|
| Fertilizer | Chemical substance applied to crops to ensure nutritional requirements, available in various forms such as granules, powders, liquid, water soluble, etc. |
| Specialty Fertilizer | Used for enhanced efficiency and nutrient availability applied through soil, foliar, and fertigation. Includes CRF, SRF, liquid fertilizer, and water soluble fertilizers. |
| Controlled-Release Fertilizers (CRF) | Coated with materials such as polymer, polymer-sulfur, and other materials such as resins to ensure nutrient availability to the crop for its entire life cycle. |
| Slow-Release Fertilizers (SRF) | Coated with materials such as sulfur, neem, etc., to ensure nutrient availability to the crop for a longer period. |
| Foliar Fertilizers | Consist of both liquid and water soluble fertilizers applied through foliar application. |
| Water-Soluble Fertilizers | Available in various forms including liquid, powder, etc., used in foliar and fertigation mode of fertilizer application. |
| Fertigation | Fertilizers applied through different irrigation systems such as drip irrigation, micro irrigation, sprinkler irrigation, etc. |
| Anhydrous Ammonia | Used as fertilizer, directly injected into the soil, available in gaseous liquid form. |
| Single Super Phosphate (SSP) | Phosphorus fertilizer containing only phosphorus which has lesser than or equal to 35%. |
| Triple Super Phosphate (TSP) | Phosphorus fertilizer containing only phosphorus greater than 35%. |
| Enhanced Efficiency Fertilizers | Fertilizers coated or treated with additional layers of various ingredients to make it more efficient compared to other fertilizers. |
| Conventional Fertilizer | Fertilizers applied to crops through traditional methods including broadcasting, row placement, ploughing soil placement, etc. |
| Chelated Micronutrients | Micronutrient fertilizers coated with chelating agents such as EDTA, EDDHA, DTPA, HEDTA, etc. |
| Liquid Fertilizers | Available in liquid form, majorly used for application of fertilizers to crops through foliar and fertigation. |


Research Methodology
Mordor Intelligence follows a four-step methodology in all our reports.
- Step-1: IDENTIFY KEY VARIABLES: In order to build a robust forecasting methodology, the variables and factors identified in Step-1 are tested against available historical market numbers. Through an iterative process, the variables required for market forecast are set and the model is built on the basis of these variables.
- Step-2: Build a Market Model: Market-size estimations for the forecast years are in nominal terms. Inflation is not a part of the pricing, and the average selling price (ASP) is kept constant throughout the forecast period for each country.
- Step-3: Validate and Finalize: In this important step, all market numbers, variables and analyst calls are validated through an extensive network of primary research experts from the market studied. The respondents are selected across levels and functions to generate a holistic picture of the market studied.
- Step-4: Research Outputs: Syndicated Reports, Custom Consulting Assignments, Databases & Subscription Platforms


