Market Overview
| Study Period | 2021 - 2031 |
|---|---|
| Forecast Data Period | 2026 - 2031 |
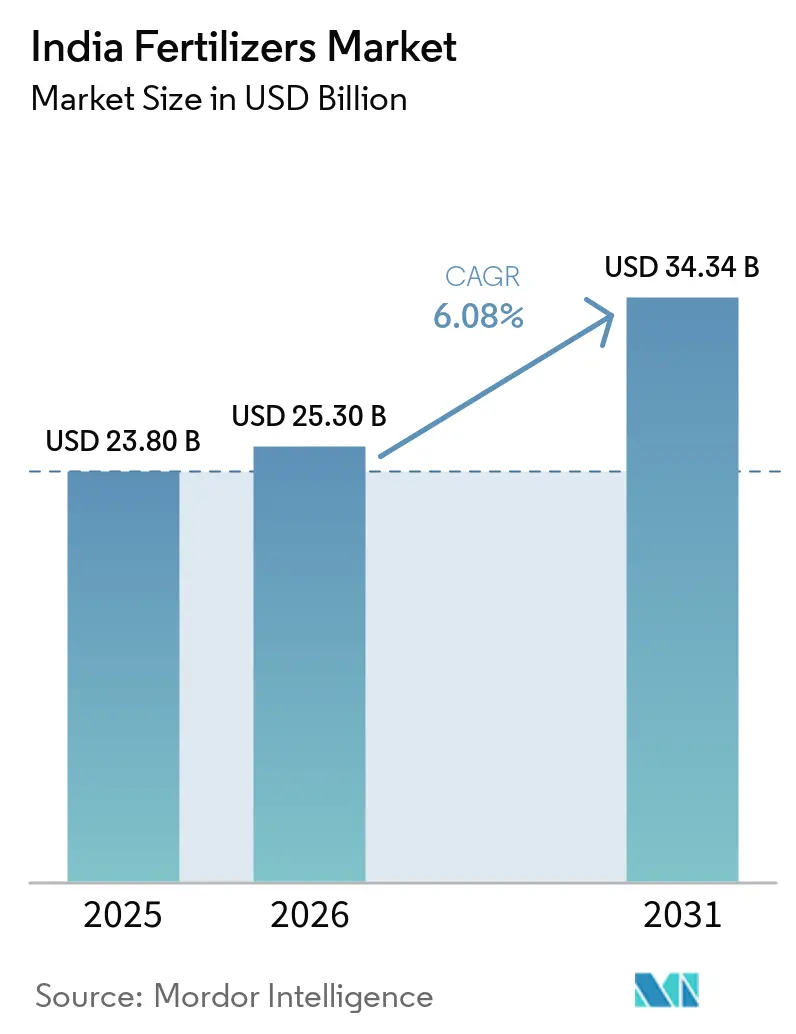
| Base Year Market Size (2025) | USD 23.80 Billion |
| Market Size (2026) | USD 25.30 Billion |
| Market Size (2031) | USD 34.34 Billion |
| Growth Rate (2026 - 2031) | 6.08% CAGR |
| Market Concentration | Low |
Major Players*Disclaimer: Major Players sorted in no particular order Image © Mordor Intelligence. Reuse requires attribution under CC BY 4.0. | |
India Fertilizers Market Analysis by Mordor Intelligence
The India fertilizers market size is projected to expand from USD 23.80 billion in 2025 and USD 25.30 billion in 2026 to USD 34.34 billion by 2031, registering a fastest-growing 6.08% CAGR between 2026 and 2031. Balanced nutrient policies, rapid specialty product rollout, and rising micro-irrigation coverage underpin this expansion, while lingering subsidy delays and raw-material import volatility create near-term headwinds. Policy moves such as the nutrient-based subsidy (NBS) framework have already tilted demand toward complex grades and micronutrient-fortified blends, supporting sustained value growth across the India fertilizers market. Growing horticulture acreage, accelerated nano-fertilizer adoption, and improved soil-health analytics further lift consumption of premium formulations, prompting domestic and international producers to commission new specialty facilities and craft crop-specific portfolios. At the same time, revised Central Pollution Control Board norms force manufacturers to earmark sizeable capital for compliance upgrades, nudging smaller firms to explore mergers or exit options.
Key Report Takeaways
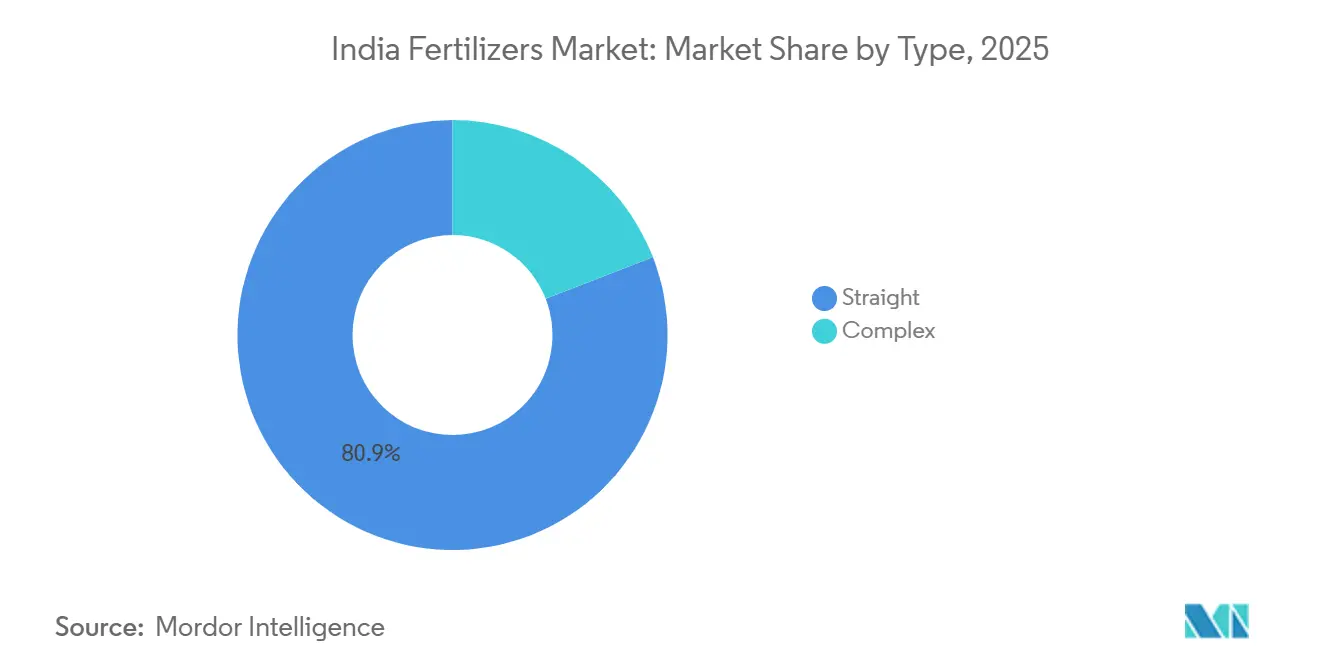
- By type, straight fertilizers held 80.9% of the India fertilizers market share in 2025, whereas complex grades are forecast to grow at a 6.9% CAGR through 2031.
- By form, conventional products captured 96.9% of the India fertilizers market size in 2025, while specialty formats are projected to expand at a 6.5% CAGR through 2031.
- By application mode, soil placement accounted for 97.1% of the India fertilizers market size in 2025, while fertigation is projected to grow at a 6.6% CAGR between 2026 and 2031.
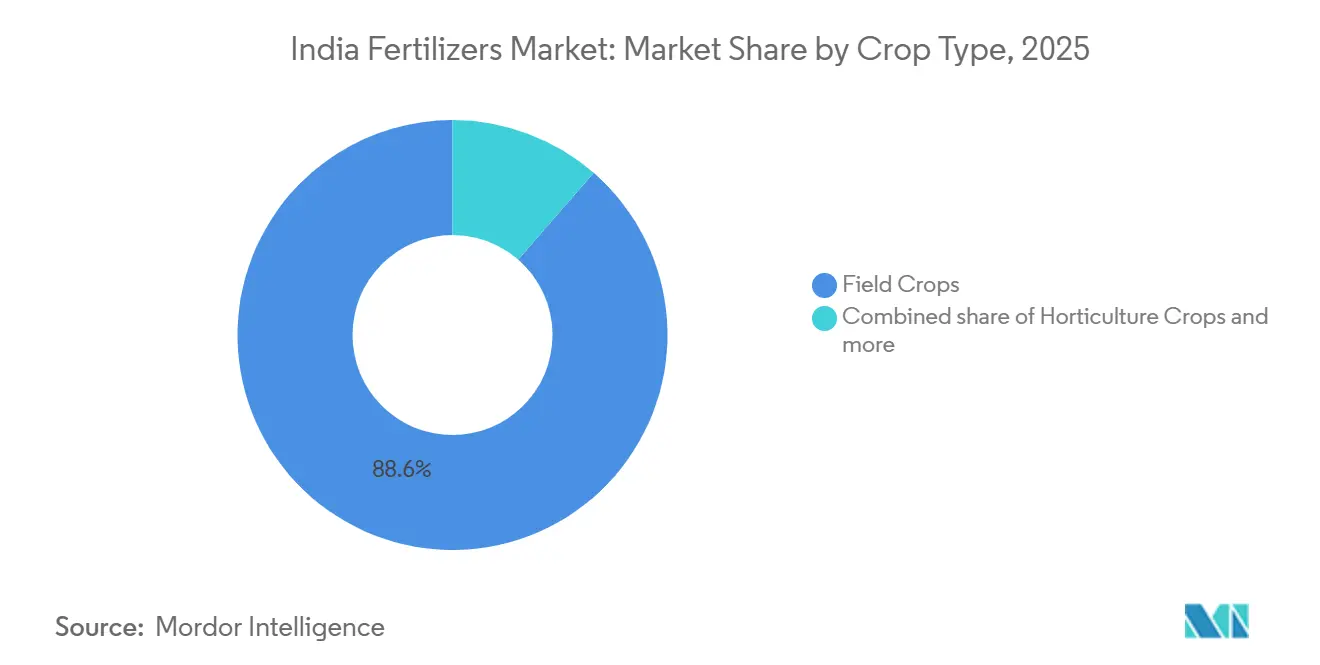
- By crop, field crops dominated with an 88.6% revenue share in 2025, while horticultural crops are projected to grow at a 6.4% CAGR through 2031.
Note: Market size and forecast figures in this report are generated using Mordor Intelligence’s proprietary estimation framework, updated with the latest available data and insights as of January 2026.
India Fertilizers Market Trends and Insights
Drivers Impact Analysis*
| Driver | (~) % Impact on CAGR Forecast | Geographic Relevance | Impact Timeline |
|---|---|---|---|
| Subsidy rationalization toward nutrient-based pricing | +1.8% | Maharashtra, Gujarat, Karnataka, national rollout | Medium term (2-4 years) |
| Rising adoption of drip irrigation and fertigation systems | +1.2% | Western and southern India, moving north | Long term (≥ 4 years) |
| Government push for balanced nutrient management | +1.5% | National via Krishi Vigyan Kendras | Medium term (2-4 years) |
| Growing availability of nano-urea and nano-DAP | +0.9% | IFFCO network states, expanding nationally | Short term (≤ 2 years) |
| Digitized soil-health card analytics enabling micro-dosing | +0.7% | Punjab, Haryana, Maharashtra | Medium term (2-4 years) |
| Corporate sugarcane sustainability programs | +0.4% | Maharashtra, Uttar Pradesh, Karnataka | Short term (≤ 2 years) |
| Source: Mordor Intelligence | |||


Subsidy rationalization toward nutrient-based pricing
The 2024 overhaul of India’s NBS framework moved the subsidy calculation from product-centric to nutrient-centric, correcting long-standing price distortions that once favored urea over balanced blends[1]Source: Ministry of Chemicals and Fertilizers, “Nutrient Based Subsidy Policy,” FERT.NIC.IN. During the 2024 kharif season, farmers responded with a 23% jump in complex fertilizer purchases as price parity encouraged switch-over from straight nitrogen. Enhanced quality norms now require specific micronutrient thresholds in NPK grades, nudging manufacturers into premium segments and attracting foreign entrants with fortified formulations. Adoption patterns remain uneven; Maharashtra and Gujarat already show double-digit gains, while urea-heavy belts across the Indo-Gangetic plains transition more slowly. Over the medium term, the policy is anticipated to steer the India fertilizers market toward value-added products, lift farm profitability through higher yields, and ease fiscal pressure by curbing excessive nitrogen use.
Rising adoption of drip irrigation and fertigation systems
Micro-irrigation coverage expanded in 2024 under the Pradhan Mantri Krishi Sinchayee Yojana, setting the stage for specialty, water-soluble fertilizer demand[2]Source: Ministry of Jal Shakti, “Pradhan Mantri Krishi Sinchayee Yojana Progress Report,” JALSHAKTI-DOWR.GOV.IN. The government’s 2030 target promises a structural change from broadcast application to low-volume, high-frequency fertigation. Karnataka and Gujarat accelerate horticulture-led installations. Field trials show 30-40% nutrient savings and 20-25% yield gains, fortifying the business case for fertigation. International suppliers such as Haifa Negev and ICL Group reacted by building local plants that package water-soluble NPK grades tailored for the India fertilizers market. Over the long term, fertigation’s precision-application advantage supports premium pricing, stabilizes farm input costs, and enriches soil health, collectively lifting demand for specialty inputs within the India fertilizers market.
Government push for balanced nutrient management
The Balanced Nutrient Management program, rolled out nationally in 2024, leverages Soil Health Card centers to deliver field-specific nutrient prescriptions, countering India’s skewed 8.2:2.9:1 N:P:K ratio toward the recommended 4:2:1. Mandated micronutrient fortification expands the market for zinc, boron, and sulfur, compelling producers to reformulate inventory and educate channel partners. States aligned procurement policies with BNM mandates, anchoring demand for complex grades instead of high-nitrogen urea. Early results show 15% higher soil organic carbon and 12% lower fertilizer intensity per output unit across pilot districts. These gains underpin farm-gate profitability, mitigate environmental runoff, and position balanced blends as an integral growth lever for the India fertilizers market.
Growing availability of nano-urea and nano-DAP
IFFCO (Indian Farmers Fertiliser Cooperative Limited) scaled nano-urea capacity, replacing one 45 kg conventional urea bag and delivering nitrogen use efficiency of up to 85%. The late-2024 launch of nano-DAP extends the nano platform into phosphorus management, addressing fixation issues in alkaline soils covering 60% of arable land. Regulatory clarity through Fertilizer Control Order amendments standardized nano-fertilizer quality and paved the way for additional market entrants. Government extension programs and dealer incentives propel near-term growth, while longer-term adoption will rely on demonstrated yield improvements and price affordability within the India fertilizers market.
Restraints Impact Analysis*
| Restraint | (~) % Impact on CAGR Forecast | Geographic Relevance | Impact Timeline |
|---|---|---|---|
| Delayed subsidy reimbursements straining working capital | -1.4% | National, pronounced at small manufacturers | Short term (≤ 2 years) |
| Volatility in imported ammonia and phosphoric acid prices | -1.1% | Coastal plants, import-dependent firms | Medium term (2-4 years) |
| Environmental compliance costs under revised Central Pollution Control Board (CPCB) norms | -0.8% | Gujarat, Maharashtra, Andhra Pradesh hubs | Long term (≥ 4 years) |
| Smallholder mistrust of specialty fertilizers beyond urea | -0.6% | Northern plains, traditional farming regions | Medium term (2-4 years) |
| Source: Mordor Intelligence | |||
Delayed subsidy reimbursements straining working capital
Manufacturers resorted to short-term loans at 12-15% interest to bridge cash gaps, squeezing margins and, in some cases, forcing production cuts. Liquidity stress rippled down the dealer chain, elongating credit terms and triggering input shortages during peak application periods. The government’s Direct Benefit Transfer initiative only partly alleviated bottlenecks because reimbursement validation still requires multilevel clearances. Smaller companies bear disproportionate pain, raising the likelihood of exits or takeovers and aggravating the consolidation trend inside the India fertilizers market.
Volatility in imported ammonia and phosphoric acid prices
Ammonia prices swung between USD 300-650 per metric ton in 2024 amid energy upheavals, while phosphoric acid quotations moved 40% during the year[3]Source: Indian Petrochemicals Corporation Limited, “Raw Material Price Analysis,” IPCL.CO.IN. Currency depreciation added 8-12% to import bills. Spot purchases frequently override long-term contract volumes when suppliers invoke force-majeure clauses, exposing processors to unplanned cost spikes. Margin erosion encourages frequent retail price revisions, distorts channel planning, and clouds demand visibility for the India fertilizers market. The government’s plan to develop strategic reserves for critical raw materials remains conceptual due to high infrastructure costs, leaving manufacturers vulnerable through the medium term.
*Our forecasts treat driver/restraint impacts as directional, not additive. The impact forecasts reflect baseline growth, mix effects, and variable interactions.
Segment Analysis
By Type: Straight fertilizers remain foundational, complex grades accelerate
Straight fertilizers controlled 80.9% of 2025 revenue in the India fertilizers market, with urea alone contributing roughly 65% of segment shipments. Urea’s entrenched subsidy status, broad dealer footprint, and familiarity among farmers cement its lead. Micronutrient straights, such as zinc sulfate, posted impressive CAGRs due to widespread deficiency mapping. Complex fertilizers, though smaller in share, outpace the market with a 6.9% CAGR through 2031, underpinned by NBS parity that narrows the cost gap and by quality mandates requiring micronutrient enrichment.
Complex grades benefit from simplified logistics and balanced nutrient delivery, allowing farmers to match soil prescriptions without juggling multiple products. Manufacturers leverage integrated facilities to swing between grades and hedge price volatility in raw materials. With BNM driving balanced nutrition, demand for 10-26-26, 12-32-16, and 20-20-0 variants rises. The India fertilizers market for complex formulas is forecast to grow steadily as policy shifts and demonstration results demonstrate agronomic gains.


By Form: Conventional dominate, specialty formats drive market
Conventional granules commanded 96.9% of 2025 sales, yet specialty categories represent the momentum pocket of the India fertilizers market, with a 6.5% CAGR through 2031. Water-soluble fertilizers lead specialty uptake in capital-intensive horticulture and protected cultivation. Controlled-release and slow-release urea, while costlier, promise 25-30% efficiency improvements that attract large growers. Specialty penetration reaches 15-20% in progressive states, compared to sub-5% levels in weaker extension states.
Conventional granules will maintain a significant share of the market given rice and wheat's reliance on broadcast practices. Still, environmental tightening and subsidy realignments will progressively tilt value toward specialty lines with higher growth in the forecast period. Companies bundle agronomy services with specialty products, reinforcing customer loyalty and buttressing margins inside the India fertilizers market.
By Application Mode: Soil placement still reigns, fertigation scales rapidly
Soil application accounted for 97.1% of shipments in 2025, reflecting India's decades-old broadcast application practices. However, fertigation is anticipated to grow at the fastest rate, registering a 6.6% CAGR through 2031 as drip irrigation networks expand and growers realize nutrient savings. Foliar feeds, although a small slice of demand, are gaining traction in high-value fruit and vegetable segments where rapid micronutrient correction is essential. Adoption variance is wide: fertigation penetrates 30% of vineyards but less than 2% of cereals.
Soil placement is evolving through deep placement briquettes and precision injectors, reducing volatilization losses and nudging nitrogen efficiency upward. Equipment compatibility and a reliable water supply remain preconditions for fertigation. With micro-irrigation targets ambitious, fertigation volumes in the India fertilizers market will expand in parallel, compelling manufacturers to refine liquid and water-soluble offerings.
By Crop Type: Field crops dominate in volume, horticulture leads incremental growth
Field crops secured an 88.6% revenue share in 2025, underpinned by rice and wheat, which collectively consume more than half of the country's fertilizer output. High application rates of 120–150 kg of nitrogen per hectare are typical of these intensive production systems. However, horticultural crops are the fastest-growing segment, projected to register a 6.4% CAGR through 2031. Export-oriented fruit sectors such as grapes, pomegranates, and mangoes are among the earliest adopters of controlled-release fertilizers and foliar nutrition programs.
The turf and ornamental segment remains relatively small but offers attractive opportunities for specialty fertilizer suppliers serving urban landscaping and golf course markets. As farm income diversification accelerates and consumer demand shifts toward fruits and vegetables, horticultural production is anticipated to absorb a disproportionate share of specialty inputs, supporting value growth in the India fertilizers market.
Geography Analysis
Maharashtra, Uttar Pradesh, and Punjab make impressive contributions in the India fertilizers market reflecting high cropping intensity and irrigation coverage. Northern plains record the heaviest per-hectare use at 180-220 kg owing to rice-wheat rotations and assured water supply. Southern states, Karnataka, Andhra Pradesh, Tamil Nadu are forecast to expand on the back of horticulture and fertigation surge. Emerging states such as Odisha, Chhattisgarh, and Jharkhand show modest growth potential, driven by irrigation upgrades and crop diversification programs.
Western India, especially Gujarat and Maharashtra, leads specialty penetration with water-soluble products capturing 12-15% of local demand. Coastal manufacturing hubs in Gujarat, Andhra Pradesh, and Tamil Nadu benefit from port proximity for ammonia and phosphoric acid imports, influencing regional supply economics within the India fertilizers market.
Eastern India, despite accounting for a quarter of cultivated land, consumes less fertilizers because of rain-fed conditions and lower input intensity. Government programs aimed at irrigation and balanced nutrition can unlock sizable latent demand. Environmental regulations, meanwhile, are prompting capacity shifts toward coastal zones with better raw-material logistics, reshaping the geographic production footprint of the India fertilizers market.
Competitive Landscape
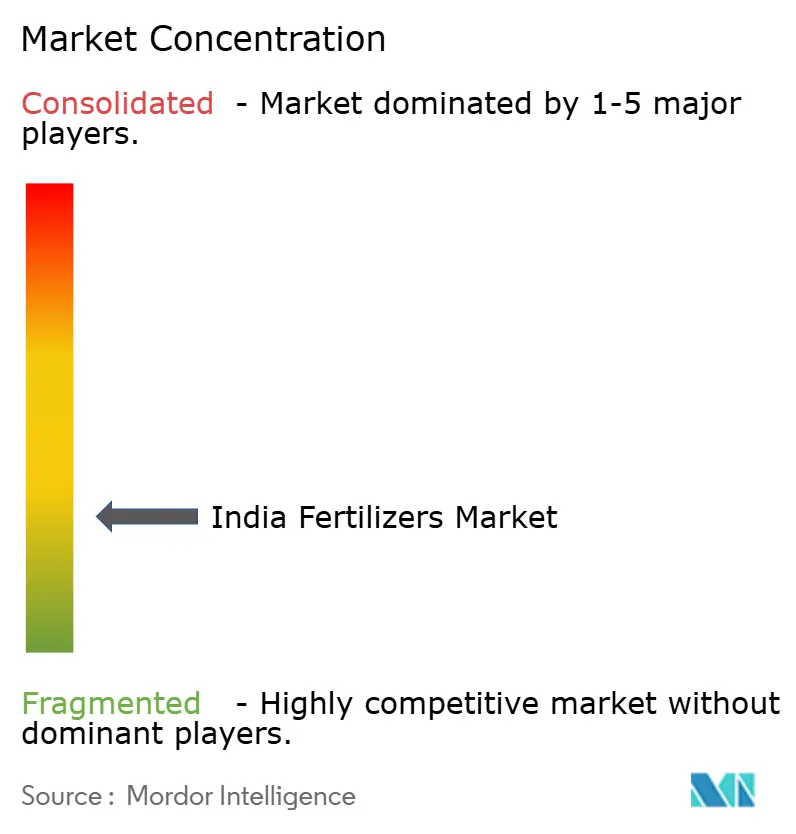
The top five producers together held only a minor share in 2024, underscoring fragmentation in the India fertilizers market. State enterprises such as National Fertilizers Limited and Rashtriya Chemicals and Fertilizers leverage policy backing and vast dealer networks. Private majors like Chambal Fertilizers and Coromandel International emphasize operational efficiency and Specialty R&D portfolios. Foreign players such as ICL Group and Yara International deploy localized blending sites to trim import reliance and quicken response times.
Working-capital stress caused by subsidy lags favors cash-rich, integrated entities capable of weathering lengthy receivable cycles. Technology is another separator: IFFCO’s nano platform delivers logistics and efficacy advantages, while Deepak Fertilizers pushes water-soluble and customized blends.
Compliance costs under CPCB norms accelerate attrition among smaller firms, offering acquisition prospects for larger contenders seeking footprint expansion. Consequently, consolidation momentum is likely to intensify, elevating concentration metrics in the India fertilizers market over the next five years.
India Fertilizers Industry Leaders
Chambal Fertilizers & Chemicals Ltd
Coromandel International Ltd.
ICL Group Ltd
Indian Farmers Fertiliser Cooperative Limited
National Fertilizers Ltd
- *Disclaimer: Major Players sorted in no particular order

Recent Industry Developments
- August 2025: After seven years of research, the Ministry of Mines has successfully developed its first indigenous water-soluble fertilizer technology. This achievement, crafted using Indian raw materials and designed plants, signals a potential shift for the country. It could transition from being reliant on imports to emerging as a dominant exporter in the realm of specialty fertilizers.
- May 2025: IFFCO has ramped up its production of nano-fertilizers by launching two new Nano DAP Liquid plants in Uttar Pradesh. Situated in Aonla (Bareilly district) and Phulpur (Prayagraj district), both plants are set to churn out 2 lakh bottles (each 500 ml) daily, significantly boosting the cooperative's advanced fertilizer output.
- July 2025: Oil India Ltd. has teamed up with the Assam government to set up a new fertilizer plant, leading to the formation of Assam Valley Fertilizer and Chemical Co. Ltd. (AVFCCL). Other stakeholders in AVFCCL include National Fertilizers Limited (NFL), Hindustan Urvarak & Rasayan Limited (HURL), and Brahmaputra Valley Fertilizer Corporation Limited (BVFCL). Notably, Oil India holds an 18% stake in this venture, underscoring its commitment. This collaboration is poised to enhance domestic fertilizer production in the region.


India Fertilizers Market Report Scope
Complex, Straight are covered as segments by Type. Conventional, Speciality are covered as segments by Form. Fertigation, Foliar, Soil are covered as segments by Application Mode. Field Crops, Horticultural Crops, Turf & Ornamental are covered as segments by Crop Type.Type
| Complex | ||
| Straight | Micronutrients | Boron |
| Copper | ||
| Iron | ||
| Manganese | ||
| Molybdenum | ||
| Zinc | ||
| Others | ||
| Nitrogenous | Urea | |
| Others | ||
| Phosphatic | DAP | |
| MAP | ||
| SSP | ||
| Others | ||
| Potassic | MoP | |
| Secondary Macronutrients | Calcium | |
| Magnesium | ||
| Sulfur | ||
Form
| Conventional | |
| Speciality | CRF |
| Liquid Fertilizer | |
| SRF | |
| Water Soluble |
Application Mode
| Fertigation |
| Foliar |
| Soil |
Crop Type
| Field Crops |
| Horticultural Crops |
| Turf and Ornamental |
| Type | Complex | ||
| Straight | Micronutrients | Boron | |
| Copper | |||
| Iron | |||
| Manganese | |||
| Molybdenum | |||
| Zinc | |||
| Others | |||
| Nitrogenous | Urea | ||
| Others | |||
| Phosphatic | DAP | ||
| MAP | |||
| SSP | |||
| Others | |||
| Potassic | MoP | ||
| Secondary Macronutrients | Calcium | ||
| Magnesium | |||
| Sulfur | |||
| Form | Conventional | ||
| Speciality | CRF | ||
| Liquid Fertilizer | |||
| SRF | |||
| Water Soluble | |||
| Application Mode | Fertigation | ||
| Foliar | |||
| Soil | |||
| Crop Type | Field Crops | ||
| Horticultural Crops | |||
| Turf and Ornamental | |||


Market Definition
- MARKET ESTIMATION LEVEL - Market Estimations for various types of fertilizers has been done at the product-level and not at the nutrient-level.
- NUTRIENT TYPES COVERED - Primary Nutrients: N, P and K, Secondary Macronutrients: Ca, Mg and S, Micronutients: Zn, Mn, Cu, Fe, Mo, B, and Others
- AVERAGE NUTRIENT APPLICATION RATE - This refers to the average volume of nutrient consumed per hectare of farmland in each country.
- CROP TYPES COVERED - Field Crops: Cereals, Pulses, Oilseeds, and Fiber Crops Horticulture: Fruits, Vegetables, Plantation Crops and Spices, Turf Grass and Ornamentals
| Keyword | Definition |
|---|---|
| Fertilizer | Chemical substance applied to crops to ensure nutritional requirements, available in various forms such as granules, powders, liquid, water soluble, etc. |
| Specialty Fertilizer | Used for enhanced efficiency and nutrient availability applied through soil, foliar, and fertigation. Includes CRF, SRF, liquid fertilizer, and water soluble fertilizers. |
| Controlled-Release Fertilizers (CRF) | Coated with materials such as polymer, polymer-sulfur, and other materials such as resins to ensure nutrient availability to the crop for its entire life cycle. |
| Slow-Release Fertilizers (SRF) | Coated with materials such as sulfur, neem, etc., to ensure nutrient availability to the crop for a longer period. |
| Foliar Fertilizers | Consist of both liquid and water soluble fertilizers applied through foliar application. |
| Water-Soluble Fertilizers | Available in various forms including liquid, powder, etc., used in foliar and fertigation mode of fertilizer application. |
| Fertigation | Fertilizers applied through different irrigation systems such as drip irrigation, micro irrigation, sprinkler irrigation, etc. |
| Anhydrous Ammonia | Used as fertilizer, directly injected into the soil, available in gaseous liquid form. |
| Single Super Phosphate (SSP) | Phosphorus fertilizer containing only phosphorus which has lesser than or equal to 35%. |
| Triple Super Phosphate (TSP) | Phosphorus fertilizer containing only phosphorus greater than 35%. |
| Enhanced Efficiency Fertilizers | Fertilizers coated or treated with additional layers of various ingredients to make it more efficient compared to other fertilizers. |
| Conventional Fertilizer | Fertilizers applied to crops through traditional methods including broadcasting, row placement, ploughing soil placement, etc. |
| Chelated Micronutrients | Micronutrient fertilizers coated with chelating agents such as EDTA, EDDHA, DTPA, HEDTA, etc. |
| Liquid Fertilizers | Available in liquid form, majorly used for application of fertilizers to crops through foliar and fertigation. |


Research Methodology
Mordor Intelligence follows a four-step methodology in all our reports.
- Step-1: IDENTIFY KEY VARIABLES: In order to build a robust forecasting methodology, the variables and factors identified in Step-1 are tested against available historical market numbers. Through an iterative process, the variables required for market forecast are set and the model is built on the basis of these variables.
- Step-2: Build a Market Model: Market-size estimations for the forecast years are in nominal terms. Inflation is not a part of the pricing, and the average selling price (ASP) is kept constant throughout the forecast period for each country.
- Step-3: Validate and Finalize: In this important step, all market numbers, variables and analyst calls are validated through an extensive network of primary research experts from the market studied. The respondents are selected across levels and functions to generate a holistic picture of the market studied.
- Step-4: Research Outputs: Syndicated Reports, Custom Consulting Assignments, Databases & Subscription Platforms


