Market Overview
| Study Period | 2021 - 2031 |
|---|---|
| Market Size (2026) | USD 3.20 Billion |
| Market Size (2031) | USD 4.71 Billion |
| Growth Rate (2026 - 2031) | 8.02% CAGR |
| Fastest Growing Market | Asia-Pacific |
| Largest Market | Asia-Pacific |
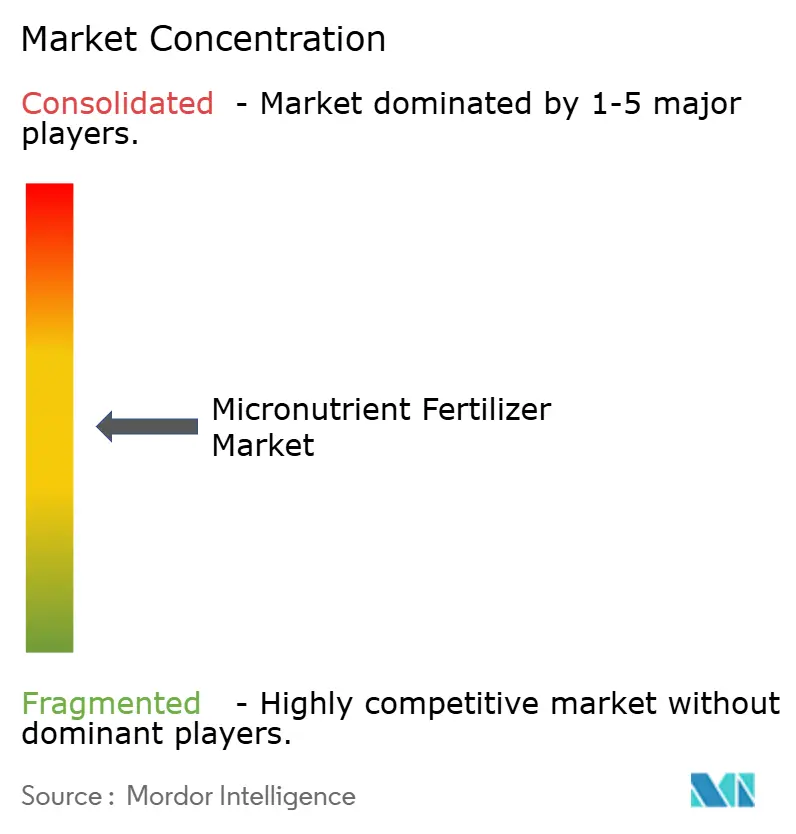
| Market Concentration | Medium |
Major Players*Disclaimer: Major Players sorted in no particular order Image © Mordor Intelligence. Reuse requires attribution under CC BY 4.0. | |
Micronutrient Fertilizer Market Analysis by Mordor Intelligence
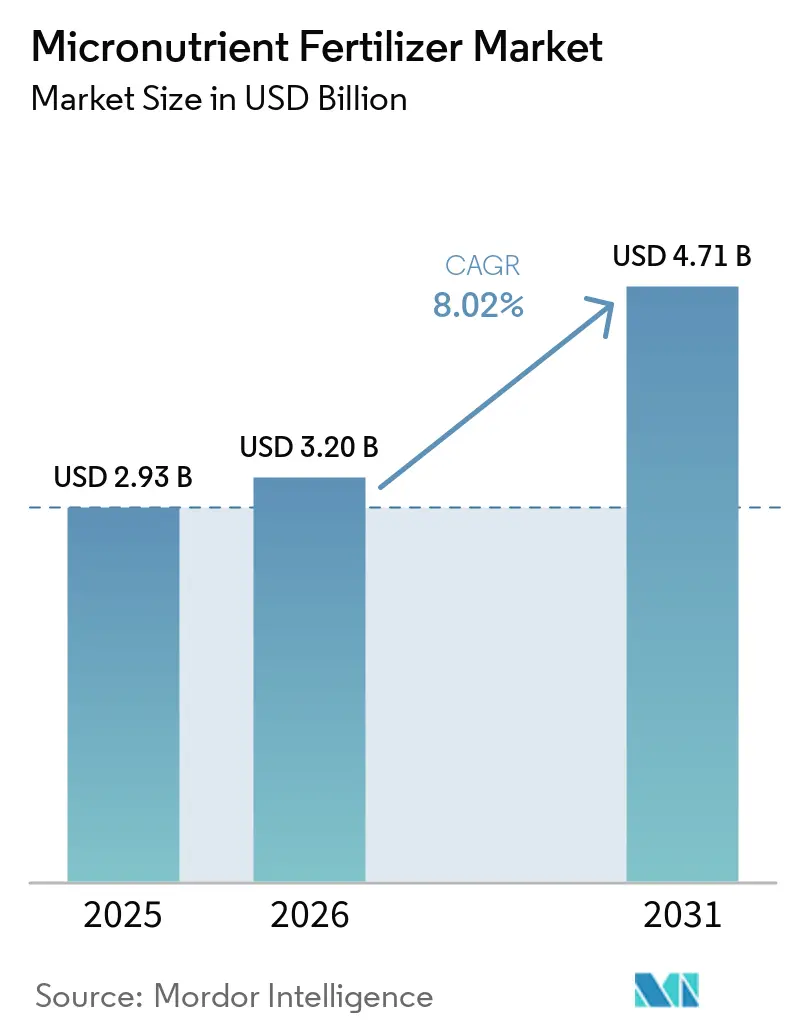
The micronutrient fertilizer market size was valued at USD 2.93 billion in 2025 and is projected to grow from USD 3.20 billion in 2026 to USD 4.71 billion by 2031, registering a CAGR of 8.0% during the forecast period. Soil nutrient depletion across intensive cereal belts and the shift toward high-value horticulture are the primary drivers of demand acceleration, with copper and zinc deficiencies now limiting grain yields in several wheat-rice rotations despite high NPK use. The adoption of precision application equipment, widespread subsidy programs in South and Southeast Asia, and bio-fortification mandates targeting hidden hunger are broadening the commercial opportunity spectrum for suppliers while simultaneously fostering premium segments, such as nano-chelates and controlled-release granules. On the supply side, cadmium limits under the European Union Fertilizing Products Regulation 2019/1009 are driving a pivot from low-grade sulfates toward chelated variants, raising formulation costs yet widening margins for producers able to guarantee contaminant-free inputs. Headline risks center on ore price volatility, particularly for zinc and copper concentrates, and ongoing agronomic knowledge gaps in Sub-Saharan Africa that hinder adoption.
Key Report Takeaways
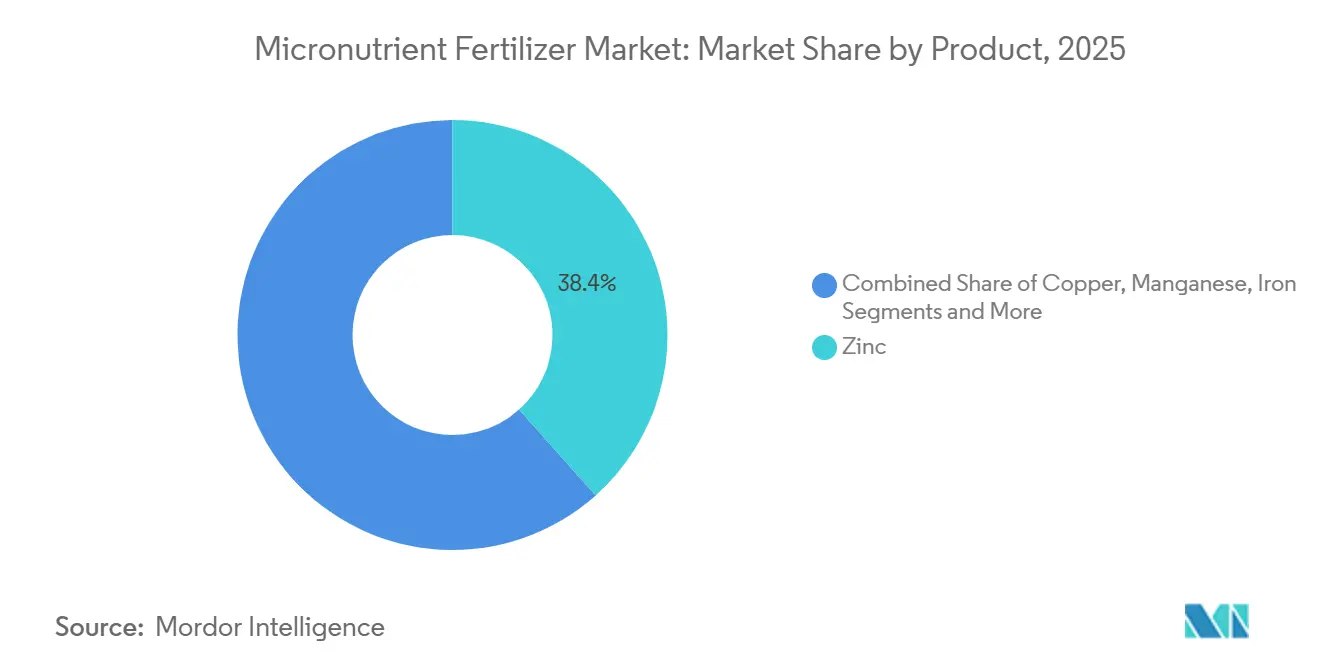
- By product, zinc led the market with a 38.4% share in 2025, while boron emerged as the fastest-growing segment, projected to expand at a CAGR of 7.5% from 2026 to 2031.
- By application mode, foliar application accounted for the largest micronutrient fertilizer market size in 2025, representing 49.5% of the market, and is forecast to maintain growth leadership with a CAGR of 8.8% through 2031.
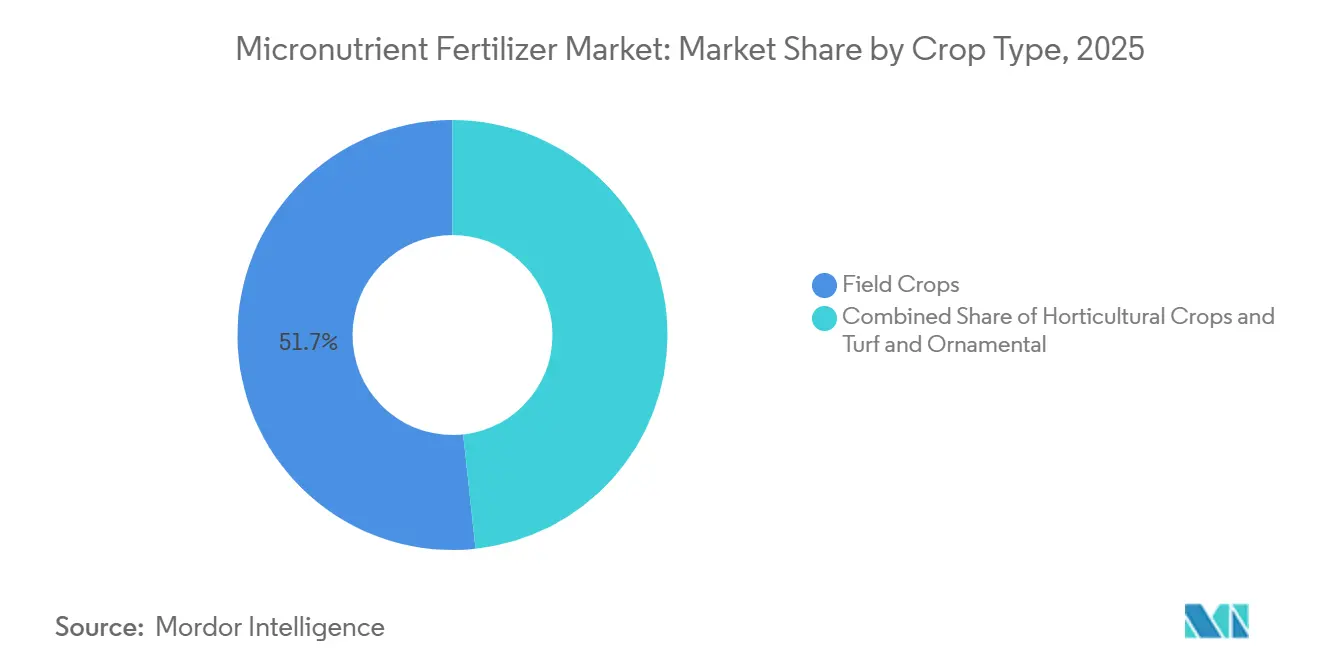
- By crop type, field crops captured the highest market share at 51.7% in 2025, whereas horticultural crops are anticipated to record the strongest growth, advancing at a CAGR of 8.2% during 2026–2031.
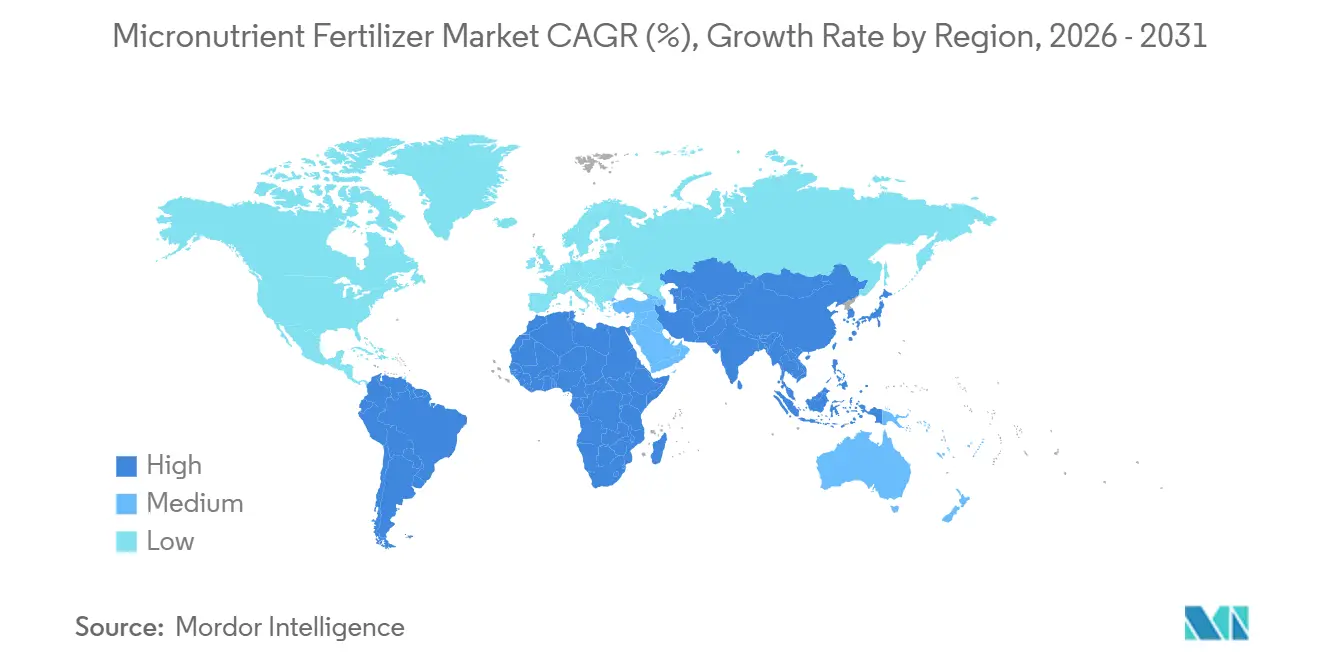
- By geography, Asia-Pacific dominated the micronutrient fertilizer market share with 39.1% in 2025 and is projected to remain the fastest-growing regional market, registering a CAGR of 8.9% from 2026 to 2031.
Note: Market size and forecast figures in this report are generated using Mordor Intelligence’s proprietary estimation framework, updated with the latest available data and insights as of January 2026.
Global Micronutrient Fertilizer Market Trends and Insights
Drivers Impact Analysis*
| Driver | (~) % Impact on CAGR Forecast | Geographic Relevance | Impact Timeline |
|---|---|---|---|
| Widespread soil micronutrient deficiencies in intensive cereal belts | + 1.8% | Indo-Gangetic Plain, North China Plain, Brazilian Cerrado | Long term (≥ 4 years) |
| Rapid adoption of precision-application equipment | + 1.5% | North America, Europe, Asia-Pacific | Medium term (2-4 years) |
| Expansion of high-value horticulture under protected cultivation | + 1.2% | Spain-Netherlands corridor, Middle East and Africa, Asia-Pacific | Medium term (2-4 years) |
| Government micronutrient subsidy programs in South and Southeast Asia | + 1.0% | India, Bangladesh, Indonesia, Pakistan, Nigeria pilot | Short term (≤ 2 years) |
| Bio-fortification initiatives against hidden hunger | + 0.8% | India, Philippines, Ethiopia, Kenya, Brazil | Long term (≥ 4 years) |
| Nanochelated formulations offering higher uptake efficiency | + 0.5% | Early adopters in North America, Europe, Asia-Pacific | Long term (≥ 4 years) |
| Source: Mordor Intelligence | |||


Widespread Soil Micronutrient Deficiencies in Intensive Cereal Belts
India’s 2024 soil health card audit revealed zinc deficiency in 49% of districts, a seven percentage point increase since 2019, while boron shortfalls affected one-third of sampled plots [1]Indian Council of Agricultural Research, “Soil Health Card Database 2024,” icar.org.in. Wheat yields in China’s Henan province stagnated at 5.8 metric tons per ha from 2020 to 2024, even as nitrogen use climbed 12% because trace-element co-factors remained limiting. Indonesia’s Ministry of Agriculture distributed 120,000 metric tons of zinc-fortified NPK in 2024, boosting paddy yields by 8% in pilot plots. The underlying driver is the ongoing decline in organic matter, which reduces natural chelation and ensures structural demand.
Rapid Adoption of Precision-Application Equipment
GPS-enabled applicators reduced zinc sulfate use by 22% per hectare across 340 European farms in 2024, while increasing leaf zinc concentrations by 15%. John Deere noted that 18% of 2024 sprayer sales included micronutrient injectors, up from 11% in 2022. Drone-guided foliar boron in Canadian canola increased seed set by 9%. These gains simultaneously lower over-application risks, an emerging environmental compliance need flagged by the Commonwealth Scientific and Industrial Research Organisation (CSIRO).
Expansion of High-Value Horticulture Under Protected Cultivation
Almería’s greenhouse area reached 31,000 hectares in 2024, consuming 4,200 metric tons of chelated iron and manganese annually, a 19% increase since 2022. Saudi Arabia installed 2,400 hectares of climate-controlled greenhouses in 2024 and now injects EDDHA-iron at a rate of 0.5 g per m³ in the nutrient solution. Mexico’s Sinaloa added 1,100 hectares of greenhouses supplying winter tomatoes to North America, relying on weekly foliar applications of zinc and boron to maintain firmness during shipping. Coco-coir and perlite substrates lack inherent trace elements, resulting in a threefold increase in per-hectare micronutrient demand compared with field soil systems.
Government Micronutrient Subsidy Programs in South and Southeast Asia
India’s Nutrient-Based Subsidy disbursed USD 420 million in 2024 to zinc and iron makers, dropping retail prices 35% and lifting volumes 28% year on year. Bangladesh supplied 18,000 metric tons of subsidized boron and zinc in 2024. Indonesia mandated zinc-fortified urea for 1.2 million rice farmers, and Pakistan’s Punjab offered interest-free micronutrient credit to 45,000 cotton growers. The programs possess political durability because they align with national nutrition objectives.
Restraints Impact Analysis*
| Restraint | (~) % Impact on CAGR Forecast | Geographic Relevance | Impact Timeline |
|---|---|---|---|
| High price volatility of key mineral ores | -0.9% | Import-dependent Middle East and Africa, South America | Short term (≤ 2 years) |
| Low farmer awareness in Sub-Saharan Africa and parts of South America | -0.7% | Sub-Saharan belt, Andean nations | Medium term (2-4 years) |
| Antagonistic interactions in multi-nutrient blends | -0.4% | Global bulk-blend markets | Medium term (2-4 years) |
| Stricter limits on heavy-metal contaminants | -0.5% | Europe, China, selective North American states | Long term (≥ 4 years) |
| Source: Mordor Intelligence | |||
High Price Volatility of Key Mineral Ores
Zinc sulfate traded between USD 1,200 and USD 1,680 per metric ton in 2024, compressing formulator margins that average 8-12%. Copper sulfate reached USD 2,400 per metric ton in mid-2024, causing some South American soybean growers to defer foliar copper applications, which resulted in a 6% decline in regional micronutrient volumes in H1 2024. Mosaic hedged 40% of its zinc sulfate inputs to cushion volatility.
Low Farmer Awareness in Sub-Saharan Africa and Parts of South America
Only 18% of surveyed smallholders in Kenya, Tanzania, and Ethiopia were able to diagnose maize zinc deficiency in 2024 [2]Alliance for a Green Revolution in Africa, “Farmer Awareness Survey 2024,” agra.org. Nigeria found that 72% of rice farmers in Kano and Kaduna used only urea and NPK despite 55% soil zinc deficiency. In Peru’s Andean highlands, 65% of potato growers had never heard of boron fertilizers, even though deficiency caused 20% tuber loss. Credit gaps reinforce the knowledge deficit.
*Our forecasts treat driver/restraint impacts as directional, not additive. The impact forecasts reflect baseline growth, mix effects, and variable interactions.
Segment Analysis
By Product: Zinc Dominates, Boron Surges in Water-Scarce Zones
Zinc accounted for the largest share of the micronutrient fertilizer market, representing 38.4% in 2025. This dominance is attributed to its essential role in plant growth, enzyme activation, and yield improvement across major field and horticultural crops. Zinc-based fertilizers are widely adopted, particularly in regions with documented soil micronutrient deficiencies and intensive cropping systems. Market expansion is further supported by product innovations, including enhanced-efficiency formulations such as coated and chelated zinc products, which improve nutrient availability and uptake efficiency under diverse soil conditions.
Boron is projected to be the fastest-growing segment, with a 7.5% CAGR during 2026-2031. This growth is driven by the increasing cultivation of oilseeds, fruits, vegetables, and other high-value crops, where boron plays a critical role in flowering, fruit set, pollination, and overall crop quality. The rising adoption of precision nutrient management practices and fertigation systems is further boosting demand for boron fertilizers. Additionally, growing awareness of boron deficiencies and their impact on crop productivity is encouraging the use of boron-based products in both developed and emerging agricultural markets.


By Application Mode: Foliar Application Leads and Accelerates Growth
Foliar application accounted for the largest share of the micronutrient fertilizer market, representing 49.5% in 2025. It is also projected to be the fastest-growing application method, with a CAGR of 8.8% during 2026-2031. This method's strong position stems from its ability to deliver micronutrients directly to plant tissues, enabling rapid correction of nutrient deficiencies and enhancing nutrient-use efficiency. Foliar application is widely utilized in fruits, vegetables, greenhouse crops, and other high-value agricultural systems where optimizing crop quality and yield is essential. The growing use of water-soluble and chelated micronutrient formulations further supports its adoption in precision agriculture and protected cultivation environments.
Soil application remains a significant delivery method, particularly in broad-acre agriculture for cereals, oilseeds, and other field crops, where micronutrients are applied alongside conventional fertilizer programs. Fertigation is also gaining momentum as drip irrigation networks expand globally, enabling growers to integrate irrigation and nutrient delivery into a single system. The increasing adoption of precision farming practices, combined with rising investments in water-efficient agriculture, is driving demand for fertigation-based micronutrient application, especially in horticultural and greenhouse production systems.
By Crop Type: Field Crops Lead While Horticulture Drives Growth
Field crops accounted for the largest share of the micronutrient fertilizer market, at 51.7% in 2025. This dominance is attributed to the extensive cultivation of cereals, oilseeds, and other staple crops, which require balanced micronutrient applications to optimize productivity. There is particularly strong demand for zinc, iron, manganese, and boron fertilizers, as growers increasingly address soil nutrient deficiencies to enhance crop yields and nutrient-use efficiency. The adoption of precision nutrient management practices in large-scale farming operations continues to drive demand for micronutrient fertilizers in this segment.
Horticultural crops are anticipated to be the fastest-growing segment, with a projected CAGR of 8.2% during 2026-2031. This growth is fueled by the rising production of fruits, vegetables, nuts, and other high-value crops that require precise micronutrient management to improve quality, appearance, shelf life, and overall yield. The expansion of greenhouse cultivation, protected agriculture, and fertigation-based production systems further supports the adoption of micronutrient fertilizers. As growers prioritize maximizing crop quality and meeting premium market standards, horticultural crops are projected to remain a significant growth driver for the micronutrient fertilizer market.
Geography Analysis
In 2025, the Asia-Pacific region accounted for the largest share of the micronutrient fertilizer market at 39.1%. It is also projected to be the fastest-growing regional market, with a CAGR of 8.9% during the forecast period of 2026–2031. This growth is driven by the extensive agricultural production systems across China, India, and Southeast Asian countries. The increasing focus on balanced nutrient management and addressing micronutrient deficiencies is a key factor boosting demand. Additionally, the rising adoption of specialty fertilizers, precision agriculture practices, and high-value crop cultivation further strengthens the market position in this region.
North America and Europe are considered mature yet strategically significant markets for micronutrient fertilizers. The demand in these regions is supported by the widespread use of precision farming technologies, advanced soil testing methods, and chelated micronutrient products. Furthermore, regulatory emphasis on nutrient-use efficiency and sustainable agricultural practices is encouraging farmers to implement targeted micronutrient application programs for both field and horticultural crops.
The Middle East and Africa, along with South America, are emerging as key growth markets due to agricultural modernization and the expansion of commercial farming activities. Investments in irrigation infrastructure, improved fertilizer accessibility, and productivity enhancement programs are driving the adoption of micronutrient fertilizers in these regions. In South America, the increasing cultivation of crops such as soybean, corn, fruits, and vegetables supports market growth. Meanwhile, countries in the Middle East and Africa are focusing on improving crop productivity through balanced plant nutrition strategies.

Competitive Landscape
The top five suppliers, Yara International ASA, The Mosaic Company, ICL Group Ltd, K+S Aktiengesellschaft, and Coromandel International Ltd held a 57.4% collective share in 2024, signaling moderate concentration. Yara and Mosaic enjoy vertical integration from ore to blends, insulating them from raw material swings and supporting their leadership in the micronutrient fertilizer market. ICL and Coromandel focus on chelated specialties for fertigation and foliar niches, while K+S differentiates with magnesium plus micronutrient blends. Smaller Brazilian and Turkish formulators co-package micronutrients with biologicals to circumvent EU heavy-metal caps and appeal to regenerative farming practices.
Technology differentiation is sharpening competitive edges. Haifa’s nano-chelated manganese halves correction time in citrus, enabling premium pricing. Patent filings for polymer-coated micronutrients increased by 22% in 2024, led by Mosaic and Koch Agronomic Services, highlighting the industry's migration toward controlled-release technology [4]United States Patent and Trademark Office, “Polymer-Coated Micronutrient Patent Filings 2024,” uspto.gov. Regulatory compliance investments widen barriers, especially in Europe, where cadmium limits demand for purified feedstocks.
White-space opportunities persist in Sub-Saharan Africa and Andean South America, where micronutrient penetration remains below 15% of arable land. Suppliers that bundle agronomic advisory with tailored formulations stand to gain share as awareness programs scale.
Micronutrient Fertilizer Industry Leaders
Coromandel International Ltd.
ICL Group Ltd
K+S Aktiengesellschaft
The Mosaic Company
Yara International ASA
- *Disclaimer: Major Players sorted in no particular order

Recent Industry Developments
- August 2024: ICL’s expanded partnership with AMP strengthens its presence in China’s rapidly growing market for water-soluble specialty fertilizers, driven by rising adoption of drip irrigation and high-value crops. This agreement positions ICL to meet the evolving needs of farmers with innovative, irrigation-focused nutrient solutions.
- June 2024: Coromandel International Ltd. opened a nano fertilizer plant at Kakinada, Andhra Pradesh, expanding its capacity for next-generation fertilizers, including nano-based formulations of micronutrients such as zinc and boron. The facility strengthens the company’s ability to serve high-value horticulture and fertigation markets.
- November 2023: K+S Aktiengesellschaft is investing EUR 35 million (USD 37 million) to lift annual EPSO Micro output at its Kassel, Germany plant by 25,000 metric tons. The upgrade targets growing demand from European oilseed rape and potato farmers for magnesium-rich micronutrient blends and is slated to begin operating in the third quarter of 2025.


Global Micronutrient Fertilizer Market Report Scope
Boron, Copper, Iron, Manganese, Molybdenum, Zinc, Others are covered as segments by Product. Fertigation, Foliar, Soil are covered as segments by Application Mode. Field Crops, Horticultural Crops, Turf & Ornamental are covered as segments by Crop Type. Asia-Pacific, Europe, Middle East & Africa, North America, South America are covered as segments by Region.By Product
| Boron |
| Copper |
| Iron |
| Manganese |
| Molybdenum |
| Zinc |
| Others |
By Application Mode
| Fertigation |
| Foliar |
| Soil |
By Crop Type
| Field Crops |
| Horticultural Crops |
| Turf and Ornamental |
By Geography
| Asia-Pacific | Australia |
| Bangladesh | |
| China | |
| India | |
| Indonesia | |
| Japan | |
| Pakistan | |
| Philippines | |
| Thailand | |
| Vietnam | |
| Rest of Asia-Pacific | |
| Europe | France |
| Germany | |
| Italy | |
| Netherlands | |
| Russia | |
| Spain | |
| Ukraine | |
| United Kingdom | |
| Rest of Europe | |
| Middle East And Africa | Nigeria |
| Saudi Arabia | |
| South Africa | |
| Turkey | |
| Rest of Middle East And Africa | |
| North America | Canada |
| Mexico | |
| United States | |
| Rest of North America | |
| South America | Argentina |
| Brazil | |
| Rest of South America |
| By Product | Boron | |
| Copper | ||
| Iron | ||
| Manganese | ||
| Molybdenum | ||
| Zinc | ||
| Others | ||
| By Application Mode | Fertigation | |
| Foliar | ||
| Soil | ||
| By Crop Type | Field Crops | |
| Horticultural Crops | ||
| Turf and Ornamental | ||
| By Geography | Asia-Pacific | Australia |
| Bangladesh | ||
| China | ||
| India | ||
| Indonesia | ||
| Japan | ||
| Pakistan | ||
| Philippines | ||
| Thailand | ||
| Vietnam | ||
| Rest of Asia-Pacific | ||
| Europe | France | |
| Germany | ||
| Italy | ||
| Netherlands | ||
| Russia | ||
| Spain | ||
| Ukraine | ||
| United Kingdom | ||
| Rest of Europe | ||
| Middle East And Africa | Nigeria | |
| Saudi Arabia | ||
| South Africa | ||
| Turkey | ||
| Rest of Middle East And Africa | ||
| North America | Canada | |
| Mexico | ||
| United States | ||
| Rest of North America | ||
| South America | Argentina | |
| Brazil | ||
| Rest of South America | ||


Market Definition
- MARKET ESTIMATION LEVEL - Market Estimations for various types of fertilizers has been done at the product-level and not at the nutrient-level.
- NUTRIENT TYPES COVERED - Micronutients: Zn, Mn, Cu, Fe, Mo, B, and Others
- AVERAGE NUTRIENT APPLICATION RATE - This refers to the average volume of nutrient consumed per hectare of farmland in each country.
- CROP TYPES COVERED - Field Crops: Cereals, Pulses, Oilseeds, and Fiber Crops Horticulture: Fruits, Vegetables, Plantation Crops and Spices, Turf Grass and Ornamentals
| Keyword | Definition |
|---|---|
| Fertilizer | Chemical substance applied to crops to ensure nutritional requirements, available in various forms such as granules, powders, liquid, water soluble, etc. |
| Specialty Fertilizer | Used for enhanced efficiency and nutrient availability applied through soil, foliar, and fertigation. Includes CRF, SRF, liquid fertilizer, and water soluble fertilizers. |
| Controlled-Release Fertilizers (CRF) | Coated with materials such as polymer, polymer-sulfur, and other materials such as resins to ensure nutrient availability to the crop for its entire life cycle. |
| Slow-Release Fertilizers (SRF) | Coated with materials such as sulfur, neem, etc., to ensure nutrient availability to the crop for a longer period. |
| Foliar Fertilizers | Consist of both liquid and water soluble fertilizers applied through foliar application. |
| Water-Soluble Fertilizers | Available in various forms including liquid, powder, etc., used in foliar and fertigation mode of fertilizer application. |
| Fertigation | Fertilizers applied through different irrigation systems such as drip irrigation, micro irrigation, sprinkler irrigation, etc. |
| Anhydrous Ammonia | Used as fertilizer, directly injected into the soil, available in gaseous liquid form. |
| Single Super Phosphate (SSP) | Phosphorus fertilizer containing only phosphorus which has lesser than or equal to 35%. |
| Triple Super Phosphate (TSP) | Phosphorus fertilizer containing only phosphorus greater than 35%. |
| Enhanced Efficiency Fertilizers | Fertilizers coated or treated with additional layers of various ingredients to make it more efficient compared to other fertilizers. |
| Conventional Fertilizer | Fertilizers applied to crops through traditional methods including broadcasting, row placement, ploughing soil placement, etc. |
| Chelated Micronutrients | Micronutrient fertilizers coated with chelating agents such as EDTA, EDDHA, DTPA, HEDTA, etc. |
| Liquid Fertilizers | Available in liquid form, majorly used for application of fertilizers to crops through foliar and fertigation. |


Research Methodology
Mordor Intelligence follows a four-step methodology in all our reports.
- Step-1: IDENTIFY KEY VARIABLES: In order to build a robust forecasting methodology, the variables and factors identified in Step-1 are tested against available historical market numbers. Through an iterative process, the variables required for market forecast are set and the model is built on the basis of these variables.
- Step-2: Build a Market Model: Market-size estimations for the forecast years are in nominal terms. Inflation is not a part of the pricing, and the average selling price (ASP) is kept constant throughout the forecast period for each country.
- Step-3: Validate and Finalize: In this important step, all market numbers, variables and analyst calls are validated through an extensive network of primary research experts from the market studied. The respondents are selected across levels and functions to generate a holistic picture of the market studied.
- Step-4: Research Outputs: Syndicated Reports, Custom Consulting Assignments, Databases & Subscription Platforms


