Organic Fertilizers Market Size and Share
Market Overview
| Study Period | 2021 - 2031 |
|---|---|
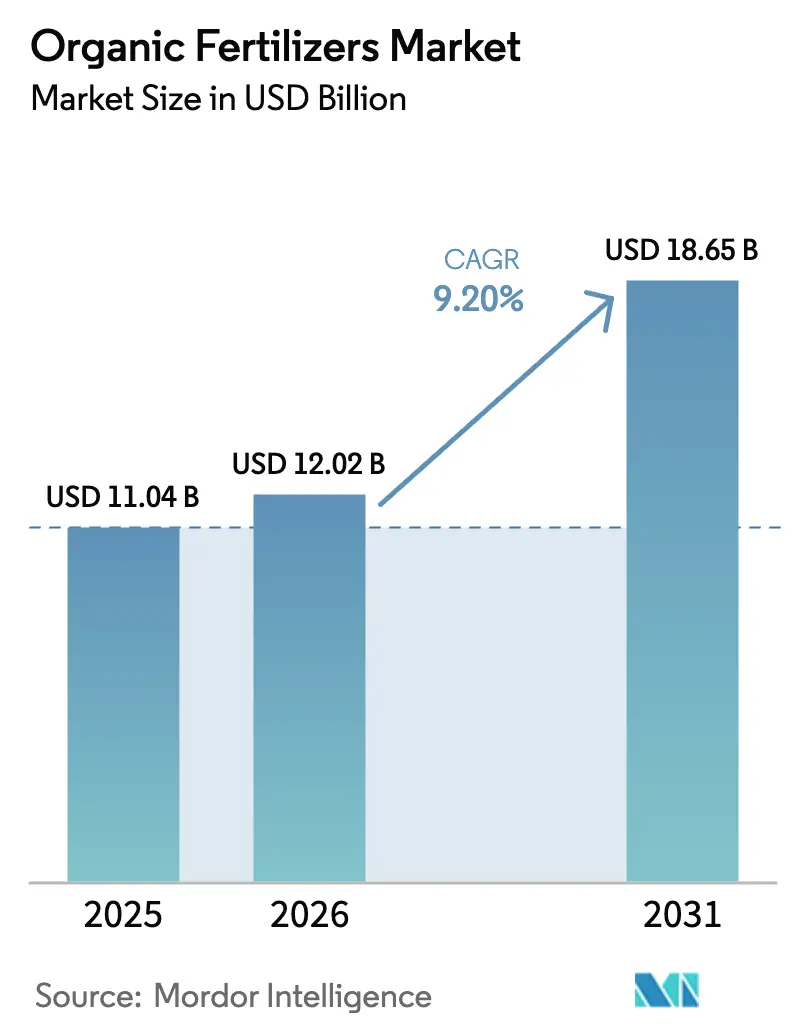
| Market Size (2026) | USD 12.02 Billion |
| Market Size (2031) | USD 18.65 Billion |
| Growth Rate (2026 - 2031) | 9.20% CAGR |
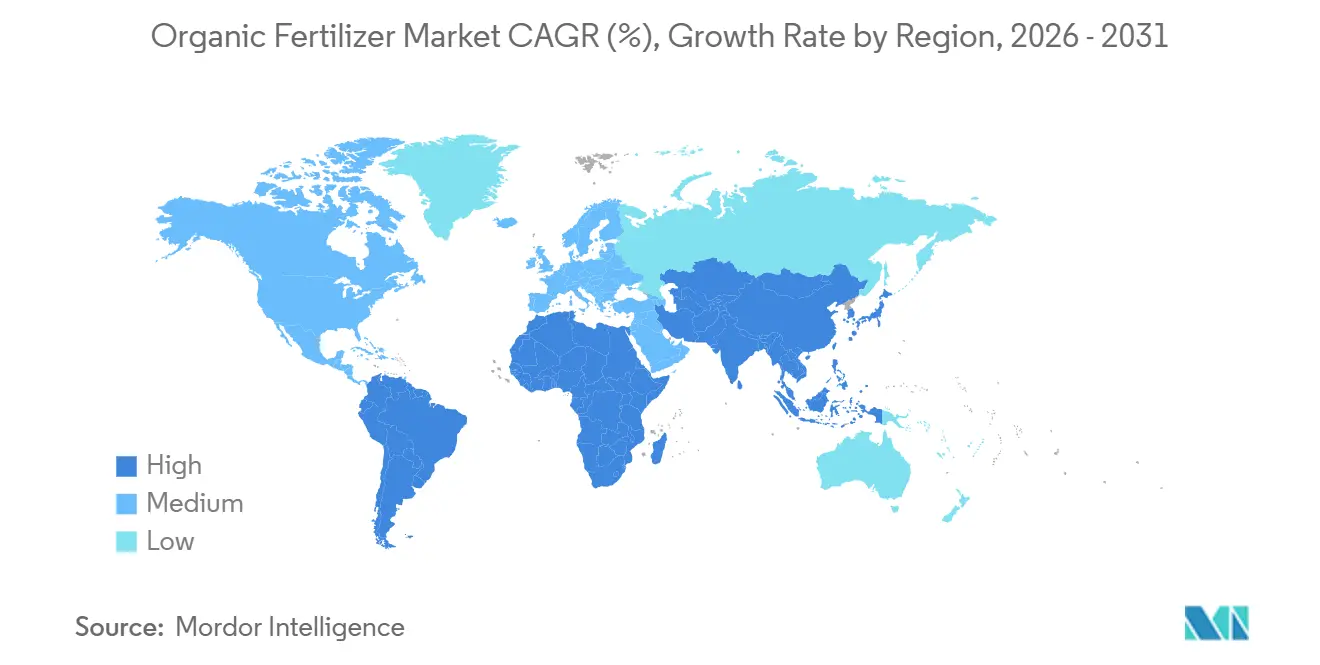
| Fastest Growing Market | North America |
| Largest Market | Europe |
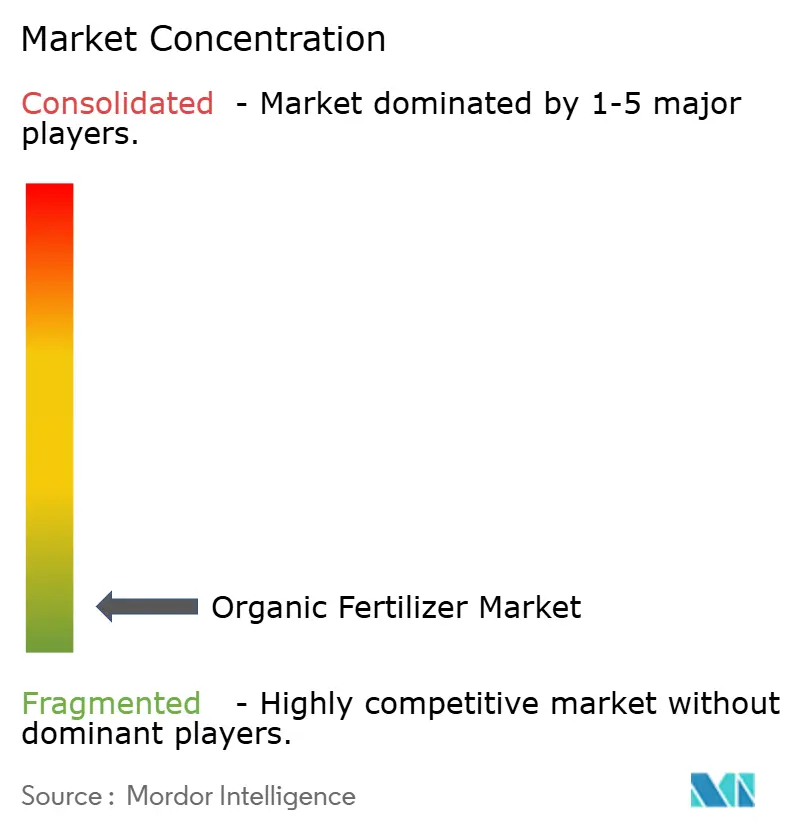
| Market Concentration | Low |
Major Players *Disclaimer: Major Players sorted in no particular order Image © Mordor Intelligence. Reuse requires attribution under CC BY 4.0. | |
Organic Fertilizers Market Analysis by Mordor Intelligence
The organic fertilizers market size is projected to expand from USD 11.04 billion in 2025 and USD 12.02 billion in 2026 to USD 18.65 billion by 2031, registering a CAGR of 9.2% between 2026 and 2031. Demand is gathering momentum as growers respond to tighter residue limits, retailer procurement mandates, and federal conservation payments that narrow the price gap with synthetic inputs. Europe led with a 40.93% organic fertilizers market share in 2025, yet North America is the fastest riser, due to soil-health metrics now embedded in crop-insurance rules and conservation cost-share programs. Manure-based formulations retained price leadership by leveraging livestock waste streams that now qualify for both renewable-energy and nutrient-recycling incentives. Quality-assurance technologies in the organic fertilizer market, such as near-infrared nutrient analyzers, are improving batch consistency, helping institutional buyers switch from urea to certified organic blends. Companies able to marry waste-to-value sourcing with sensor-guided quality control are positioned to capture the next wave of organic fertilizer market expansion.
Key Report Takeaways
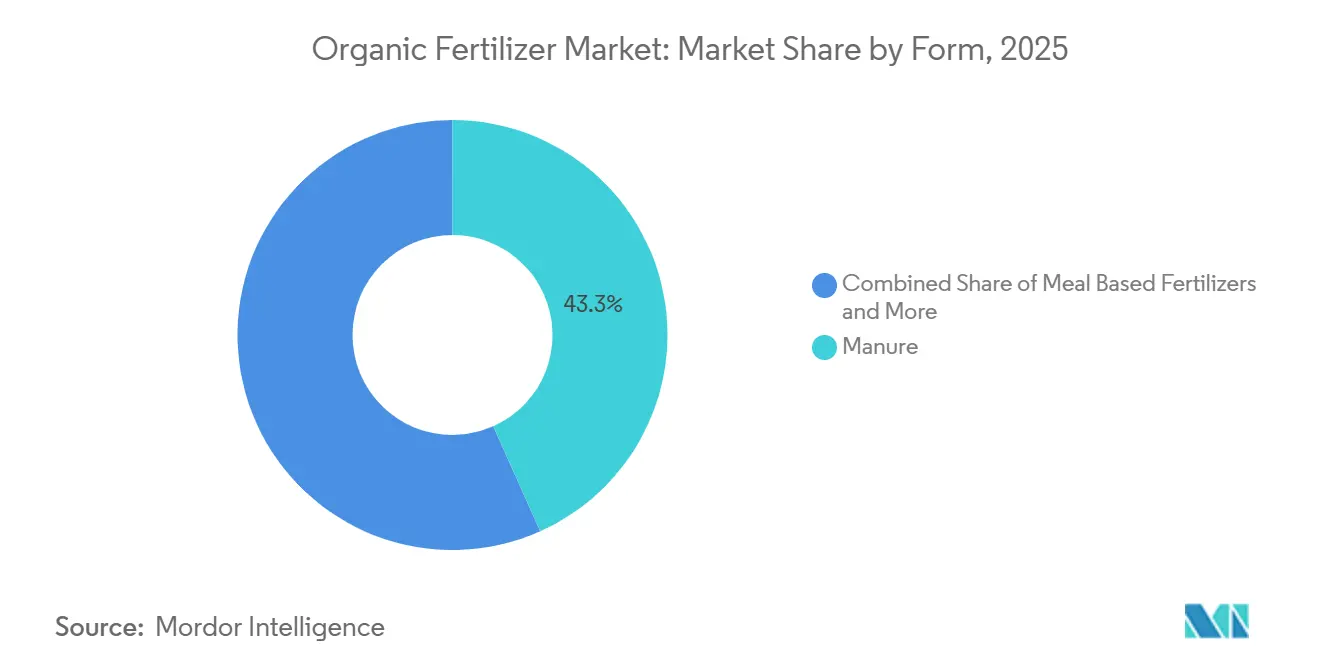
- By form, manure-based products held 43.3% of the organic fertilizer market share in 2025, and are forecast to post a 9.7% CAGR through 2031, the fastest growth among all forms.
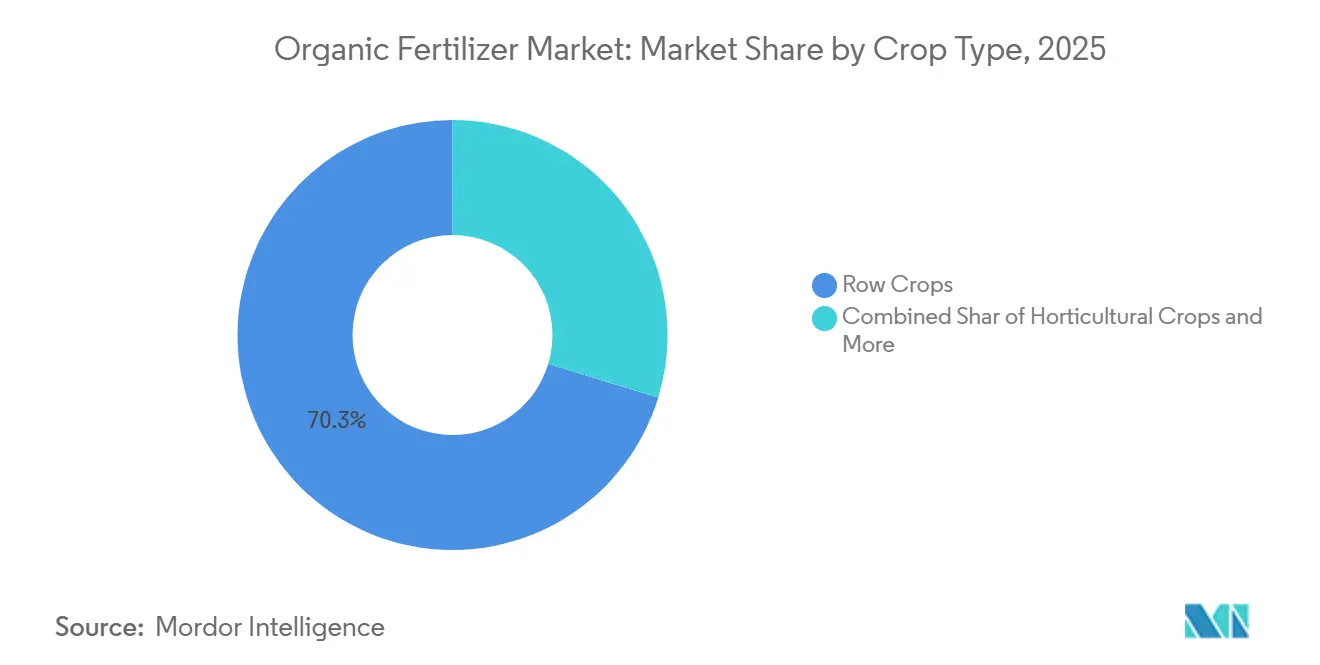
- By crop type, row crops accounted for 70.3% of the organic fertilizer market size in 2025, whereas cash crops are forecast to grow at a 9.9% CAGR through 2031.
- By geography, Europe maintained a 40.9% revenue share of the organic fertilizer market in 2025, while North America is poised to register an 11.7% CAGR to 2031.
Note: Market size and forecast figures in this report are generated using Mordor Intelligence’s proprietary estimation framework, updated with the latest available data and insights as of 2026.
Global Organic Fertilizers Market Trends and Insights
Drivers Impact Analysis*
| Driver | (~) % Impact on CAGR Forecast | Geographic Relevance | Impact Timeline |
|---|---|---|---|
| Government incentives and subsidies | +1.8% | North America, European Union, and China | Medium term (2-4 years) |
| Rising consumer demand for organic food | +1.5% | North America, European Union, and urban Asia-Pacific | Long term (≥ 4 years) |
| Environmental regulations limiting chemical fertilizers | +1.3% | European Union, California, and Japan | Short term (≤ 2 years) |
| Expansion of certified organic farmland | +1.2% | India, China, and South America | Medium term (2-4 years) |
| Circular-economy waste-to-fertilizer partnerships | +0.9% | United States, European Union, and Brazil | Medium term (2-4 years) |
| Sensor-guided compost quality analytics | +0.7% | United States, India, and Spain | Long term (≥ 4 years) |
| Source: Mordor Intelligence | |||
Government Incentives and Subsidies
Direct payments are reshaping input economics for growers who commit to organic certification. The United States Department of Agriculture reimbursed up to 75% of certification costs under its Organic Certification Cost Share Program in fiscal 2025[1]Source: United States Department of Agriculture, “Organic Certification Cost Share Program,” ams.usda.gov. Canada’s Agricultural Climate Solutions fund allocated CAD 185 million (USD 137 million) to channel grants toward soil-carbon projects that favor organic nitrogen sources. India’s Paramparagat Krishi Vikas Yojana disbursed INR 12 billion (USD 144 million) that same year, with 60% earmarked for organic inputs. These programs shorten the break-even horizon for farms in the organic fertilizer market during the three-year transition window, guaranteeing near-term demand for compliant fertilizers.
Rising Consumer Demand for Organic Food
Per-capita organic spending rose in Germany in 2025, continuing a multiyear uptrend that supports acreage conversion. Whole Foods Market disclosed an 11% year-over-year rise in organic produce revenue in its fourth-quarter 2025, nearly triple the growth for conventional produce. European discounter Aldi said it will double the number of organic Stock Keeping Units (SKUs ) by 2027, locking in multi-year procurement contracts that cascade demand back through the value chain. With retail shelf space expanding, growers in the organic fertilizer market have predictable offtake agreements that stabilize fertilizer purchasing cycles.
Environmental Regulations Limiting Chemical Fertilizers
Europe’s revised Nitrates Directive lowered nitrogen caps to 170 kilograms per hectare in vulnerable zones in 2024, accelerating the switch to slow-release organic blends[2]Source: European Environment Agency, “Nitrates Directive Report,” eea.europa.eu. California’s Sustainable Groundwater Management Act restricts nitrate leaching to 10 milligrams per liter, pushing almond and vegetable sectors toward compost-based alternatives. Japan’s regulation mandating soil-impact assessments for synthetic fertilizer use above 200 kilograms per hectare further nudges growers toward organic inputs. Stricter enforcement and real-time nutrient reporting, scheduled for 2026, will raise compliance costs for synthetic users, making organic fertilizer market options more attractive.
Expansion of Certified Organic Farmland
Organic agriculture is practiced in nearly 190 countries, and in 2025, nearly 99 million hectares of agricultural land were managed organically by at least 4.3 million farmers. India, China, and Argentina accounted for more than half of the net addition, with Argentina’s organic soybean area alone rising 18% on stronger European feed demand. China’s organic tea plantations gained 22,000 hectares due to rising domestic premiums. Farms entering transition create a locked-in demand cycle in the organic fertilizers market through 2029 under both the National Organic Program and the European Union Organic Regulation.
Restraints Impact Analysis*
| Restraint | (~) % Impact on CAGR Forecast | Geographic Relevance | Impact Timeline |
|---|---|---|---|
| Higher production cost than synthetic fertilizers | -1.1% | Global, acute in Asia-Pacific and South America | Short term (≤ 2 years) |
| Inconsistent nutrient content and quality standards | -0.8% | Asia-Pacific and Africa | Medium term (2-4 years) |
| Feedstock competition from bioenergy and feed industries | -0.6% | United States, European Union, and Brazil | Medium term (2-4 years) |
| Logistics-emission policies penalizing bulky manure transport | -0.5% | European Union, California, and Japan | Long term (≥ 4 years) |
| Source: Mordor Intelligence | |||
Higher Production Cost Than Synthetic Fertilizers
Manure-based fertilizers averaged USD 1,850 per metric ton of nitrogen in North America during 2025, compared with USD 520 for urea, reflecting longer composting cycles, higher labor ratios, and elevated electricity charges that rose to EUR 0.22 per kilowatt-hour (USD 0.24) in Europe[3]Source: International Fertilizer Association, “Fertilizer Outlook 2025,” fertilizer.org. Composting facilities employ 3 workers per 1,000 metric tons of capacity, compared with 0.4 at granulation plants, adding USD 180–240 per metric ton in labor costs. This structural gap limits penetration in thin-margin row crops unless premiums exceed 40%.
Inconsistent Nutrient Content and Quality Standards
A 2024 journal survey of 240 compost samples found nitrogen content ranging from 0.8% to 3.2% within identically labeled products, forcing growers to over-apply and increasing the cost per unit of effective nutrient. Moisture swings of 15%–40% complicate fertigation in greenhouse sectors. Voluntary programs such as the Seal of Testing Assurance cover less than 30% of commercial volume in the organic fertilizers market, leaving most growers without third-party guarantees.
*Our forecasts treat driver/restraint impacts as directional, not additive. The impact forecasts reflect baseline growth, mix effects, and variable interactions.
Segment Analysis
By Form: Manure Dominance Anchored by Livestock Integration
Manure is the largest segment, accounting for 43.3% of the organic fertilizers market share in 2025. It also represents the fastest-expanding category, with a projected CAGR of 9.7% through 2031. Large livestock operations in North America and Europe now install anaerobic digesters that separate solid digestate for certified sale while generating renewable gas, creating dual revenue streams and improving return on investment. Meal-based products derived from blood, bone, and feather meal continue to serve niche horticultural applications where rapid nitrogen release is critical, although their share is capped by slaughterhouse throughput. Oilcakes from neem, castor, and soybean crushing are expanding in India and Southeast Asia, offering biopesticide properties that justify a price premium over compost.
The “other organic fertilizers” group, biochar, seaweed extracts, and microbial inoculants, remains small but posts double-digit growth as growers seek to enhance nutrient-use efficiency. True Organic Products introduced a biochar blend in 2025 that improved phosphorus retention by 20% in field trials, appealing to producers in phosphorus-restricted watersheds. The European Union’s Fertilising Products Regulation harmonizes trade for animal-derived inputs while tightening heavy-metal limits on biosolids, indirectly favoring manure streams. Producers in the organic fertilizer market are also tackling odor by using microbial inoculants that reduce ammonia emissions, enabling manure use near peri-urban areas.


By Crop Type: Row Crops Lead, Cash Crops Accelerate
Row crops represent the largest crop type segment, capturing 70.3% of the organic fertilizers market size in 2025, driven by their extensive global acreage. Certified organic corn and soybean fields in the United States each applied about 1.8 metric tons of compost per hectare, a rate that reflects the need to mineralize nitrogen gradually under nitrate caps. Cash crops are the fastest-growing segment, forecast to log a 9.9% CAGR to 2031, outperforming row crops as exporters chase premiums of up to 120% for certified beans, coffee, cotton, and cocoa in European retail channels. Horticultural segments such as tomatoes and lettuce applied 4.2 metric tons per hectare in 2025, underscoring high nutrient intensity despite limited acreage.
Sustainability-linked loans and procurement mandates reinforce the growth arc in the organic fertilizers market, particularly for cash crops. Starbucks will source coffee only from farms that use organic or regenerative inputs by 2030, a pledge that will affect 400,000 global suppliers. Organic cotton acreage in India expanded 14% to 185,000 hectares in 2025 in part due to Better Cotton Initiative premiums and input subsidies. Row-crop adoption is slower but advancing, and the United States Department of Agriculture (USDA) Conservation Stewardship Program incentives narrowed the profitability gap by paying organic grain growers USD 42 per hectare in 2025 for soil-health practices that include organic fertilizer application. Greenhouse vegetables are turning to liquid organic formulations compatible with drip and hydroponic systems, addressing clogging issues that historically discouraged solid compost use.
Geography Analysis
Europe led the market, capturing 40.9% of the organic fertilizer market share in 2025. Germany, France, and the Netherlands represented major continental consumption, supported by livestock-dense regions where manure management revenue offsets disposal liabilities. The Common Agricultural Policy reserved EUR 1.8 billion (USD 1.95 billion) in 2025 for organic conversion payments, accelerating acreage gains. Italy and Spain posted rapid growth in expanding organic olive and wine grape hectares, buoyed by Asian demand for European-origin products.
North America is the fastest-growing region, projected to expand at an 11.7% CAGR through 2031, propelled by conservation incentives that tie crop insurance eligibility to soil health benchmarks. Certified acreage grew 1.2 million hectares in 2025, led by California, Iowa, and Wisconsin. Mexico imported more organic fertilizer in 2025 as avocado and berry farms scaled to meet the United States' demand. State-level programs such as New York’s Organic Transition Payment of USD 150 per hectare and Oregon’s 75% cost share further de-risk switching.
Asia-Pacific shows strong yet uneven progress in the organic fertilizers market. China expanded its organic tea and vegetable acreage to address domestic food-safety concerns and premium export channels to Japan and South Korea, while India leveraged subsidies to push neem cake and meal-based fertilizers. South America’s organic soybean and coffee sectors grew double digits, with Argentina and Brazil tailoring supply to European non-GMO buyers. Saudi Arabia invested SAR 420 million (USD 112 million) in 2025 to nurture organic dates and vegetables in line with Vision 2030's food security goals. South Africa’s off-season organic citrus exports climbed, consuming 42,000 metric tons of certified fertilizers in 2025. Logistics and fragmented certification bodies still constrain wider adoption across the organic fertilizer market, but premium export corridors and public subsidies create localized pockets of rapid growth.

Competitive Landscape
The top five manufacturers account for a very small share of worldwide revenues, reflecting near-perfect fragmentation. Multinationals in the organic fertilizer industry, such as Coromandel International and Gujarat State Fertilizers and Chemicals Ltd, leverage existing dealer networks to cross-sell organic lines alongside synthetic products, helping growers simplify credit and agronomy services. Mid-tier specialists like Italpollina and Sustane Natural Fertilizer compete on proprietary microbial inoculants and sensor-verified nutrient statements that meet institutional buyer specifications.
Cost and quality leadership in the organic fertilizer market is moving toward technology deployment. California Organic Fertilizers Inc. cut labor outlays 22% by installing autonomous turners for compost piles, a capital expense viable at scales above 50,000 metric tons per year. Patent filings for odor-control coatings and nutrient-encapsulation methods rose, with 14 grants recorded during 2025. Vertically integrated supply chains are emerging as a defensible moat. Darling Ingredients opened a USD 78 million Iowa facility in 2025 that processes by-products into certified fertilizers, locking in feedstock and trimming freight costs.
Data-driven service models represent a key area of competition in the organic fertilizers market. Equipment manufacturers are offering modular composting units that enable livestock operations to produce certified fertilizers on-site, eliminating the need for traditional distributors. These units not only streamline the production process but also reduce dependency on external supply chains, offering cost and time efficiencies. With stricter regulatory compliance, the European Union Fertilising Products Regulation requires batch traceability and heavy-metal testing. This regulation ensures higher product quality and environmental safety standards. Companies in the organic fertilizer industry with robust quality systems have a competitive advantage, as they are better positioned to meet these stringent requirements and build trust with stakeholders.
Organic Fertilizers Industry Leaders
Coromandel International Ltd
Gujarat State Fertilizers and Chemicals Ltd.
E.B.Stone and Sons Inc
Deepak Fertilisers and Petrochemicals Corp. Ltd.
Sustane Natural Fertilizer, Inc
- *Disclaimer: Major Players sorted in no particular order

Recent Industry Developments
- February 2025: Wilbur-Ellis has introduced BenVireo TerraLux in the United States, an organic nitrogen fertilizer aimed at enhancing soil health and crop performance. The product is OMRI-listed, making it compatible with certified organic farming systems and providing sustainable nutrient solutions for growers.
- August 2024: Solugen Global has introduced Azogen 5-0-0, a liquid nitrogen fertilizer developed by Azo-Gen, a subsidiary of the Canadian company Solugen Inc., and designed to be organic-friendly. The product is aimed at fruit and vegetable growers in the United States and will be presented at the Organic Grower Summit 2024.
- February 2022: Gujarat State Fertilizers and Chemicals Ltd launched its "Urban Sardar" range, which is an eco-friendly line of organic nutrients fertilizer specifically targeting the gardening and horticultural sectors.


Global Organic Fertilizers Market Report Scope
Organic fertilizer is a natural soil amendment derived from biological sources such as animal manure, compost, or plant residues. It improves soil structure and nutrient content, releasing nutrients gradually as it decomposes, thereby supporting long-term soil health and sustainable plant growth.
The Organic Fertilizer Market report is segmented by form (manure, meal-based fertilizers, Oilcakes, and Other Organic Fertilizers), crop type (cash crops, horticultural crops, and row crops), and geography (Africa, Asia-Pacific, Europe, Middle East, North America, and South America). The market forecasts are provided in terms of value (USD) and volume (metric tons).
| Manure |
| Meal Based Fertilizers |
| Oilcakes |
| Other Organic Fertilizers |
| Cash Crops |
| Horticultural Crops |
| Row Crops |
| Africa | By Country | Egypt |
| Nigeria | ||
| South Africa | ||
| Rest of Africa | ||
| Asia-Pacific | By Country | Australia |
| China | ||
| India | ||
| Indonesia | ||
| Japan | ||
| Philippines | ||
| Thailand | ||
| Vietnam | ||
| Rest of Asia-Pacific | ||
| Europe | By Country | France |
| Germany | ||
| Italy | ||
| Netherlands | ||
| Russia | ||
| Spain | ||
| United Kingdom | ||
| Rest of Europe | ||
| Middle East | By Country | Iran |
| Saudi Arabia | ||
| Turkey | ||
| Rest of Middle East | ||
| North America | By Country | Canada |
| Mexico | ||
| United States | ||
| Rest of North America | ||
| South America | By Country | Argentina |
| Brazil | ||
| Rest of South America |
| By Form | Manure | ||
| Meal Based Fertilizers | |||
| Oilcakes | |||
| Other Organic Fertilizers | |||
| By Crop Type | Cash Crops | ||
| Horticultural Crops | |||
| Row Crops | |||
| By Geography | Africa | By Country | Egypt |
| Nigeria | |||
| South Africa | |||
| Rest of Africa | |||
| Asia-Pacific | By Country | Australia | |
| China | |||
| India | |||
| Indonesia | |||
| Japan | |||
| Philippines | |||
| Thailand | |||
| Vietnam | |||
| Rest of Asia-Pacific | |||
| Europe | By Country | France | |
| Germany | |||
| Italy | |||
| Netherlands | |||
| Russia | |||
| Spain | |||
| United Kingdom | |||
| Rest of Europe | |||
| Middle East | By Country | Iran | |
| Saudi Arabia | |||
| Turkey | |||
| Rest of Middle East | |||
| North America | By Country | Canada | |
| Mexico | |||
| United States | |||
| Rest of North America | |||
| South America | By Country | Argentina | |
| Brazil | |||
| Rest of South America | |||


Market Definition
- AVERAGE DOSAGE RATE - The average application rate is the average volume of organic fertilizers applied per hectare of farmland in the respective region/country.
- CROP TYPE - Crop type includes Row crops (Cereals, Pulses, Oilseeds), Horticultural Crops (Fruits and vegetables) and Cash Crops (Plantation Crops, Fibre Crops and Other Industrial Crops)
- FUNCTION - The crop nutrition function of agricultural biological consists of various products that provide essential plant nutrients and enhance soil quality.
- TYPE - Organic fertilizers are applied to provide essential crop nutrients and enhance the soil quality.
| Keyword | Definition |
|---|---|
| Cash Crops | Cash crops are non-consumable crops sold as a whole or part of the crop to manufacture end-products to make a profit. |
| Integrated Pest Management (IPM) | IPM is an environment-friendly and sustainable approach to control pests in various crops. It involves a combination of methods, including biological controls, cultural practices, and selective use of pesticides. |
| Bacterial biocontrol agents | Bacteria used to control pests and diseases in crops. They work by producing toxins harmful to the target pests or competing with them for nutrients and space in the growing environment. Some examples of commonly used bacterial biocontrol agents include Bacillus thuringiensis (Bt), Pseudomonas fluorescens, and Streptomyces spp. |
| Plant Protection Product (PPP) | A plant protection product is a formulation applied to crops to protect from pests, such as weeds, diseases, or insects. They contain one or more active substances with other co-formulants such as solvents, carriers, inert material, wetting agents or adjuvants formulated to give optimum product efficacy. |
| Pathogen | A pathogen is an organism causing disease to its host, with the severity of the disease symptoms. |
| Parasitoids | Parasitoids are insects that lay their eggs on or within the host insect, with their larvae feeding on the host insect. In agriculture, parasitoids can be used as a form of biological pest control, as they help to control pest damage to crops and decrease the need for chemical pesticides. |
| Entomopathogenic Nematodes (EPN) | Entomopathogenic nematodes are parasitic roundworms that infect and kill pests by releasing bacteria from their gut. Entomopathogenic nematodes are a form of biocontrol agents used in agriculture. |
| Vesicular-arbuscular mycorrhiza (VAM) | VAM fungi are mycorrhizal species of fungus. They live in the roots of different higher-order plants. They develop a symbiotic relationship with the plants in the roots of these plants. |
| Fungal biocontrol agents | Fungal biocontrol agents are the beneficial fungi that control plant pests and diseases. They are an alternative to chemical pesticides. They infect and kill the pests or compete with pathogenic fungi for nutrients and space. |
| Biofertilizers | Biofertilizers contain beneficial microorganisms that enhance soil fertility and promote plant growth. |
| Biopesticides | Biopesticides are natural/bio-based compounds used to manage agricultural pests using specific biological effects. |
| Predators | Predators in agriculture are the organisms that feed on pests and help control pest damage to the crops. Some common predator species used in agriculture include ladybugs, lacewings, and predatory mites. |
| Biocontrol agents | Biocontrol agents are living organisms used to control pests and diseases in agriculture. They are alternatives to chemical pesticides and are known for their lesser impact on the environment and human health. |
| Organic Fertilizers | Organic fertilizer is composed of animal or vegetable matter used alone or in combination with one or more non-synthetically derived elements or compounds used for soil fertility and plant growth. |
| Protein hydrolysates (PHs) | Protein hydrolysate-based biostimulants contain free amino acids, oligopeptides, and polypeptides produced by enzymatic or chemical hydrolysis of proteins, primarily from vegetal or animal sources. |
| Biostimulants/Plant Growth Regulators (PGR) | Biostimulants/Plant Growth Regulators (PGR) are substances derived from natural resources to enhance plant growth and health by stimulating plant processes (metabolism). |
| Soil Amendments | Soil Amendments are substances applied to soil that improve soil health, such as soil fertility and soil structure. |
| Seaweed Extract | Seaweed extracts are rich in micro and macronutrients, proteins, polysaccharides, polyphenols, phytohormones, and osmolytes. These substances boost seed germination and crop establishment, total plant growth and productivity. |
| Compounds related to biocontrol and/or promoting growth (CRBPG) | Compounds related to biocontrol or promoting growth (CRBPG) are the ability of a bacteria to produce compounds for phytopathogen biocontrol and plant growth promotion. |
| Symbiotic Nitrogen-Fixing Bacteria | Symbiotic nitrogen-fixing bacteria such as Rhizobium obtain food and shelter from the host, and in return, they help by providing fixed nitrogen to the plants. |
| Nitrogen Fixation | Nitrogen fixation is a chemical process in soil which converts molecular nitrogen into ammonia or related nitrogenous compounds. |
| ARS (Agricultural Research Service) | ARS is the U.S. Department of Agriculture's chief scientific in-house research agency. It aims to find solutions to agricultural problems faced by the farmers in the country. |
| Phytosanitary Regulations | Phytosanitary regulations imposed by the respective government bodies check or prohibit the importation and marketing of certain insects, plant species, or products of these plants to prevent the introduction or spread of new plant pests or pathogens. |
| Ectomycorrhizae (ECM) | Ectomycorrhiza (ECM) is a symbiotic interaction of fungi with the feeder roots of higher plants in which both the plant and the fungi benefit through the association for survival. |


Research Methodology
Mordor Intelligence follows a four-step methodology in all our reports.
- Step-1: Identify Key Variables: In order to build a robust forecasting methodology, the variables and factors identified in Step-1 are tested against available historical market numbers. Through an iterative process, the variables required for market forecast are set and the model is built on the basis of these variables.
- Step-2: Build a Market Model: Market-size estimations for the forecast years are in nominal terms. Inflation is not a part of the pricing, and the average selling price (ASP) is kept constant throughout the forecast period.
- Step-3: Validate and Finalize: In this important step, all market numbers, variables and analyst calls are validated through an extensive network of primary research experts from the market studied. The respondents are selected across levels and functions to generate a holistic picture of the market studied.
- Step-4: Research Outputs: Syndicated Reports, Custom Consulting Assignments, Databases & Subscription Platforms.


