Market Overview
| Study Period | 2021 - 2031 |
|---|---|
| Forecast Data Period | 2026 - 2031 |
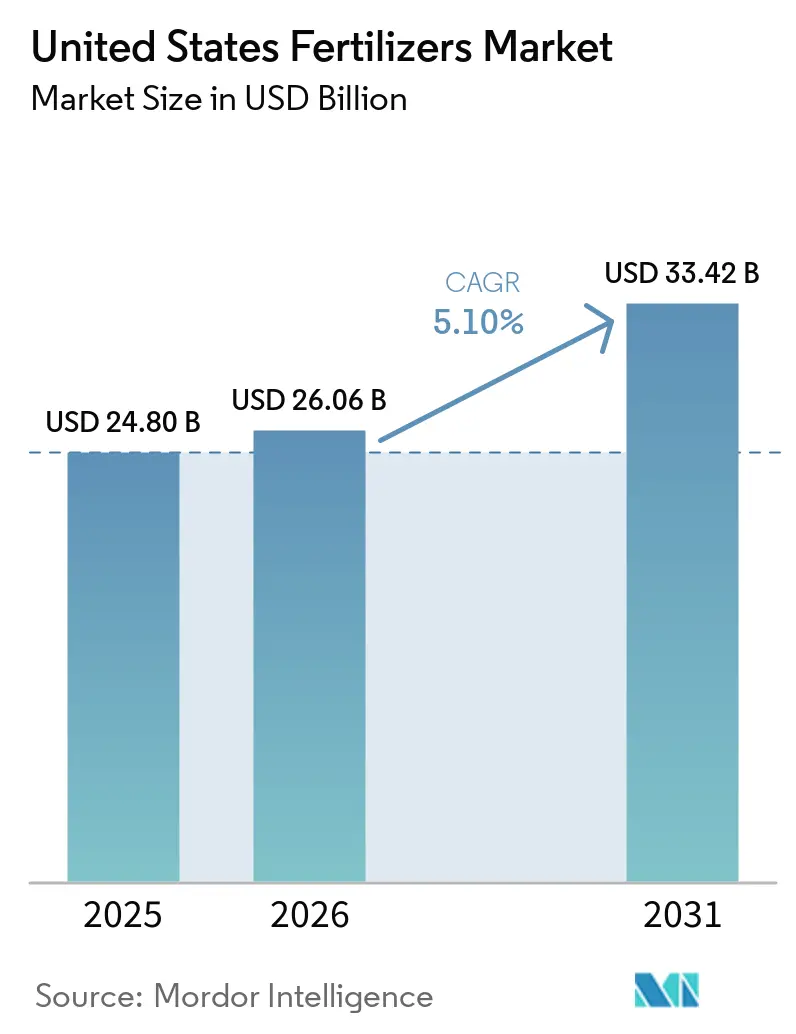
| Base Year Market Size (2025) | USD 24.80 Billion |
| Market Size (2026) | USD 26.06 Billion |
| Market Size (2031) | USD 33.42 Billion |
| Growth Rate (2026 - 2031) | 5.10% CAGR |
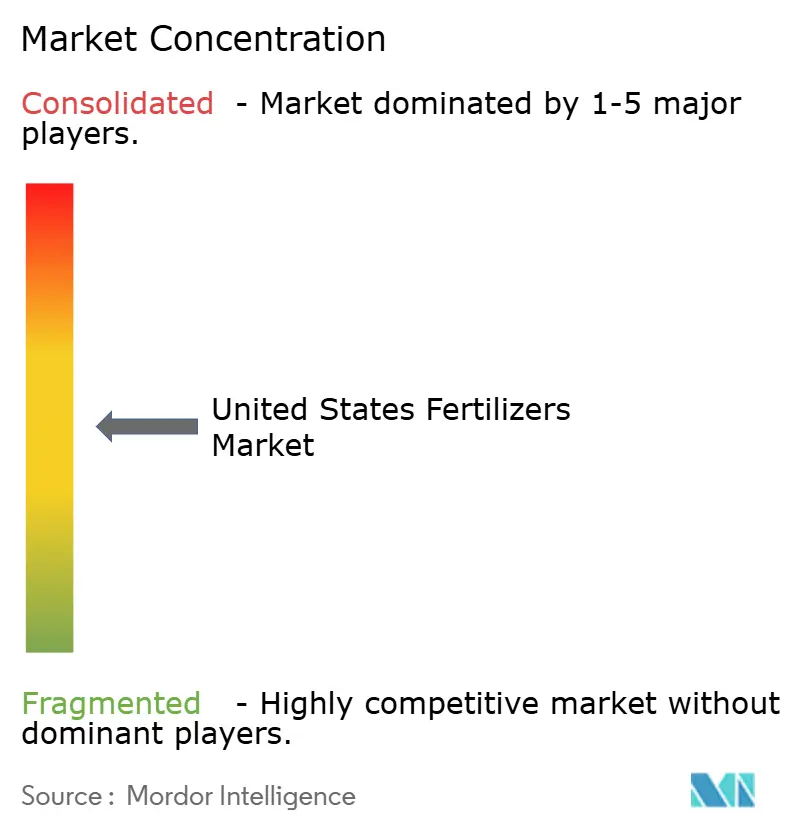
| Market Concentration | Medium |
Major Players*Disclaimer: Major Players sorted in no particular order Image © Mordor Intelligence. Reuse requires attribution under CC BY 4.0. | |
United States Fertilizers Market Analysis by Mordor Intelligence
The United States fertilizer market size was valued at USD 24.80 billion in 2025 and is projected to reach USD 26.06 billion in 2026 and USD 33.42 billion by 2031, representing a CAGR of 5.1% over the forecast period. Supported by elevated grower income and the rapid adoption of precision agriculture, the United States fertilizers market is moving toward tailored nutrient programs that minimize losses, improve ROI, and meet tightening environmental regulations. Demand continues to lean on bulk nitrogen, phosphate, and potash, yet specialty offerings are scaling as variable-rate technology highlights within-field deficiencies that commodity blends fail to fix. Federal and state incentives for enhanced-efficiency coatings reduce adoption costs and expand margins for suppliers that can commercialize coated, stabilized, and slow-release technologies. Meanwhile, Gulf Coast investments in blue and green ammonia promise domestic supply security, lower embedded carbon, and potential export upside once capacity comes online at the end of the decade. Against this backdrop, volatility in Henry Hub natural gas pricing continues to squeeze ammonia producers, and watershed-specific nutrient caps restrict volume growth in several high-consumption regions, forcing suppliers to rely on higher-value formulations to protect revenue.
Key Report Takeaways
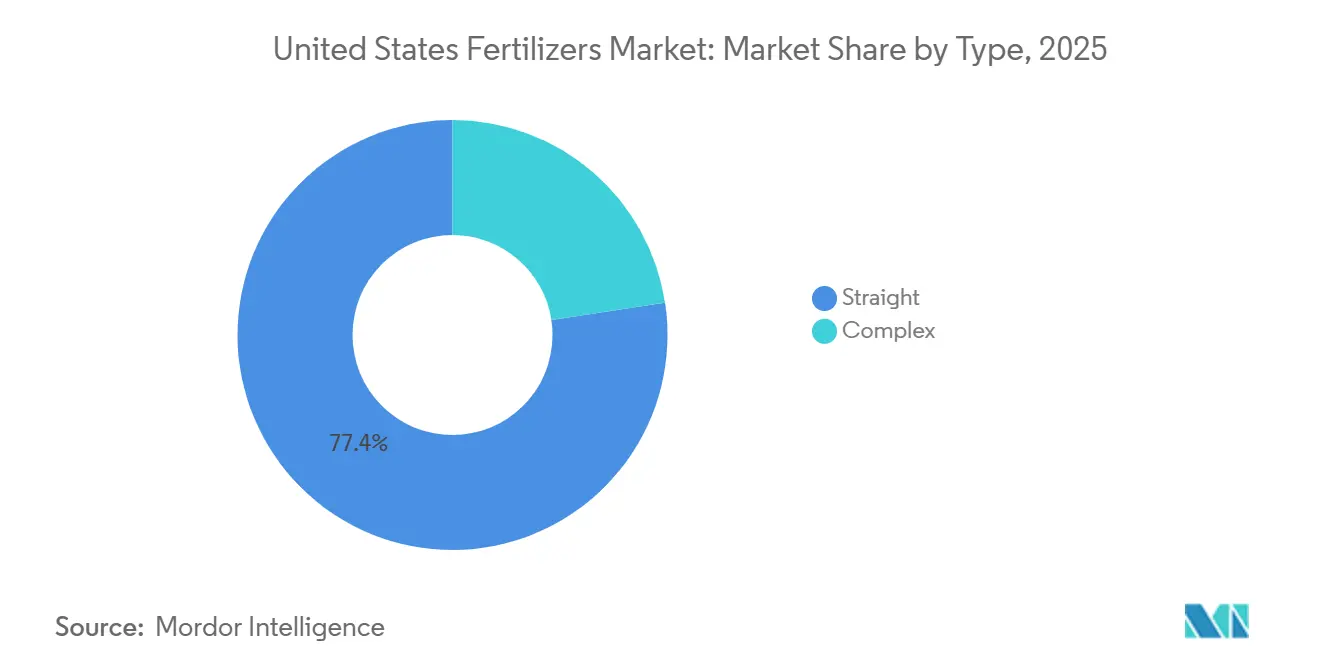
- By type, straight fertilizers accounted for the largest United States fertilizers market share, at 77.4% in 2025, while complex fertilizers are projected to be the fastest-growing segment, advancing at a CAGR of 6.7% from 2026 to 2031.
- By form, conventional products held the largest United States fertilizers market size in 2025 with a 76.2% share, whereas specialty fertilizers are forecast to register the highest growth rate at a CAGR of 5.5% through 2031.
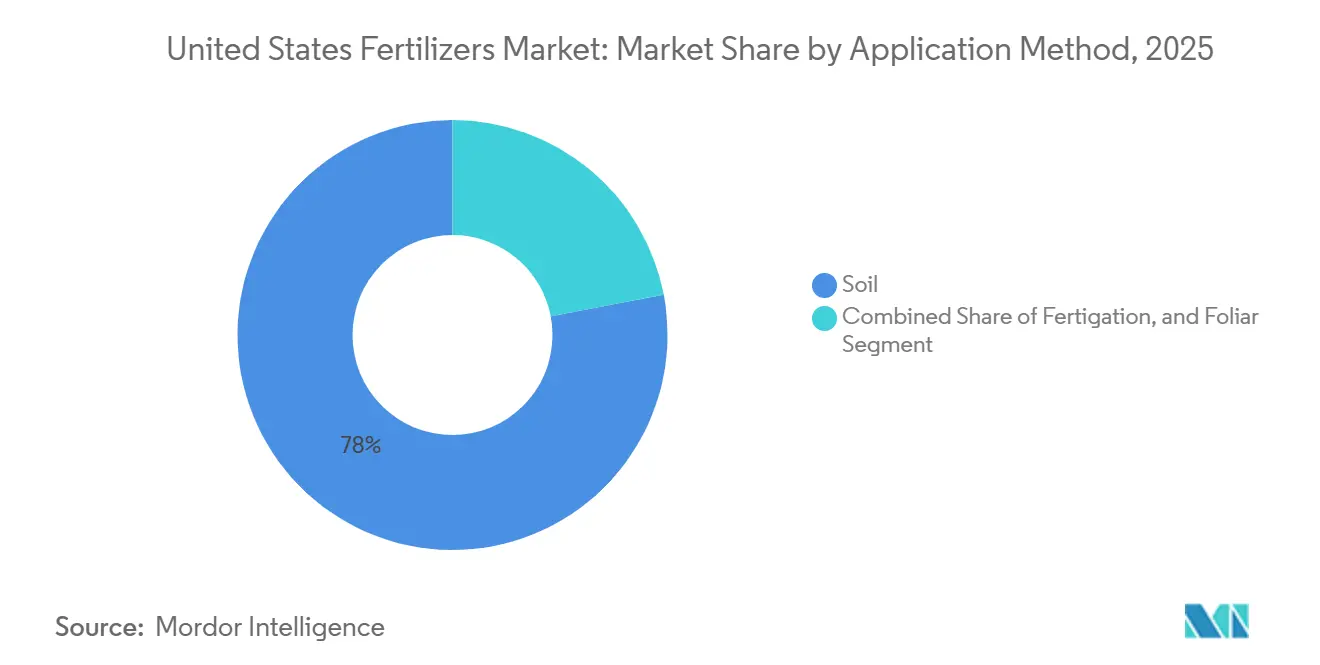
- By application mode, soil application represented the largest market share in 2025 at 78.0%, while fertigation is projected to be the fastest-growing segment, expanding at a CAGR of 6.1% from 2026 to 2031.
- By crop type, field crops captured the largest share in 2025 with an 86.0% share, whereas horticultural crops are projected to grow at the fastest CAGR of 6.3% through 2031.
- Nutrien Ltd, CF Industries Holdings, Inc., The Mosaic Company, The Andersons Inc., and Yara International ASA are the major players, underscoring moderate concentration in the United States fertilizers market.
Note: Market size and forecast figures in this report are generated using Mordor Intelligence’s proprietary estimation framework, updated with the latest available data and insights as of 2026.
United States Fertilizers Market Trends and Insights
Drivers Impact Analysis*
| Driver | (~) % Impact on CAGR Forecast | Geographic Relevance | Impact Timeline |
|---|---|---|---|
| Precision-ag adoption and digital nutrient modeling | +0.9% | National, with concentration in the Corn Belt states (Iowa, Illinois, Indiana, and Nebraska) | Medium term (2-4 years) |
| Enhanced-efficiency fertilizer incentives | +0.6% | National, strongest in Chesapeake Bay watershed and Gulf Coast states | Short term (≤ 2 years) |
| Commodity-price–linked farm purchasing power | +0.7% | National, with emphasis on major grain-producing regions | Short term (≤ 2 years) |
| Regenerative farming and carbon credit premiums | +0.4% | National, early adoption in the Midwest and Plains states | Long term (≥ 4 years) |
| Gulf Coast green-ammonia build-out | +0.5% | Gulf Coast production hubs (Texas, and Louisiana), with national distribution impact | Long term (≥ 4 years) |
| Mississippi inter-modal fertilizer corridors | +0.3% | Mississippi River Basin, and Corn Belt distribution networks | Medium term (2-4 years) |
| Source: Mordor Intelligence | |||


Precision Agriculture Adoption and Digital Nutrient Modeling
According to data from the United States Department of Agriculture Economic Research Service, GPS-based automated guidance systems were adopted more widely by United States corn and soybean growers in 2025 than in 2020. Meanwhile, variable-rate application (VRT) hardware, a more advanced subset of precision technology, also experienced increased uptake during this period, particularly among large-scale operations. This technological advancement has led to a bifurcated demand structure. Growers utilizing precision systems have reduced total nitrogen application by 8% to 12% per acre while maintaining or improving yields, thereby decreasing demand for bulk urea and Urea Ammonium Nitrate (UAN). Concurrently, these growers are increasing their purchases of micronutrient blends and specialty additives to address within-field variability that traditional broadcast methods previously overlooked. The variable-rate systems guide fertilizer placement on approximately 31% of corn and soybean acres—rising to 45% on large-scale operations, reducing nitrogen use by 12% to 18% while preserving or slightly improving yields. [1]Source: USDA Economic Research Service, “Farm Computer Usage and Ownership,” ers.usda.gov. Digital nutrient modeling platforms, such as those offered by Nutrien Ag Solutions and Climate FieldView, are integrating soil test data, yield maps, and weather forecasts to create prescription maps. These maps optimize fertilizer return on investment (ROI), making precision application economically viable even for mid-sized farming operations.
Enhanced-Efficiency Fertilizer Incentives
The Inflation Reduction Act of 2022 introduced federal tax credits that provide a 30% cost offset for urease inhibitors and nitrification inhibitors used with nitrogen fertilizers. This reduces the premium for enhanced-efficiency products from USD 15-20 per acre to USD 10-14 per acre. Additionally, state-level water-quality grants in Maryland, Virginia, Pennsylvania, and Iowa offer subsidies of USD 5 to USD 10 per acre to growers adopting slow- or controlled-release formulations in nutrient-sensitive watersheds. These incentives are driving the adoption of products such as ESN (Environmentally Smart Nitrogen) and Agrotain, which minimize nitrogen loss through volatilization and leaching. The combined federal and state support for enhanced-efficiency products sustains high price premiums over conventional fertilizers while providing measurable environmental benefits that align with Environmental Protection Agency (EPA) Total Maximum Daily Load requirements in impaired watersheds.
Gulf Coast Green-Ammonia Build-Out
The Gulf Coast is emerging as a significant hub for low-carbon ammonia production, bolstering the United States fertilizers market. CF Industries Holdings has announced a USD 3.5 billion investment in Donaldsonville, Louisiana, to produce 1.5 million metric tons per year of blue ammonia by 2028. Similarly, Yara International, in partnership with Enbridge Inc., is advancing plans for a low-carbon ammonia facility in Corpus Christi, Texas, with a capacity of 1.4 million metric tons per year, with a final investment decision projected for 2026. These developments, including projects from Nutrien Ltd., represent over USD 15 billion in announced investments along the Gulf Coast, aiming to add several million metric tons of new capacity by 2030 while enhancing nitrogen supply and reducing carbon intensity.
Mississippi Intermodal Fertilizer Corridors
The United States Army Corps of Engineers has allocated USD 829.1 million for the modernization of Lock and Dam 25 on the Upper Mississippi River. The initial design phase is scheduled for completion between 2024 and 2025, with the 1,200-foot lock anticipated to reduce delays once it becomes operational in the early 2030s. Concurrently, BNSF Railway and Union Pacific plan to invest over USD 7 billion annually from 2024 to 2026 in rail infrastructure projects, including the construction of a new intermodal ramp in Kansas City. Additionally, private transloading upgrades in St. Louis and Memphis aim to improve barge-to-rail connectivity. Collectively, these developments are projected to reduce fertilizer logistics costs by USD 8–12 per metric ton from Gulf Coast hubs to Corn Belt retailers, enhancing midstream efficiency and supporting competitive inland pricing.
Restraints Impact Analysis*
| Restraint | (~) % Impact on CAGR Forecast | Geographic Relevance | Impact Timeline |
|---|---|---|---|
| Natural-gas volatility raising nitrogen costs | -0.8% | National, with an acute impact on Gulf Coast and Midwest ammonia producers | Short term (≤ 2 years) |
| Tighter nutrient-runoff regulations | -0.6% | Chesapeake Bay watershed (Maryland, Virginia, and Pennsylvania), Mississippi River Basin, and Gulf of Mexico hypoxia zone | Medium term (2-4 years) |
| Biologic nutrition substitutes in specialty crops | -0.3% | California, the Pacific Northwest, Florida, and other high-value crop regions | Long term (≥ 4 years) |
| Aging ammonia-pipeline network risks | -0.4% | Midwest ammonia pipeline corridor (Iowa, Illinois, Indiana, Kansas, and Nebraska) | Medium term (2-4 years) |
| Source: Mordor Intelligence | |||
Biologic Nutrition Substitutes in Specialty Crops
Microbial biofertilizers, including nitrogen-fixing bacteria, phosphate-solubilizing fungi, and other beneficial microorganisms, are increasingly used in high-value specialty crops. These products are gaining popularity despite their cost premium of USD 40 to USD 80 per acre compared to synthetic fertilizers. According to data from the California Department of Food and Agriculture, California almond and pistachio growers increased their use of bio-fertilizers between 2022 and 2025 [2]Source: California Department of Water Resources, “Sustainable Groundwater Management Act Implementation,” water.ca.gov . Similarly, apple and cherry producers in the Pacific Northwest expanded bio-fertilizer usage in 2025, driven by organic certification requirements and rising consumer demand for reduced synthetic inputs.
Aging Ammonia-Pipeline Network Risks
The aging U.S. ammonia-pipeline network, largely built in the 1960s–1970s, poses supply risks, particularly in the Midwest. Following its 2023 acquisition of Magellan Midstream Partners, ONEOK, Inc. is managing a 1,100-mile segment with a multi-year rehabilitation program through 2027 to meet 2026 PHMSA safety standards. Temporary shutdowns for maintenance can disrupt supplies, forcing reliance on costlier rail and truck transport and limiting short-term volume growth in high-demand corn regions.
*Our forecasts treat driver/restraint impacts as directional, not additive. The impact forecasts reflect baseline growth, mix effects, and variable interactions.
Segment Analysis
By Type: Straight Fertilizers Dominate, Complex Blends Gain Momentum
Straight fertilizers hold the largest share by type, accounting for 77.4% of the United States fertilizers market size in 2025. This growth is driven by the widespread use of nitrogen, phosphate, and potash products in row-crop agriculture. Zinc deficiency affects an estimated 30% of US corn acreage, particularly in high-pH soils common in the Great Plains and Western Corn Belt, according to a 2024 American Society of Agronomy [3]Source: American Society of Agronomy, “Zinc Deficiency in US Corn Production,” acs.org . Growers are responding by incorporating zinc sulfate and zinc chelates into starter fertilizer blends, driving micronutrient demand. Phosphatic fertilizers, led by diammonium phosphate (DAP) and monopotassium phosphate (MOP), serve both corn and soybean markets, while potassic fertilizers provide potassium for a wide range of crops.
Large-scale operations continue to prefer straight nutrients, as retailers can blend precise formulas at the point of sale. Conversely, smaller farms and regions with limited access to custom application services increasingly depend on complex grades for convenience and balanced nutrient delivery. Consequently, the complex fertilizers segment is projected to grow at the fastest CAGR of 6.7% from 2026 to 2031.


By Form: Specialty Formulations Gain Traction
Conventional products hold the largest share by form, representing 76.2% of the United States fertilizers market share in 2025, underscoring the continued prevalence of bulk urea, diammonium phosphate (DAP), monopotassium phosphate (MOP), and potash in row-crop agriculture. These products benefit from well-established distribution networks, competitive pricing, and widespread agronomic familiarity among growers. Meanwhile, the specialty fertilizer segment is experiencing growth, driven by federal and state incentives that help offset the cost premium associated with enhanced-efficiency products. For instance, the Inflation Reduction Act provides tax credits covering 30% of the cost of urease and nitrification inhibitors, effectively reducing the net cost of products such as ESN and Agrotain.
Specialty formulations are projected to grow at a CAGR of 5.5% through 2031, marking the fastest growth among fertilizer types. Controlled-release fertilizers (CRFs), which utilize polymer coatings to regulate nutrient release over 60 to 120 days, are increasingly adopted in high-value crops and turf applications. These applications justify the premium cost of USD 0.80 to USD 1.20 per pound compared to conventional products. Slow-release fertilizers (SRFs), such as sulfur-coated urea and methylene urea, provide a more cost-effective alternative to CRFs while still reducing nitrogen loss and extending nutrient availability. Liquid fertilizers are gaining traction, particularly for fertigation systems and foliar applications. This trend is notable in regions such as California and the Southwest, where water scarcity is driving the adoption of precision irrigation practices. Additionally, water-soluble fertilizers are widely used in greenhouse and nursery operations, where controlled-environment production requires highly soluble and fast-acting nutrient sources.
By Application Method: Fertigation Accelerates in Water-Scarce Regions
Soil applications hold the largest share by application method, accounting for 78.0% of the United States fertilizers market in 2025, as broadcast, banded, and incorporated methods remain standard practices for row-crop agriculture. Broadcast application, which evenly distributes fertilizer across the field surface, is the most commonly used method for phosphate and potash products. In contrast, banded application, which places fertilizer in concentrated rows near the seed, is preferred for nitrogen and micronutrients that require precise placement. Incorporated application, which involves mixing fertilizer into the soil, helps reduce volatilization losses and is increasingly utilized for urea and Urea Ammonium Nitrate (UAN) products.
Fertigation is projected to grow at a CAGR of 6.1% during the forecast period, making it the fastest-growing application method. This growth is concentrated in regions such as California, Arizona, and the Pacific Northwest, where drip and sprinkler irrigation systems facilitate precise nutrient delivery, enhancing water and fertilizer use efficiency. The adoption of fertigation is being driven by water scarcity and regulatory measures aimed at reducing nutrient runoff. For instance, California's Sustainable Groundwater Management Act, implemented in 2020, requires growers to reduce water usage by 10% to 20%, making fertigation economically vital for maintaining crop yields with limited water resources. Similarly, growers in Arizona and the Pacific Northwest are adopting fertigation technologies to address water allocation cuts and optimize input usage.
By Crop Type: Horticultural Crops Drive Premium Demand
Field crops account for the largest share, 86.0% of the United States fertilizers market in 2025, underscoring the prominence of corn, soybeans, wheat, and cotton in American agriculture. Corn alone accounts for approximately 11 million metric tons of nitrogen, 4 million metric tons of phosphate, and 5 million metric tons of potash annually, making it the largest fertilizer-consuming crop in the country. While soybeans require less nitrogen due to biological fixation, they still necessitate substantial phosphate and potash inputs. Wheat and cotton complete the field crop segment, with wheat primarily grown in the Great Plains and cotton concentrated in the Southeast and Texas.
Horticultural crops are projected to grow at a compound annual growth rate (CAGR) of 6.3% through 2031, marking the fastest expansion among crop types. This growth is fueled by increasing specialty crop acreage, particularly almonds and pistachios in California, which expanded by 120,000 acres between 2020 and 2025. Additionally, growers are willing to invest in premium specialty fertilizers to enhance yield and quality in high-value crops. The United States fertilizers market has a significant share of micronutrient treatments for tree crops, where zinc and boron address common deficiencies in alkaline soils. Turf and ornamental applications remain a niche but stable segment, benefiting from controlled-release formulations that comply with municipal nutrient run-off regulations while maintaining turf quality for golf courses and sports fields.
Geography Analysis
The Corn Belt, which includes Iowa, Illinois, Indiana, Nebraska, and Ohio, accounts for the largest share of national fertilizer consumption despite representing only 15% of agricultural land. This reflects the nitrogen-intensive requirements of corn and soybean production. Precision agriculture adoption in the region exceeds 75% in certain counties, enabling growers to optimize application rates while maintaining yields. This approach supports compliance with runoff regulations and enhances profitability.
The Great Plains region exhibits a unique demand pattern influenced by variable rainfall and a diverse crop mix, including corn, wheat, sorghum, and cotton. Nebraska, Kansas, and Texas are the primary consuming states, with Texas leading due to its 27 million harvested acres and access to ports that import potash and phosphate at competitive costs. Rail transport remains essential for inland delivery, adding USD 15-25 per ton for operations distant from coastal terminals. Investments in barge networks are beginning to mitigate these costs by facilitating the movement of Gulf Coast imports upriver at reduced expenses.
California is a unique market, emphasizing high-value horticulture and a strong demand for specialty fertilizers. The state's product portfolio predominantly includes controlled-release and liquid nutrients to enable precise application. Strict environmental regulations under the Irrigated Lands Regulatory Program are promoting the use of enhanced-efficiency products and soil moisture sensors to reduce nutrient leaching. Logistics in California remain a critical factor in market operations.
Competitive Landscape
The United States fertilizers market is moderately concentrated, with key players adopting integrated models to strengthen their market positions. Nutrien Ltd leads the market through a comprehensive approach encompassing production, distribution, and a 1,700-store retail network. CF Industries Holdings, Inc., capitalizes on low-cost nitrogen production, supported by access to Gulf Coast natural gas. Mosaic maintains a strong presence through phosphate mining operations in Florida and Louisiana. Market integration is on the rise, exemplified by Koch's USD 3.6 billion acquisition of Iowa Fertilizer Company, which consolidates 1.4 million metric tons of nitrogen capacity and enhances upstream control in 2024.
Investment in technology has become a key differentiator among market players. Major suppliers allocate USD 200-300 million annually to digital agronomy services, which combine soil analytics with prescription-based sales. These platforms strengthen customer relationships, foster product loyalty, and generate subscription-based revenue streams beyond traditional tonnage sales. Additionally, specialty fertilizers represent a significant growth opportunity. Smaller companies, such as Haifa Group and ICL, leverage product innovation and technical support to establish profitable niches in horticulture and turf markets. Regulatory and carbon-related pressures are projected to drive further market realignment, favoring companies that provide proven solutions for nutrient efficiency and emission reduction.
Natural gas price volatility remains a critical factor influencing the market. Producers with hedged feedstock or green ammonia projects on the Gulf Coast cost advantages. Imports also play a stabilizing role, with North American producers closely monitoring global price spreads to identify export opportunities. The introduction of new low-carbon product grades that attract premium contracts further shapes the competitive landscape. Overall, the market is transitioning from volume-based competition to a focus on service-driven and sustainability-oriented value propositions.
United States Fertilizers Industry Leaders
CF Industries Holdings, Inc.
Nutrien Ltd.
The Andersons Inc.
The Mosaic Company
Yara International ASA
- *Disclaimer: Major Players sorted in no particular order

Recent Industry Developments
- November 2024: The Andersons, Inc. launched Aero-Blitz and Aero-Mino, low-rate aerial-application fertilizers suitable for drones, helicopters, and aircraft. The new products are designed to enhance nutrient efficiency and coverage in U.S. row-crop production.
- October 2024: ICL launched the Peters Professional Canna+ fertilizer system, designed specifically for the North American market. Each component of the Peters Professional Canna+ CEA program has been carefully selected to support hydroponic cannabis cultivation in controlled growing environments.
- June 2023: ICL launched a new line of water-soluble fertilizers under its Nova brand. These include Nova PULSE, Nova FINISH, Nova ELEVATE, and Nova FLOW, designed for high-performance fertigation and foliar solutions.


United States Fertilizers Market Report Scope
Fertilizer is a substance added to soil to enhance its fertility. Plant nutrients are chemical elements or compounds that are essential for plant growth.
The United States fertilizers market is segmented by type (complex and straight), form (conventional and specialty), application method (fertigation, foliar, and soil), and crop type (field crops, horticultural crops, and turf and ornamental). The market forecasts are provided in terms of value (USD) and volume (metric tons).
By Type
| Complex | ||
| Straight | Micronutrients | Boron |
| Copper | ||
| Iron | ||
| Manganese | ||
| Molybdenum | ||
| Zinc | ||
| Others | ||
| Nitrogenous | Ammonium Nitrate | |
| Anhydrous Ammonia | ||
| Urea | ||
| Others | ||
| Phosphatic | Di-ammonium Phosphate (DAP) | |
| Monoammonium phosphate (MAP) | ||
| Single Super Phosphate (SSP) | ||
| Triple Superphosphate (TSP) | ||
| Potassic | Muriate of Potassium (MoP) | |
| Sulphate of Potash (SoP) | ||
| Others | ||
| Secondary Macronutrients | Calcium | |
| Magnesium | ||
| Sulfur | ||
By Form
| Conventional | |
| Specialty | Controlled Release Fertilizers (CRF) |
| Liquid Fertilizer | |
| Slow-release fertilizers (SRF) | |
| Water Soluble |
By Application Method
| Soil |
| Foliar |
| Fertigation |
By Crop Type
| Field Crops |
| Horticultural Crops |
| Turf and Ornamental |
| By Type | Complex | ||
| Straight | Micronutrients | Boron | |
| Copper | |||
| Iron | |||
| Manganese | |||
| Molybdenum | |||
| Zinc | |||
| Others | |||
| Nitrogenous | Ammonium Nitrate | ||
| Anhydrous Ammonia | |||
| Urea | |||
| Others | |||
| Phosphatic | Di-ammonium Phosphate (DAP) | ||
| Monoammonium phosphate (MAP) | |||
| Single Super Phosphate (SSP) | |||
| Triple Superphosphate (TSP) | |||
| Potassic | Muriate of Potassium (MoP) | ||
| Sulphate of Potash (SoP) | |||
| Others | |||
| Secondary Macronutrients | Calcium | ||
| Magnesium | |||
| Sulfur | |||
| By Form | Conventional | ||
| Specialty | Controlled Release Fertilizers (CRF) | ||
| Liquid Fertilizer | |||
| Slow-release fertilizers (SRF) | |||
| Water Soluble | |||
| By Application Method | Soil | ||
| Foliar | |||
| Fertigation | |||
| By Crop Type | Field Crops | ||
| Horticultural Crops | |||
| Turf and Ornamental | |||


Market Definition
- MARKET ESTIMATION LEVEL - Market Estimations for various types of fertilizers has been done at the product-level and not at the nutrient-level.
- NUTRIENT TYPES COVERED - Primary Nutrients: N, P and K, Secondary Macronutrients: Ca, Mg and S, Micronutients: Zn, Mn, Cu, Fe, Mo, B, and Others
- AVERAGE NUTRIENT APPLICATION RATE - This refers to the average volume of nutrient consumed per hectare of farmland in each country.
- CROP TYPES COVERED - Field Crops: Cereals, Pulses, Oilseeds, and Fiber Crops Horticulture: Fruits, Vegetables, Plantation Crops and Spices, Turf Grass and Ornamentals
| Keyword | Definition |
|---|---|
| Fertilizer | Chemical substance applied to crops to ensure nutritional requirements, available in various forms such as granules, powders, liquid, water soluble, etc. |
| Specialty Fertilizer | Used for enhanced efficiency and nutrient availability applied through soil, foliar, and fertigation. Includes CRF, SRF, liquid fertilizer, and water soluble fertilizers. |
| Controlled-Release Fertilizers (CRF) | Coated with materials such as polymer, polymer-sulfur, and other materials such as resins to ensure nutrient availability to the crop for its entire life cycle. |
| Slow-Release Fertilizers (SRF) | Coated with materials such as sulfur, neem, etc., to ensure nutrient availability to the crop for a longer period. |
| Foliar Fertilizers | Consist of both liquid and water soluble fertilizers applied through foliar application. |
| Water-Soluble Fertilizers | Available in various forms including liquid, powder, etc., used in foliar and fertigation mode of fertilizer application. |
| Fertigation | Fertilizers applied through different irrigation systems such as drip irrigation, micro irrigation, sprinkler irrigation, etc. |
| Anhydrous Ammonia | Used as fertilizer, directly injected into the soil, available in gaseous liquid form. |
| Single Super Phosphate (SSP) | Phosphorus fertilizer containing only phosphorus which has lesser than or equal to 35%. |
| Triple Super Phosphate (TSP) | Phosphorus fertilizer containing only phosphorus greater than 35%. |
| Enhanced Efficiency Fertilizers | Fertilizers coated or treated with additional layers of various ingredients to make it more efficient compared to other fertilizers. |
| Conventional Fertilizer | Fertilizers applied to crops through traditional methods including broadcasting, row placement, ploughing soil placement, etc. |
| Chelated Micronutrients | Micronutrient fertilizers coated with chelating agents such as EDTA, EDDHA, DTPA, HEDTA, etc. |
| Liquid Fertilizers | Available in liquid form, majorly used for application of fertilizers to crops through foliar and fertigation. |


Research Methodology
Mordor Intelligence follows a four-step methodology in all our reports.
- Step-1: IDENTIFY KEY VARIABLES: In order to build a robust forecasting methodology, the variables and factors identified in Step-1 are tested against available historical market numbers. Through an iterative process, the variables required for market forecast are set and the model is built on the basis of these variables.
- Step-2: Build a Market Model: Market-size estimations for the forecast years are in nominal terms. Inflation is not a part of the pricing, and the average selling price (ASP) is kept constant throughout the forecast period for each country.
- Step-3: Validate and Finalize: In this important step, all market numbers, variables and analyst calls are validated through an extensive network of primary research experts from the market studied. The respondents are selected across levels and functions to generate a holistic picture of the market studied.
- Step-4: Research Outputs: Syndicated Reports, Custom Consulting Assignments, Databases & Subscription Platforms


