Market Overview
| Study Period | 2021 - 2031 |
|---|---|
| Forecast Data Period | 2026 - 2031 |
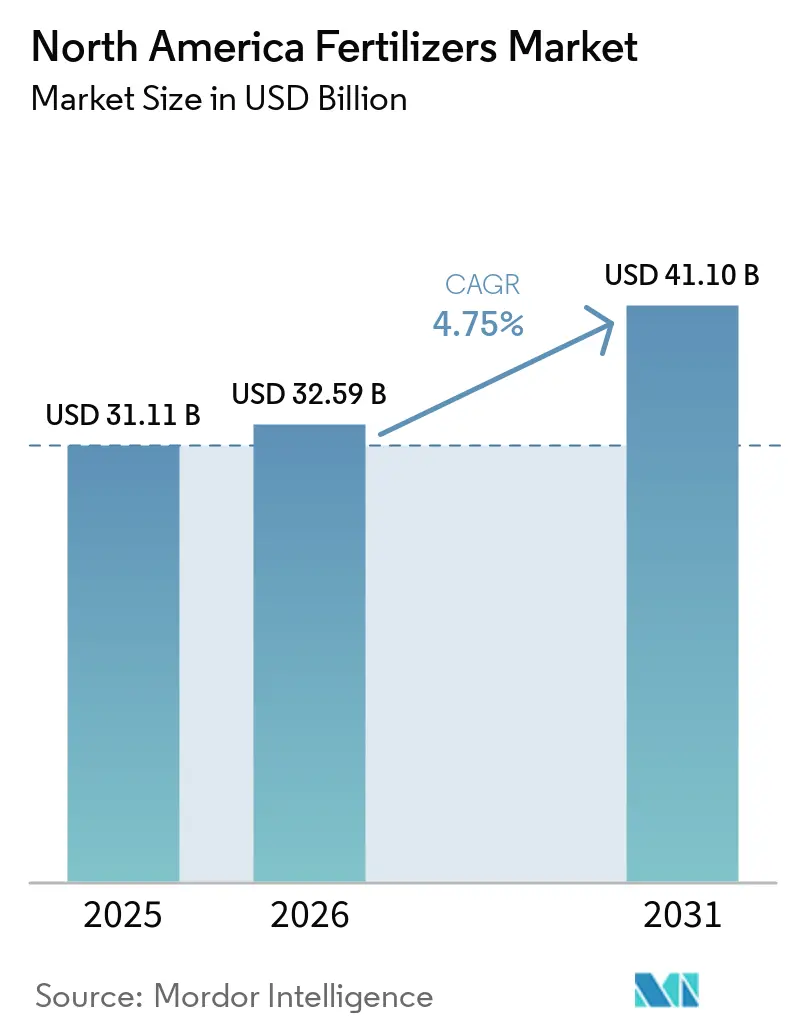
| Base Year Market Size (2025) | USD 31.11 Billion |
| Market Size (2026) | USD 32.59 Billion |
| Market Size (2031) | USD 41.10 Billion |
| Growth Rate (2026 - 2031) | 4.75% CAGR |
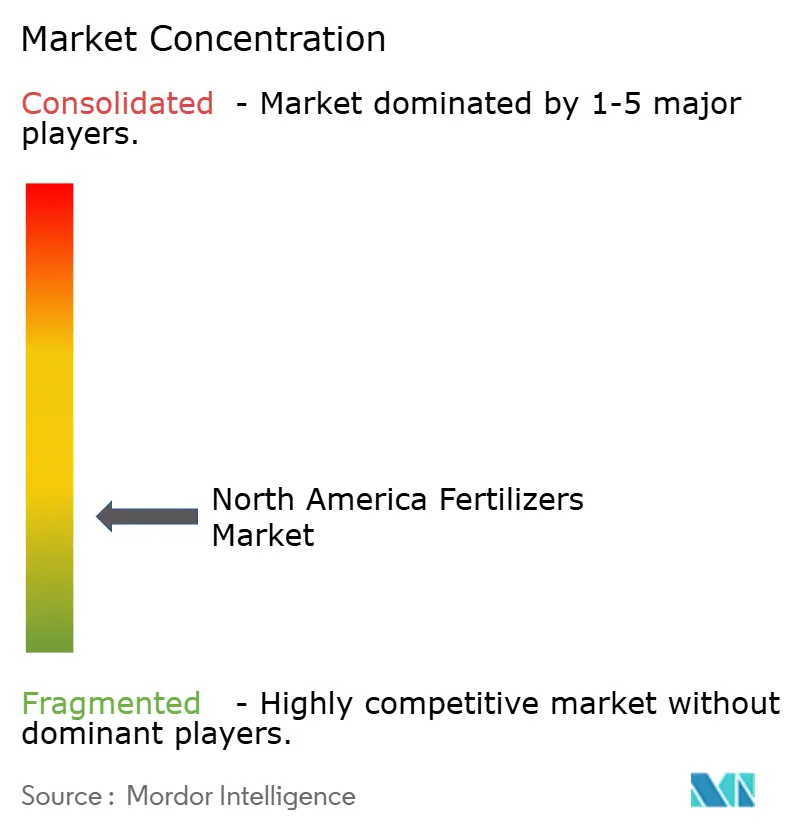
| Market Concentration | Low |
Major Players*Disclaimer: Major Players sorted in no particular order Image © Mordor Intelligence. Reuse requires attribution under CC BY 4.0. | |
North America Fertilizers Market Analysis by Mordor Intelligence
The North America fertilizers market size is projected to expand from USD 31.11 billion in 2025 to USD 32.59 billion in 2026, reaching USD 41.10 billion by 2031, at a CAGR of 4.75% during the 2026–2031 period. Federal clean-hydrogen incentives, biofuel blending mandates, and steady corn-and-soybean acreage are reshaping nutrient budgets, while natural-gas volatility is accelerating interest in green ammonia. Controlled-environment agriculture and regenerative practices are driving demand for water-soluble, micronutrient-fortified blends that command premium pricing. Investments in rail and coating capacity are tightening supply chains and boosting specialty margins. Meanwhile, tightening runoff rules in the Great Lakes basin and expanded manure recycling temper overall volume growth.
Key Report Takeaways
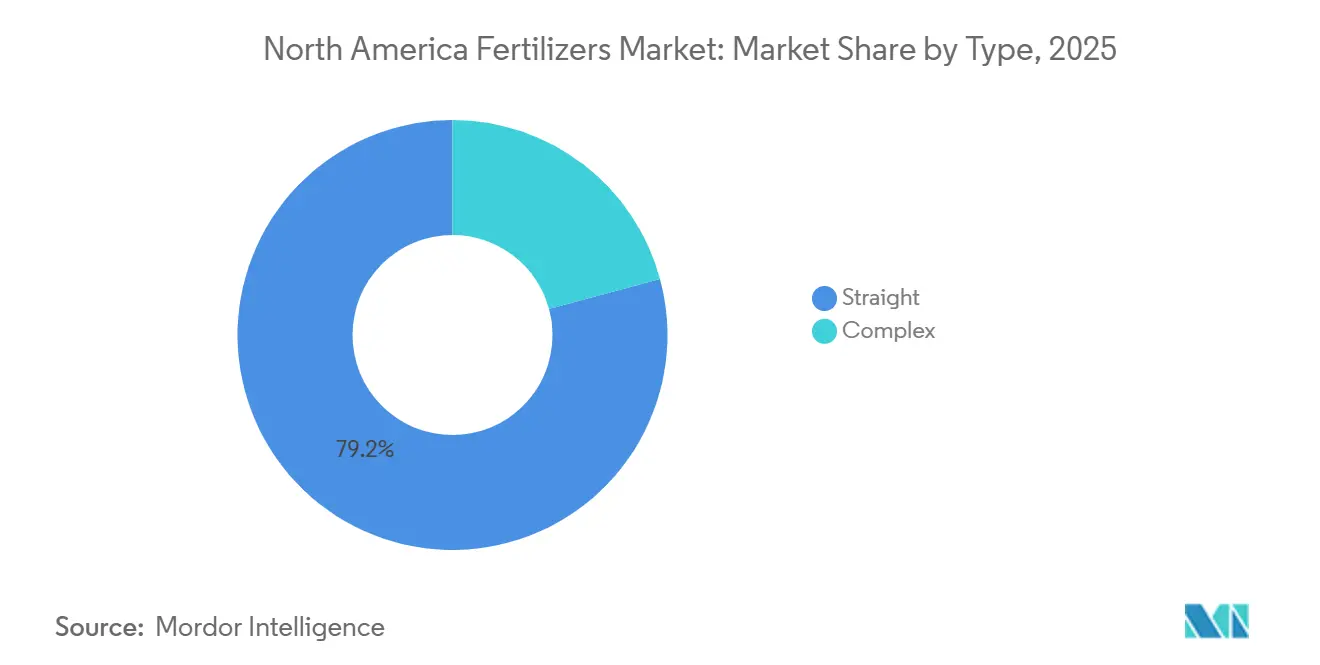
- By type, straight fertilizers accounted for the largest North America fertilizers market share of 79.2% in 2025, while complex fertilizers are projected to be the fastest-growing segment, advancing at a CAGR of 7.1% from 2026 to 2031.
- By form, conventional fertilizers held the largest North America fertilizers market size in 2025, accounting for an 83.4% share, whereas specialty fertilizers are forecast to register the highest growth rate at a CAGR of 5.9% through 2031.
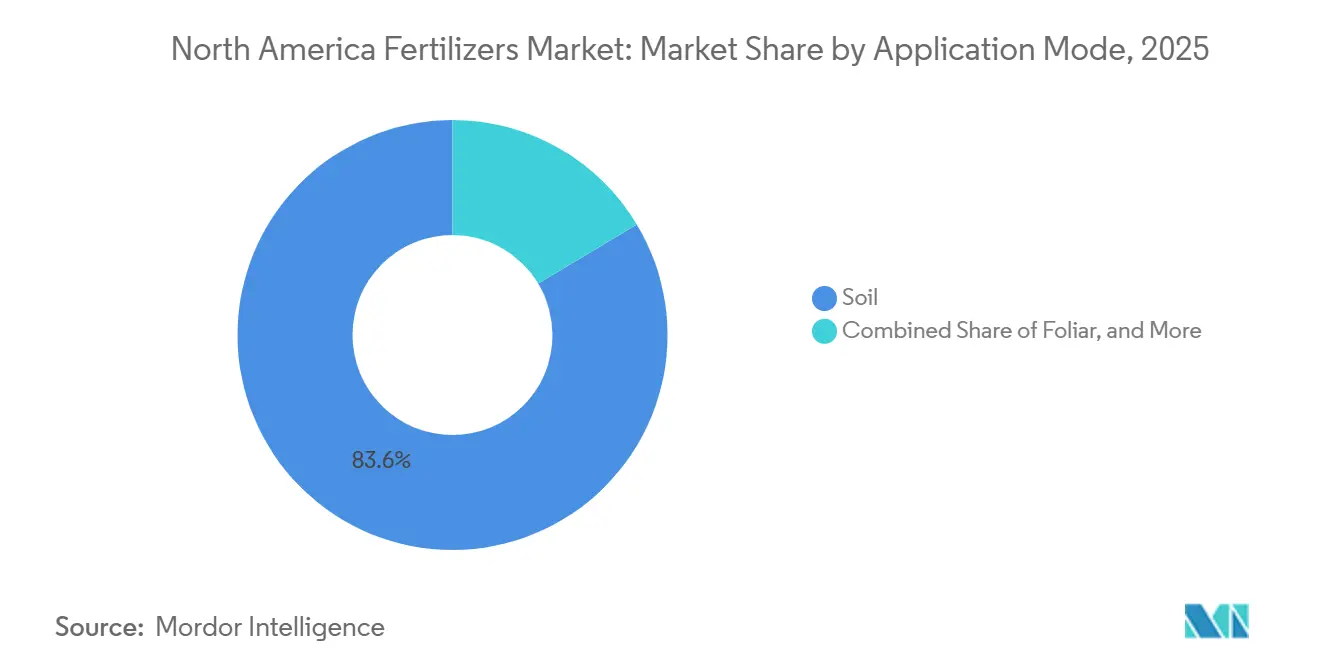
- By application mode, soil application represented the largest share of the market, accounting for 83.6% in 2025, while fertigation is projected to be the fastest-growing segment, expanding at a CAGR of 6.2% from 2026 to 2031.
- By crop type, field crops captured the largest share of the market in 2025, accounting for 86.9%, whereas horticultural crops are projected to grow at the fastest CAGR of 6.4% through 2031.
- By geography, the United States accounted for the largest market share of 47.8% in 2025, while Canada is projected to be the fastest-growing regional market, advancing at a CAGR of 5.7% from 2026 to 2031.
Note: Market size and forecast figures in this report are generated using Mordor Intelligence’s proprietary estimation framework, updated with the latest available data and insights as of 2026.
North America Fertilizers Market Trends and Insights
Drivers Impact Analysis*
| Driver | (~) % Impact on CAGR Forecast | Geographic Relevance | Impact Timeline |
|---|---|---|---|
| Expansion of United States corn and soy acreage | +0.8% | United States, concentrated in Midwest Corn Belt and Great Plains | Medium term (2-4 years) |
| Federal and state incentives for green-ammonia plants | +0.9% | United States, Gulf Coast and Midwest hubs; early adoption in Canada Alberta | Long term (≥ 4 years) |
| Biofuel blending mandates boosting nitrogen demand | +0.7% | United States, with spillover to Canadian canola biodiesel | Medium term (2-4 years) |
| Controlled-environment agriculture requiring water-soluble NPK | +0.6% | United States and Canada, urban clusters and California greenhouse zones | Medium term (2-4 years) |
| Regenerative farming driving micronutrient blends | +0.5% | United States and Canada, early gains in Iowa, Illinois, and Ontario | Long term (≥ 4 years) |
| Climate-smart commodity funding accelerating Controlled-Release Fertilizers adoption | +0.7% | United States, United States Department of Agriculture (USDA) partnership projects in Midwest and Southeast | Medium term (2-4 years) |
| Source: Mordor Intelligence | |||
Expansion of United States Corn and Soy Acreage
Corn and soybean plantings remain the backbone of nitrogen and phosphate demand, with the United States Department of Agriculture (USDA) placing 2025 corn and soybean acreage as the primary drivers of domestic nutrient consumption [1]Source: USDA National Agricultural Statistics Service, “Crop Production 2025 Summary,” usda.gov. That footprint equates to roughly 12 million metric tons of nitrogen demand at typical agronomic rates. Renewable Fuel Standard volumes anchor domestic grain use, so growers maintain fertilizer budgets even when futures slip below USD 40.14 per kg. Processors are adding 10.9 million metric tons of crush capacity, supporting soybean acreage growth and diversifying nutrient mixes. Precision platforms that enable split nitrogen applications have raised interest in stabilized urea and liquid urea-ammonium-nitrate (UAN), products that carry USD 20–30 per metric ton premiums. Strong spring acreage also tightens phosphate inventories, sending diammonium phosphate (DAP) prices higher during the peak application window.
Federal and State Incentives for Green-Ammonia Plants
The Inflation Reduction Act’s Section 45V credit of up to USD 3 per kilogram for low-carbon hydrogen translates to a USD 400–500 per metric ton cost offset for green ammonia, underpinning multiple feasibility studies along the Gulf Coast [2]Source: United States Department of Energy, “Clean Hydrogen Production Tax Credit,” energy.gov. Iowa and Texas add their own property- and production-tax breaks, tipping early-stage economics in favor of electrolysis projects that leverage existing ammonia infrastructure. Early movers are securing offtake with food companies seeking Scope 3 reductions at premiums of USD 50–100 per metric ton. Actual build-out speed depends on transmission upgrades capable of feeding gigawatt-scale electrolysers, a bottleneck that could delay first commercial volumes by up to two years.
Biofuel Blending Mandates Boosting Nitrogen Demand
Renewable diesel and ethanol standards lock in roughly 139.7 million metric tons of corn and 3.63 million metric tons of soybean oil annually, stabilizing 35 million corn acres and 10 million soybean acres regardless of export swings [3]Source: United States Environmental Protection Agency, “Renewable Fuel Standard Program,” epa.gov. California’s Low-Carbon Fuel Standard intensifies the pull, raising crush margins that favor soybean acreage over wheat and shifting regional fertilizer demand toward phosphate and potash. Continuous corn-soy rotations deplete zinc and manganese, spurring prophylactic micronutrient programs. Retailers bundling nitrogen, phosphate, and micronutrients onto a single invoice are capturing a greater share of producer spending.
Controlled-Environment Agriculture Requiring Water-Soluble NPK
Acreage under glass or vertical lights surpassed 15,000 acres in 2025, driven by consumer demand for year-round, locally grown produce. These systems depend on fully water-soluble formulations that maintain electrical conductivity targets without clogging emitters. Tomato growers report 10–15% yield lifts from biweekly micronutrient foliar sprays, justifying fertilizer costs of USD 1,500–2,500 per metric ton. Formulators must source low-cadmium phosphate rock to meet heavy-metal thresholds, constraining raw-material options and supporting premium prices.
Restraints Impact Analysis*
| Restraint | (~) % Impact on CAGR Forecast | Geographic Relevance | Impact Timeline |
|---|---|---|---|
| Volatile natural-gas prices inflating nitrogen costs | -0.9% | United States and Canada, concentrated in ammonia production hubs | Short term (≤ 2 years) |
| Stricter regulations on phosphate runoff in Great Lakes basin | -0.5% | United States, Michigan, Wisconsin, Minnesota, and Ohio watersheds | Medium term (2-4 years) |
| On-farm manure nutrient recycling curbing synthetic demand | -0.4% | United States and Canada, livestock-dense regions in Iowa, North Carolina, and Alberta | Long term (≥ 4 years) |
| Potash logistics bottlenecks via St. Lawrence Seaway | -0.3% | United States and Canada, Midwest and Eastern regions dependent on Canadian imports | Short term (≤ 2 years) |
| Source: Mordor Intelligence | |||
Volatile Natural-Gas Prices Inflating Nitrogen Costs
Natural gas represents up to 80% of ammonia manufacturing cost, so a USD 1 per million British thermal units swing at Henry Hub moves cash costs by roughly USD 30 per metric ton. Prices fluctuated between USD 1.80 and USD 3.50 per million British thermal units from mid-2025 to early 2026, squeezing producers with spot exposure and prompting short-notice plant curtailments. Growers hedge by delaying purchases, which shifts inventory risk to distributors. Higher gas prices also narrow the cost gap between fossil-based and green ammonia, accelerating interest in renewables-powered supply.
Stricter Regulations on Phosphate Runoff in Great Lakes Basin
The Environmental Protection Agency and Great Lakes states finalized a 40% phosphorus-loading reduction target by 2030, cutting allowable Diammonium Phosphate (DAP) and mono-ammonium phosphate (MAP) rates by up to one-third on 8 million corn and soybean acres. Enhanced-efficiency phosphate products reduce runoff but cost USD 50–80 per metric ton more than commodity grades. Soil-test phosphorus levels above 50 parts per million are barred from new phosphate applications until levels fall, compelling growers to adopt foliar applications and precision banding.
*Our forecasts treat driver/restraint impacts as directional, not additive. The impact forecasts reflect baseline growth, mix effects, and variable interactions.
Segment Analysis
By Type: Straight Fertilizers Dominate Market Share, Complex Fertilizers Accelerate Expansion
By type, straight fertilizers are the largest segment, accounting for 79.2% of the North America fertilizers market share in 2025, buoyed by the cost advantages of urea, anhydrous ammonia, and Diammonium Phosphate (DAP). These single-nutrient products flow through cooperative storage and 60-foot spreaders with minimal handling adjustments. Complex fertilizers are the fastest-growing segment, projected to expand at a 7.1% CAGR from 2026 to 2031, as greenhouse operators and regenerative programs pay premiums for balanced NPK-plus-micronutrient formulations that reduce labor passes and nutrient lock-up.
The North America fertilizers market for complex products remains limited. However, polymer-bound formulations combining nitrogen, phosphorus, potassium, and sulfur are gaining traction in corn cultivation, particularly where split applications are not feasible. Micronutrient straights such as zinc sulfate are rising 15% per year, addressing cover-crop-induced deficiencies that can shave 254 kg per acre from corn yields if untreated.


By Form: Conventional Granules Dominate, Specialty Formats Capture Precision Niches
Conventional granules are the largest segment, accounting for 83.4% of the North America fertilizer market size in 2025, reflecting infrastructure geared to handle bulk urea and mono-ammonium phosphate (MAP). Retailers typically pre-book 10,000–20,000 metric tons of granular stock each fall, assuring same-day pickup to growers during narrow application windows. Specialty forms are the fastest-growing segment, growing at 5.9% from 2026 to 2031, led by polymer-coated urea, which releases nutrients over 90–120 days, and liquid Urea Ammonium Nitrate (UAN), suited to variable-rate rigs.
Where the North America fertilizers market is concentrated in commodity granules, specialty liquids already account for 25% of premium sales, especially on high-value lettuce, strawberry, and potato acres that depend on fertigation. Water-soluble powders fetch USD 2,000 per metric ton but win on total production costs because they reduce labor requirements, improve nutrient-use efficiency, minimize application losses, and lower runoff compliance expenses for growers operating under tightening environmental regulations.
By Application Mode: Soil Broadcasting Prevails, Fertigation Gains in Precision Systems
Soil is the largest segment with an 83.6% share in 2025 due to 24-row applicators that can cover 800 acres per day. Yet volatilization concerns have growers adding urease inhibitors to 40% of the urea volume in the North America fertilizers market to safeguard yields during dry spells. Fertigation is the fastest-growing segment, projected to achieve a 6.2% CAGR from 2026 to 2031. This growth is driven by drip and center-pivot retrofits, which allow corn, almond, and vegetable producers to align nutrient application with real-time sensor data.
Foliar programs account for roughly 10% of the North America fertilizers market but are expanding in manganese-deficient soybean and zinc-deficient corn belts. Tightening aerial-application windows and humidity constraints limit acreage, yet yield lifts in trial fields justify continued experimentation. The shift toward fertigation and foliar applications benefits suppliers like Yara and Haifa that offer liquid and water-soluble formulations, yet it also fragments the market, as growers demand smaller packages rather than bulk tankers, which increase handling costs and reduce distributor margins.
By Crop Type: Field Crops Command Volume, Horticultural Segments Drive Value
By crop type, field crops, including corn, soybeans, wheat, and cotton, are the largest segment, accounting for 86.9% of the market share in 2025. This segment forms the foundation of the North America fertilizers market. These crops play a critical role in driving fertilizer demand due to their extensive cultivation and nutrient requirements. Corn alone consumes half of the regional nitrogen supply, maintaining demand for urea and anhydrous ammonia even during periods of price declines. The significant reliance on these fertilizers highlights their importance in supporting crop yields and meeting the region's agricultural productivity goals.
Horticultural crops are the fastest-growing segment, rising at a 6.4% CAGR from 2026 to 2031, because greenhouse tomatoes, tree fruit, and almonds require water-soluble and controlled-release inputs that cost 4 to 6 times those of commodity grades. The North America fertilizers market share for horticulture will widen as urban consumers support premium pricing and retailers bundle agronomic advice with micronutrient blends.
Geography Analysis
The United States dominated with a 47.8% share in 2025. The United States consumes roughly three-quarters of all fertilizers sold in North America, driven by 180 million acres of row crops that translate into 8–10 million metric tons of nitrogen demand. Federal biofuel mandates stabilize corn acreage, anchoring nitrogen offtake even during export downturns. Great Lakes runoff rules, conversely, could reduce annual phosphate demand by up to 200,000 metric tons. California’s greenhouse and nut orchards, though small in acreage, command nearly 15% of regional fertilizer revenue because they rely on high-value water-soluble blends.
Canada is projected to have the fastest growth rate of 5.7% from 2026 to 2031. Canada’s emissions-intensity target of a 30% cut below 2020 levels by 2030 is spurring carbon-capture retrofits at Alberta ammonia plants and premium sales of controlled-release and nitrification-inhibited products. Canola acreage of 22 million acres keeps sulfur-coated urea and ammonium sulfate in strong demand. Livestock manure recycling in cattle-dense Alberta could shave 5–8% off synthetic purchases by 2030.
Mexico’s fertilizer demand hinges on subsidy programs that delivered 1.5 million metric tons of urea and DAP to smallholders in 2025. Budget constraints have opened space for private distributors supplying specialty blends to export-oriented greenhouse vegetable growers in Sinaloa and Baja California, where fertigation systems favor fully soluble grades priced at USD 1,800–2,200 per metric ton. Central America and Caribbean islands together represent less than 2% of regional fertilizer volume and rely heavily on chloride-free potassium sulfate for banana and coffee estates.
Competitive Landscape
The top five producers, Nutrien Ltd., CF Industries Holdings, Inc., The Andersons Inc., Yara International ASA, and The Mosaic Company, give the North America fertilizers market a low concentration profile. Nutrien Ltd’s integrated model spans mining to 1,500 retail outlets, enabling cross-selling of seed and crop protection services to increase customer stickiness. CF Industries Holdings, Inc. locks in sub-USD 2.50 per million British thermal units gas contracts tied to Appalachian supply, delivering a USD 80–100 per metric ton cost edge on ammonia during volatile markets. Mosaic leverages low-cost phosphate rock and, via its 2025 joint venture with Bunge, adds logistics advantages on Mississippi River routes.
White-space growth is centered on polymer-coated urea and green ammonia. Polymer-coated urea currently serves only 8% of nitrogen demand but generates gross margins north of 30%, and green ammonia attracts carbon-credit premiums of USD 50–100 per metric ton, de-risking early projects. Technology partnerships—for example, Yara integrating its digital agronomy platform with John Deere equipment—illustrate how data services are becoming competitive differentiators.
Start-ups converting manure into nutrient concentrates and digestate threaten to erode local synthetic demand. Legacy players are responding by investing in rail terminals to bypass Saint Lawrence Seaway constraints and by filing patents on next-generation inhibitors and coatings that lock in premium positions.
North America Fertilizers Industry Leaders
CF Industries Holdings, Inc.
Nutrien Ltd.
The Andersons Inc.
The Mosaic Company
Yara International ASA
- *Disclaimer: Major Players sorted in no particular order

Recent Industry Developments
- October 2024: CF Industries Holdings, Inc. has invested USD 200 million to incorporate carbon capture technology at its Donaldsonville complex, aiming to sequester 2 million metric tons of CO₂ annually by 2027. This initiative expands the availability of certified low-carbon nitrogen in the region, enabling the company to achieve sustainability premiums and support growers in meeting emerging scope-three emission targets.
- September 2024: Nutrien Ltd. acquired Waypoint Analytical for USD 85 million, adding fifteen soil laboratories to enhance precision recommendations. This expanded diagnostics network is driving demand for variable-rate and specialty fertilizer blends, supporting the transition to data-driven fertilizer prescriptions across North America.
- August 2024: The Mosaic Company initiated a USD 150 million expansion of its phosphate mine in Florida, increasing annual capacity by 500,000 metric tons. This expansion aims to enhance domestic phosphate supply, mitigate risks from import disruptions, and stabilize pricing for growers through the rest of the decade.


North America Fertilizers Market Report Scope
Fertilizers are substances added to soil or plants to provide essential nutrients that promote growth and increase crop yield.
The North America fertilizers market report is segmented by type (complex and straight), by form (conventional and specialty), by application mode (soil, foliar, and fertigation), by crop type (field crops, horticultural crops, turf and ornamental), and by geography (the United States, Canada, Mexico, and Rest of North America). The market forecasts are provided in terms of value (USD) and volume (metric tons).
By Type
| Complex | ||
| Straight | Micronutrients | Boron |
| Copper | ||
| Iron | ||
| Manganese | ||
| Molybdenum | ||
| Zinc | ||
| Others | ||
| Nitrogenous | Ammonium Nitrate | |
| Anhydrous Ammonia | ||
| Urea | ||
| Others | ||
| Phosphatic | Diammonium Phosphate (DAP) | |
| Monoammonium Phosphate (MAP) | ||
| Single Super Phosphate (SSP) | ||
| Triple Super Phosphate (TSP) | ||
| Others | ||
| Potassic | Muriate of Potash (MoP) | |
| Sulfate of Potash (SoP) | ||
| Others | ||
| Secondary Macronutrients | Calcium | |
| Magnesium | ||
| Sulfur | ||
By Form
| Conventional | |
| Specialty | Controlled-Release Fertilizers (CRF) |
| Liquid Fertilizer | |
| Slow-Release Fertilizers (SRF) | |
| Water Soluble |
By Application Mode
| Fertigation |
| Foliar |
| Soil |
By Crop Type
| Field Crops |
| Horticultural Crops |
| Turf And Ornamental |
By Geography
| United States |
| Canada |
| Mexico |
| Rest of North America |
| By Type | Complex | ||
| Straight | Micronutrients | Boron | |
| Copper | |||
| Iron | |||
| Manganese | |||
| Molybdenum | |||
| Zinc | |||
| Others | |||
| Nitrogenous | Ammonium Nitrate | ||
| Anhydrous Ammonia | |||
| Urea | |||
| Others | |||
| Phosphatic | Diammonium Phosphate (DAP) | ||
| Monoammonium Phosphate (MAP) | |||
| Single Super Phosphate (SSP) | |||
| Triple Super Phosphate (TSP) | |||
| Others | |||
| Potassic | Muriate of Potash (MoP) | ||
| Sulfate of Potash (SoP) | |||
| Others | |||
| Secondary Macronutrients | Calcium | ||
| Magnesium | |||
| Sulfur | |||
| By Form | Conventional | ||
| Specialty | Controlled-Release Fertilizers (CRF) | ||
| Liquid Fertilizer | |||
| Slow-Release Fertilizers (SRF) | |||
| Water Soluble | |||
| By Application Mode | Fertigation | ||
| Foliar | |||
| Soil | |||
| By Crop Type | Field Crops | ||
| Horticultural Crops | |||
| Turf And Ornamental | |||
| By Geography | United States | ||
| Canada | |||
| Mexico | |||
| Rest of North America | |||


Market Definition
- MARKET ESTIMATION LEVEL - Market Estimations for various types of fertilizers has been done at the product-level and not at the nutrient-level.
- NUTRIENT TYPES COVERED - Primary Nutrients: N, P and K, Secondary Macronutrients: Ca, Mg and S, Micronutients: Zn, Mn, Cu, Fe, Mo, B, and Others
- AVERAGE NUTRIENT APPLICATION RATE - This refers to the average volume of nutrient consumed per hectare of farmland in each country.
- CROP TYPES COVERED - Field Crops: Cereals, Pulses, Oilseeds, and Fiber Crops Horticulture: Fruits, Vegetables, Plantation Crops and Spices, Turf Grass and Ornamentals
| Keyword | Definition |
|---|---|
| Fertilizer | Chemical substance applied to crops to ensure nutritional requirements, available in various forms such as granules, powders, liquid, water soluble, etc. |
| Specialty Fertilizer | Used for enhanced efficiency and nutrient availability applied through soil, foliar, and fertigation. Includes CRF, SRF, liquid fertilizer, and water soluble fertilizers. |
| Controlled-Release Fertilizers (CRF) | Coated with materials such as polymer, polymer-sulfur, and other materials such as resins to ensure nutrient availability to the crop for its entire life cycle. |
| Slow-Release Fertilizers (SRF) | Coated with materials such as sulfur, neem, etc., to ensure nutrient availability to the crop for a longer period. |
| Foliar Fertilizers | Consist of both liquid and water soluble fertilizers applied through foliar application. |
| Water-Soluble Fertilizers | Available in various forms including liquid, powder, etc., used in foliar and fertigation mode of fertilizer application. |
| Fertigation | Fertilizers applied through different irrigation systems such as drip irrigation, micro irrigation, sprinkler irrigation, etc. |
| Anhydrous Ammonia | Used as fertilizer, directly injected into the soil, available in gaseous liquid form. |
| Single Super Phosphate (SSP) | Phosphorus fertilizer containing only phosphorus which has lesser than or equal to 35%. |
| Triple Super Phosphate (TSP) | Phosphorus fertilizer containing only phosphorus greater than 35%. |
| Enhanced Efficiency Fertilizers | Fertilizers coated or treated with additional layers of various ingredients to make it more efficient compared to other fertilizers. |
| Conventional Fertilizer | Fertilizers applied to crops through traditional methods including broadcasting, row placement, ploughing soil placement, etc. |
| Chelated Micronutrients | Micronutrient fertilizers coated with chelating agents such as EDTA, EDDHA, DTPA, HEDTA, etc. |
| Liquid Fertilizers | Available in liquid form, majorly used for application of fertilizers to crops through foliar and fertigation. |


Research Methodology
Mordor Intelligence follows a four-step methodology in all our reports.
- Step-1: IDENTIFY KEY VARIABLES: In order to build a robust forecasting methodology, the variables and factors identified in Step-1 are tested against available historical market numbers. Through an iterative process, the variables required for market forecast are set and the model is built on the basis of these variables.
- Step-2: Build a Market Model: Market-size estimations for the forecast years are in nominal terms. Inflation is not a part of the pricing, and the average selling price (ASP) is kept constant throughout the forecast period for each country.
- Step-3: Validate and Finalize: In this important step, all market numbers, variables and analyst calls are validated through an extensive network of primary research experts from the market studied. The respondents are selected across levels and functions to generate a holistic picture of the market studied.
- Step-4: Research Outputs: Syndicated Reports, Custom Consulting Assignments, Databases & Subscription Platforms


