North America Snack Bar Market Size and Share
Market Overview
| Study Period | 2021 - 2031 |
|---|---|
| Forecast Data Period | 2026 - 2031 |
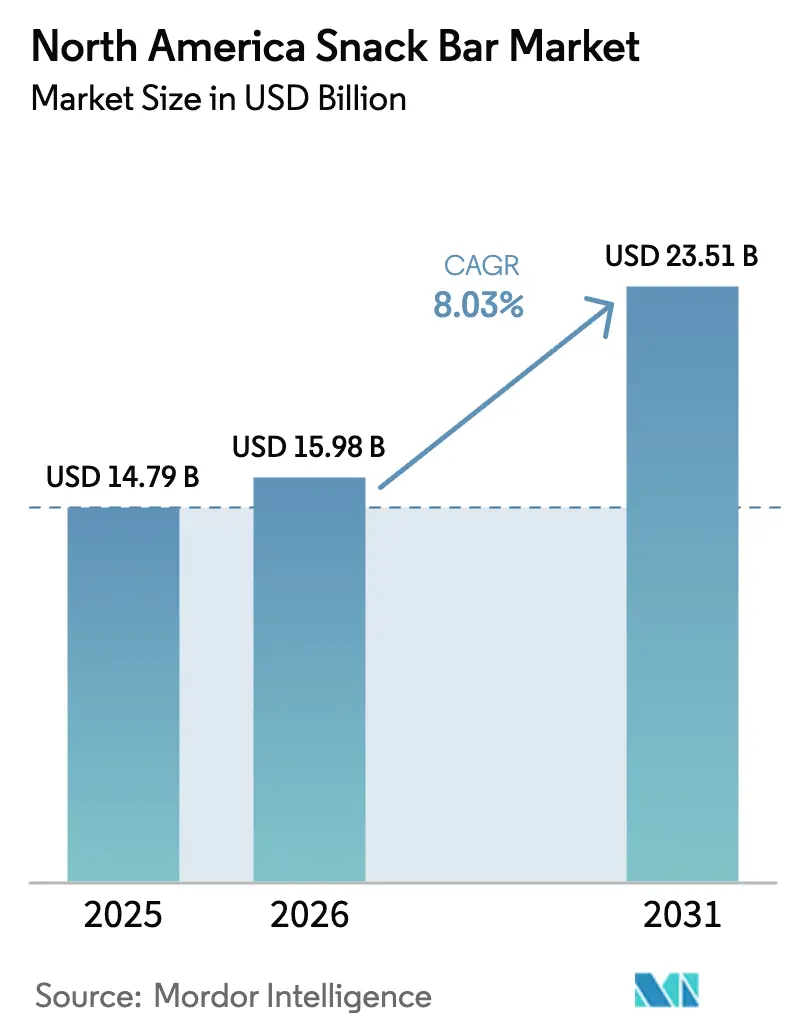
| Base Year Market Size (2025) | USD 14.79 Billion |
| Market Size (2026) | USD 15.98 Billion |
| Market Size (2031) | USD 23.51 Billion |
| Growth Rate (2026 - 2031) | 8.03% CAGR |
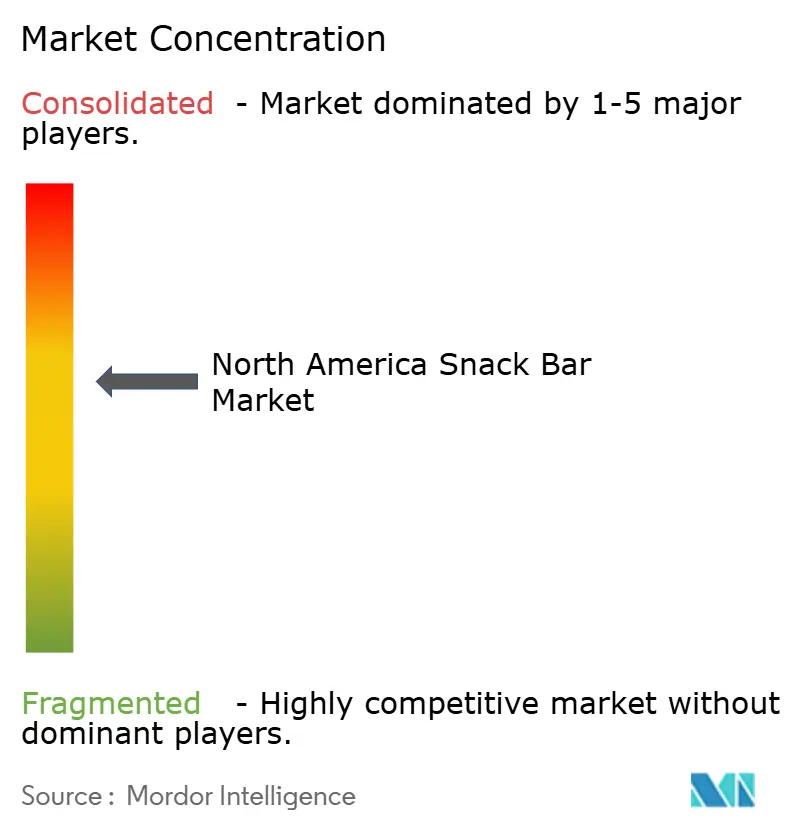
| Market Concentration | Medium |
Major Players*Disclaimer: Major Players sorted in no particular order Image © Mordor Intelligence. Reuse requires attribution under CC BY 4.0. | |
North America Snack Bar Market Analysis by Mordor Intelligence
The North America snack bar market size was valued at USD 14.79 billion in 2025 and estimated to grow from USD 15.98 billion in 2026 to reach USD 23.51 billion by 2031, at a CAGR of 8.03% during the forecast period (2026-2031). The demand for snack bars in North America is growing due to evolving consumer lifestyles and an increased emphasis on health and wellness, shaped by government regulations and industry innovation. Busy, on-the-go lifestyles in the U.S. and Canada have heightened the demand for portable, convenient meal replacements offering nutritional value. This trend is bolstered by rising health consciousness, with consumers seeking nutrient-dense options that align with "clean label" preferences, emphasizing organic ingredients and functional benefits like high protein or fiber content. The U.S. Food and Drug Administration (FDA) enforces strict guidelines on nutritional labeling and health claims, and in April 2025, announced a plan to phase out eight petroleum-based synthetic food dyes by the end of 2026, forcing companies to adopt natural alternatives[1]Source: U.S. Food and Drug Administration, “Additional requirements for the ‘healthy’ claim,” fda.gov. Companies like Walmart and Tyson Foods have pledged to eliminate certified colors from their products by the end of 2025. The FDA is also working to authorize new natural color additives, approving Galdieria extract blue and butterfly pea flower extract in May 2025 for use in snack products. Additionally, the FDA postponed the effective date for the "healthy" final rule to April 28, 2025, updating criteria for products labeled "healthy" and encouraging reformulation. In Canada, upcoming front-of-package labeling rules for high-sugar/sodium products, set for a January 2026 deadline, are similarly compelling brands to reformulate.
Key Report Takeaways
- By product type, protein bars led with 47.10% revenue share in 2025, whereas energy bars are set to expand at a 9.29% CAGR through 2031.
- By ingredient base, nut-based formats held 37.10% of the North America snack bar market share in 2025, yet granola and oat variants are forecast to grow at a 10.14% CAGR.
- By price tier, the mass segment commanded 67.10% of volume in 2025, while premium offerings are advancing at a 11.86% CAGR to 2031.
- By distribution channel, supermarkets and hypermarkets retained 42.40% share in 2025, but online retail is climbing fastest at a 12.35% CAGR.
- By geography, the United States generated 79.10% of 2025 revenue, but Canada is forecast to post the highest 11.05% CAGR to 2031.
Note: Market size and forecast figures in this report are generated using Mordor Intelligence’s proprietary estimation framework, updated with the latest available data and insights as of 2026.
North America Snack Bar Market Trends and Insights
Drivers Impact Analysis*
| Driver | (~) % Impact on CAGR Forecast | Geographic Relevance | Impact Timeline |
|---|---|---|---|
| Brand loyalty and effective promotional strategies | +0.8% | North America-wide, strongest in the United States mass retail | Medium term (2-4 years) |
| Product innovation and diverse flavor profiles | +1.5% | North America-wide, premium segment leadership in the United States and Canada | Short term (≤ 2 years) |
| Shifting consumer preferences for clean labels and natural ingredients | +1.3% | The United States and Canada core, spillover to Mexico's urban centers | Medium term (2-4 years) |
| Growth in fitness culture and active lifestyles | +1.6% | North America-wide, accelerated in Canadian provinces and the United States metropolitan areas | Long term (≥ 4 years) |
| Advancements in packaging solutions and sustainability | +0.7% | The United States and Canada, driven by state-level and federal EPR regulations | Long term (≥ 4 years) |
| Integration of functional ingredients | +1.4% | North America-wide, premium and specialty channels | Short term (≤ 2 years) |
| Source: Mordor Intelligence | |||


Product innovation and diverse flavor profiles
Flavor differentiation has emerged as the key strategy for brands aiming to enhance shelf visibility and secure repeat purchases. In March 2025, General Mills rolled out the Nature Valley Trix Cereal Bar, tapping into nostalgic branding to resonate with younger consumers familiar with the franchise. Quest, in a bid to rival ready-to-drink formats, launched Protein Milkshakes boasting 45 grams of protein in March 2025 and Overload Bars in February 2025, both emphasizing meal-replacement macros in a convenient format. Research from Mondelez highlighted peanut butter as the top choice for protein bar flavors. However, brands are infusing secondary flavors like salted caramel, matcha, and chili-lime, not just for their appeal but to justify premium pricing and boost social media buzz. Notably, there's a marked shift towards savory profiles. Nature Valley's Smoky BBQ and Everything Bagel Nut Crunch variants are now vying for afternoon snack moments, a territory once reserved for chips and crackers. This strategic diversification empowers manufacturers to segment their offerings by time of day and consumption context, effectively minimizing internal competition.
Shifting consumer preferences for clean labels and natural ingredients
As clean-label demand grows, it's reshaping how ingredients are sourced and how quickly formulations are updated. In 2024, the FDA rolled out updates to front-of-package "healthy" claims. These updates impose stricter limits on saturated fats, sodium, and added sugars, while emphasizing the need for meaningful food-group components. In response, brands are swapping out maltodextrin and corn syrup for alternatives like dates, honey, and monk fruit. However, these healthier substitutions often come with a higher price tag. RXBAR and LÄRABAR have capitalized on this trend, crafting franchises around minimal-ingredient formulations. RXBAR focuses on egg whites, dates, and nuts, while LÄRABAR emphasizes dates, nuts, and fruits. Both brands appeal to consumers wary of ingredient lists that exceed five items. Meanwhile, Health Canada is pushing for change with its front-of-package nutrition labeling. This labeling system highlights high levels of sodium, sugar, or saturated fat with warning symbols. Canadian brands are feeling the pressure, as non-compliance by 2026 could lead to delisting from major retailers. This regulatory split between the US and Canada is complicating matters for multinational companies, leading to a dual SKU scenario. However, it's a boon for nimble regional brands that can pivot and reformulate swiftly.
Growth in fitness culture and active lifestyles
The expanding fitness economy is driving a surge in protein bar consumption. The Health and Fitness Association reported that in 2024, U.S. fitness centers and health clubs boasted a record membership of approximately 77 million, the highest in a decade. This trend isn't confined to gym enthusiasts; even remote workers and students are stashing protein bars in their desks to fend off afternoon slumps. Meanwhile, the growing popularity of GLP-1 receptor agonists for weight management presents a curious twist: these appetite-suppressing medications are leading users to seek out protein-rich snacks. This helps them hit their daily protein goals and maintain lean muscle during weight loss. Brands are seizing the moment, branding their bars as "GLP-1 compatible" and flaunting over 20 grams of protein per serving. On platforms like TikTok and Instagram, fitness influencers are further propelling this trend. Their unboxing videos and macro-tracking tutorials resonate with Gen Z, who increasingly view nutrition as a means to enhance performance rather than a restrictive regimen.
Integration of functional ingredients
Bars are evolving from mere snacks to proactive wellness tools, thanks to the infusion of functional ingredients. Formulations now feature collagen peptides, MCT oil, adaptogens like ashwagandha, and probiotics, all targeting skin health, cognitive focus, and gut microbiome support. Ingredion's BarPro and BarFlex texturizers allow manufacturers to seamlessly integrate these bioactives, ensuring chewability and shelf stability – a challenge long faced in formulations. In a notable 2024 move, Arla Foods Ingredients rolled out whey protein concepts that pack 20 grams of protein per bar. These bars boast a soft, cookie-like texture, catering to consumers who have shunned the dense, chalky feel of traditional protein bars. However, the FDA's New Dietary Ingredient (NDI) notification process poses hurdles for novel botanicals and peptides. Brands find themselves investing heavily in safety dossiers and clinical trials before product launches. This regulatory landscape tends to benefit established players, equipped with robust research, development budgets, and legal expertise, creating barriers for smaller entrants eager to stand out with unique ingredients.
Restraints Impact Analysis*
| Restraint | (~) % Impact on CAGR Forecast | Geographic Relevance | Impact Timeline |
|---|---|---|---|
| Competition from other healthy snack alternatives | -0.9% | North America-wide, intensified in urban United States and Canadian markets | Short term (≤ 2 years) |
| Concerns regarding high sugar content | -0.6% | The United States and Canada, amplified by front-of-package labeling mandates | Medium term (2-4 years) |
| Stringent government regulations on health claims | -0.4% | The United States (FDA 21 CFR Part 101), Canada (Health Canada), and Mexico (COFEPRIS) | Long term (≥ 4 years) |
| Allergen concerns and cross-contamination risks | -0.3% | North America-wide, heightened in institutional channels (schools, hospitals) | Medium term (2-4 years) |
| Source: Mordor Intelligence | |||
Competition from other healthy snack alternatives
Ready-to-drink protein shakes, Greek yogurt cups, nut mixes, and meat jerky are encroaching on the territory of protein bars, offering similar nutritional benefits with less processing. For instance, the US Department of Agriculture reported that in 2023, the average American consumed about 13.8 pounds of yogurt. In 2024, ready-to-drink protein beverages outpaced bars in growth, leveraging refrigerated distribution for a freshness signal and single-serve formats to reduce wrapper waste. Whole-food snacks, such as almonds and cashews, are viewed as more natural options, despite having a similar calorie density to protein bars, primarily because they don't come with ingredient panels or nutrition claims. This perception is further amplified by clean-label advocates on social media, who label protein bars as "ultra-processed." This term resonates with consumers, even when the bars' formulations are limited to nuts, dates, and protein isolate. Additionally, private-label protein bars are gaining traction, challenging the dominance of branded bars in the mass market. Retailers like Costco and Kroger have introduced their own protein bars, often at prices lower than national brands.
Concerns regarding high sugar content
Despite efforts to reformulate, sugar content continues to face scrutiny. Many protein bars, touting health benefits, contain 10 to 15 grams of added sugars per serving, on par with candy bars. In 2024, the FDA finalized updated criteria for the "healthy" claim, limiting added sugars to 2.5 grams per Reference Amount Customarily Consumed (RACC) in snack categories. This move effectively bars most legacy formulations from labeling themselves as "healthy." Similarly, Health Canada has implemented front-of-package warning symbols for high sugar content[2]Source: Government of Canada, “Front-of-package nutrition symbol regulations,” canada.ca . As a result, Canadian retailers are pulling products with these warnings to sidestep negative consumer perceptions. Brands are turning to alternatives like allulose, monk fruit, and stevia. However, these substitutes come with hurdles: allulose, while costly, can lead to digestive issues in large amounts, and stevia's bitter aftertaste necessitates additional masking agents. This push for reduced sugar is birthing a two-tier market: premium bars with natural sweeteners fetch higher profits, while mass-market bars using sugar alcohols are priced low, catering to different consumer bases.
*Our forecasts treat driver/restraint impacts as directional, not additive. The impact forecasts reflect baseline growth, mix effects, and variable interactions.
Segment Analysis
By Product Type: Protein Bars Anchor, Energy Bars Accelerate
In 2025, driven by the rise of fitness culture and the growing adoption of meal replacements, protein bars claimed a dominant 47.10% share of the product-type market. However, energy bars are on a rapid ascent, boasting a 9.29% CAGR through 2031, marking them as the fastest-growing segment. While energy bars are now infusing ingredients like caffeine, guarana, and B-vitamins to target pre-workout and cognitive-performance moments, protein bars continue to focus on post-exercise recovery and promoting satiety. In a notable move, Quest introduced its Overload Bars in February 2025, packing in 45 grams of protein and a caffeine boost, signaling a potential blurring of lines between the two segments and hinting at a future dominated by hybrid formats. Once the frontrunner, cereal bars are ceding ground to protein-centric alternatives as consumers shift their focus to macronutrient density over nostalgic branding. Fruit and nut bars, though niche, cater to clean-label enthusiasts wary of isolated proteins. Meanwhile, the "other" category, which includes refrigerated and savory bars, is pushing boundaries with ingredients like chickpea flour and seaweed to entice the more adventurous palate.
In a bid to counter this trend, General Mills' Nature Valley Trix Cereal Bar made its debut in March 2025, aiming to tap into the nostalgia of millennial parents. The outcome of this launch will be a litmus test for the power of emotional branding against the prevailing market trends favoring protein and energy bars. On another front, the protein bar segment is diversifying based on protein sources, from whey and casein to pea, soy, and collagen. This segmentation not only caters to varied dietary preferences and allergen concerns but also adds complexity to SKUs, providing a buffer against supply shocks tied to any single ingredient.


By Ingredient Base: Oat Resurgence Challenges Nut Dominance
In 2025, nut-based bars captured 37.10% of the ingredient-based market share, with almond, peanut, and cashew formulations offering a blend of healthy fats and protein. Meanwhile, granola and oat-based bars are on the rise, boasting a 10.14% CAGR through 2031. This surge is fueled by consumers viewing whole grains as less processed and more sustainable than singular nut crops. North American-sourced oats enjoy a supply-chain advantage, unlike California-centric almonds, which are susceptible to drought-induced price fluctuations. Brands like Bobo's Oat Bars and GoMacro have carved out dedicated audiences by spotlighting organic oats, sprouted seeds, and a commitment to minimal processing, positioning themselves in stark contrast to whey-protein isolate bars.
Date-based bars, championed by RXBAR and LÄRABAR, carve out a premium niche by harnessing dates as both binder and sweetener, sidestepping added sugars or syrups. While dairy and protein bars, often using whey or casein concentrates, find traction in bodybuilding and clinical nutrition, they grapple with pushback from plant-based proponents who criticize dairy's environmental footprint. Hybrid blends, merging nuts, oats, and plant proteins, are gaining traction, marrying the crunch of nuts with the eco-friendly appeal of grains. With Glanbia's BarPro and HarvestPro pea protein, manufacturers can craft these hybrids, achieving 15 to 20 grams of protein while sidestepping soy or dairy allergen concerns. However, brands aiming for allergy-sensitive consumers must navigate the FDA's FALCPA, which mandates clear labeling for tree nuts, peanuts, soy, and dairy allergens.
By Price Category: Premium Gains on Functional Differentiation
In 2025, the mass segment dominated the price-category landscape, claiming a substantial 67.10% share. This dominance underscores the segment's roots as an affordable convenience food. However, the premium segment is on a rapid ascent, boasting a growth rate of 11.86% CAGR through 2031, nearly 50% outpacing the overall market. Premium bars, with their organic certifications, grass-fed whey, single-origin cacao, and functional additives like collagen and MCT oil, justify their elevated price tags. A strategic move by Simply Good Foods, acquiring OWYN for a notable USD 280 million in June 2024, underscores a belief: plant-based, allergen-free products can command premium prices, even in mainstream retail. Meanwhile, Perfect Snacks' ultra-premium refrigerated bars, emphasizing fresh ingredients and cold-chain distribution, cater to consumers who associate refrigeration with enhanced nutrition.
Mass-market bars, primarily competing on value and accessibility, find their footing in club stores and dollar channels, banking on high-velocity SKUs. Private-label offerings, like Costco's Kirkland Signature and Kroger's Simple Truth, are making waves by delivering similar nutritional profiles at enticing 30% to 40% discounts. This pricing strategy pressures branded counterparts to either innovate or grapple with shrinking margins. However, the premiumization trend isn't a one-size-fits-all; while Canada's premium segment surges ahead, buoyed by urban disposable incomes and a penchant for organic, non-GMO products, Mexico's landscape tells a different tale. Though predominantly mass-tier, affluent urbanites in Mexico City and Monterrey are slowly warming up to premium imports, hinting at potential growth.

By Distribution Channel: Online Retail Disrupts Traditional Grocery
In 2025, supermarkets and hypermarkets captured 42.40% of the distribution-channel share, leveraging impulse purchases at checkout and the advantage of side-by-side brand comparisons. Meanwhile, online retail is on an upward trajectory, boasting a 12.35% CAGR through 2031. This growth is fueled by subscription models, same-day delivery, and direct-to-consumer (DTC) strategies, which cleverly sidestep retailer slotting fees. While e-commerce snack sales have seen a rise in unit volume, with delivery orders increasing year-over-year, the decline in click-and-collect indicates a clear preference: convenience-driven shoppers prioritize immediate delivery over scheduled pickups. GoMacro, leveraging its DTC platform, has forged partnerships with Instacart, Uber Eats, Postmates, and DoorDash, ensuring same-day fulfillment – a feat traditional grocery stores struggle to match without hefty infrastructure investments.
Convenience stores, while not the fastest-growing channel, are transforming into "enhanced" formats, allocating more shelf space to healthier snack options. Clif Bar's exclusive bundles with Amazon, set to debut in January 2025, underscore the trend: brands are increasingly using e-commerce platforms to pilot limited-edition flavors and multi-pack formats before introducing them to physical stores. "Other" distribution channels – think gyms, corporate offices, and vending machines – are making a post-pandemic comeback, yet they still lag behind grocery and online channels in scale. The online retail boom is squeezing margins for brands without scale, as giants like Amazon and Walmart push for aggressive wholesale terms and levy co-op advertising fees. However, this shift also levels the playing field, granting emerging brands access that was once the domain of those with deep pockets for national retail distribution.
Geography Analysis
In 2025, the United States commanded a dominant 79.10% share of North America's snack bar revenue, underscoring its entrenched fitness culture, high per capita protein consumption, and a robust retail network boasting over 40,000 supermarkets and 150,000 convenience stores. Urban centers in California, Texas, and New York, with their health-conscious populations and disposable incomes, drive a significant portion of US sales. In 2024, the FDA's updated "healthy" claims on front packaging are prompting brands to reformulate, racing against tighter limits on saturated fats, sodium, and added sugars. This urgency is evident as brands strive to maintain their presence on the shelves of health-centric retailers like Whole Foods and Sprouts. Mars' strategic USD 35.9 billion acquisition of Kellanova in August 2024, which brought RXBAR and Bear Naked into its fold, highlights the US market's allure. Here, the scale achieved in co-manufacturing and ingredient sourcing directly boosts profit margins. The US market showcases a clear divide: premium organic bars thrive in coastal cities, while the Midwest and South lean towards value-driven private-label options, reflecting broader income disparities.
Canada is on track to grow at an impressive 11.05% CAGR through 2031, outpacing its neighbors. This surge is largely fueled by Health Canada's 2026 mandate for front-of-package nutrition labels, which will spotlight high sodium, sugar, or saturated fat content. Brands that swiftly adapt to these clean-label reforms are reaping early rewards, especially as major retailers pull non-compliant products to sidestep consumer backlash. In Canada, where 6.4 million residents identify as vegetarian or vegan, significantly more than the 3% in the US, plant-based bars are surging in popularity. Urban hubs like Toronto and Vancouver, with their abundance of fitness studios and specialty grocers, drive per-capita consumption in Ontario and British Columbia. While the Canadian Food Inspection Agency (CFIA) mandates bilingual labeling (English and French), adding to compliance costs for US entrants, it simultaneously fortifies the market position of established players.
While Mexico and other parts of North America contribute modestly, cities like Mexico City, Monterrey, and Guadalajara are rapidly embracing snack bars. This shift is largely due to multinational brands tailoring flavors, like tamarind, chili-lime, and horchata, and pricing to resonate with local consumers. Mexico's regulatory body, COFEPRIS, mandates front-of-package labels akin to those in Chile, compelling brands to highlight excesses in calories, sugar, sodium, saturated fat, and trans fat. This regulatory landscape favors newly reformulated products over traditional ones. Meanwhile, Central America and the Caribbean, though still emerging, are witnessing a surge in demand for US-branded bars, spurred by tourism and expatriate communities. Brands are leveraging cross-border e-commerce as a testing ground, gauging market viability without the commitment of local distribution channels.
Competitive Landscape
In North America, the snack bar market showcases a moderate concentration. The top five players, including General Mills, Kellogg (now integrated with Kellanova/Mars), Mondelez, PepsiCo, and Post Holdings, command a significant share of the revenue. Meanwhile, the rest of the market remains fragmented, populated by venture-backed disruptors and regional specialists. This landscape fosters a twofold competitive dynamic: established players leverage economies of scale in co-manufacturing, ingredient sourcing, and retail placements. In contrast, newer entrants carve out their niche through specialized formulations, direct-to-consumer channels, and brand promotion via social media. In June 2024, Simply Good Foods bolstered its plant-based portfolio with a USD 280 million acquisition of OWYN. This move aligns its brands, Quest and Atkins, with the vegan-certified OWYN, targeting consumers shifting from dairy proteins.
Emerging opportunities lie in savory bars, refrigerated formats, and bars designed for specific diets like keto, paleo, and GLP-1. Brands are broadening their horizons: General Mills' Nature Valley Savory Nut Crunch (offering Smoky BBQ and Everything Bagel flavors) and Perfect Snacks' refrigerated bars are venturing beyond sweet profiles. Their goal? To seize snack occasions in the afternoon and evening, traditionally held by chips and crackers. Smaller players, including GoMacro, Bobo's, and Health Warrior, are capitalizing on certifications like Certified B Corp and Climate Neutral. This strategy resonates with values-driven consumers, especially Gen Z and millennials, who often view their purchases as a form of activism.
Technology is emerging as a pivotal competitive tool. Brands are harnessing AI for flavor optimization, blockchain to ensure supply-chain transparency, and personalized algorithms to tailor product recommendations based on individual macro targets. Glanbia's BarPro texturizer stands out, allowing high-protein formulations without the usual chalkiness. However, while such ingredient innovations can offer a temporary edge, these advantages diminish as suppliers extend licenses to competitors.
North America Snack Bar Industry Leaders
General Mills Inc.
Kellogg Company
Mars Incorporated
Mondelēz International Inc.
PepsiCo Inc.
- *Disclaimer: Major Players sorted in no particular order

Recent Industry Developments
- March 2025: Simply Good Foods launched Quest Protein Milkshakes with 45 grams of protein per serving, targeting meal-replacement occasions and competing directly with ready-to-drink protein beverages. The launch reflected a strategic pivot toward liquid formats that offer comparable nutrition with less chewing friction, a response to consumer feedback that dense bars can be difficult to consume on the go.
- March 2025: General Mills introduced Nature Valley Trix Cereal Bar, leveraging nostalgic cereal branding to attract millennial parents and their children. The product represents a counter-trend bet that emotional branding can revive cereal bars despite the category's shift toward protein-forward formulations.
- February 2025: Simply Good Foods launched Quest Overload Bars with 45 grams of protein and added caffeine, blurring the line between protein and energy bars. The hybrid format targets consumers seeking both post-workout recovery and pre-workout stimulation, a dual-occasion strategy that could expand per-capita consumption.
- January 2025: Post Holdings acquired PowerBar and Musashi brands from Nestlé, consolidating its Active Nutrition Group into a platform generating approximately USD 550 million in annual revenue. The acquisition provides Post with established brands in the sports nutrition segment and expands its geographic footprint into Australia and New Zealand.


North America Snack Bar Market Report Scope
Cereal Bar, Fruit & Nut Bar, Protein Bar are covered as segments by Confectionery Variant. Convenience Store, Online Retail Store, Supermarket/Hypermarket, Others are covered as segments by Distribution Channel. Canada, Mexico, United States are covered as segments by Country.| Cereal Bar |
| Energy Bar |
| Protein Bar |
| Fruit and Nut Bar |
| Others |
| Nut-based bars |
| Granola/Oat-based |
| Date-based |
| Dairy/Protein-based |
| Hybrid blends |
| Others |
| Mass |
| Premium |
| Supermarket/Hypermarket |
| Online Retail Store |
| Convenience Store |
| Other Distribution Channels |
| United States |
| Canada |
| Mexico |
| Rest of North America |
| Product Type | Cereal Bar |
| Energy Bar | |
| Protein Bar | |
| Fruit and Nut Bar | |
| Others | |
| Ingredient Base | Nut-based bars |
| Granola/Oat-based | |
| Date-based | |
| Dairy/Protein-based | |
| Hybrid blends | |
| Others | |
| Price Category | Mass |
| Premium | |
| Distribution Channel | Supermarket/Hypermarket |
| Online Retail Store | |
| Convenience Store | |
| Other Distribution Channels | |
| Geography | United States |
| Canada | |
| Mexico | |
| Rest of North America |


Market Definition
- Milk and White Chocolate - Milk chocolates is a solid chocolate made with milk (in the form of either milk powder, liquid milk, or condensed milk) and cocoa solids. White chocolate is made from cocoa butter and milk and contains no cocoa solids whatsoever. The scope includes regular chocolates, low-sugar, and sugar-free variants
- Toffees & Nougats - Toffees include hard, chewy, and small or one-bite candies marketed with labels as toffee or toffee-like confectionery. Nougat is a chewy confection with almond, sugar, and egg white as a basic ingredient; and it originated in Europe and Middle East countries.
- Cereals Bars - A snack composed of breakfast cereal that has been compressed into a bar shape and is held together with a form of edible adhesive. The scope includes snack bars made with cereals such as rice, oats, corn, etc. mixed with a binding syrup. These also include products labeled as cereal bars, cereal treat bars, or grain bars.
- Chewing Gum - This is a preparation for chewing, usually made of flavored and sweetened chicle or such substitutes as polyvinyl acetate. The types of chewing gums included in the scope are sugar-chewing gums and sugar-free chewing gums
| Keyword | Definition |
|---|---|
| Dark Chocolate | Dark chocolate is a form of chocolate containing cocoa solids and cocoa butter without the milk. |
| White Chocolate | White chocolate is the type of chocolate containing the highest percentage of milk solids, typically around or over 30 percent. |
| Milk Chocolate | Milk chocolate is made from dark chocolate that has a low cocoa solid content and higher sugar content, plus a milk product. |
| Hard Candy | A candy made of sugar and corn syrup boiled without crystallizing. |
| Toffees | A hard, chewy, often brown sweet that is made from sugar boiled with butter. |
| Nougats | A chewy or brittle candy containing almonds or other nuts and sometimes fruit. |
| Cereal bar | A cereal bar is a bar-shaped food product, made by pressing cereals and usually dried fruit or berries, which are in most cases held together by glucose syrup. |
| Protein bar | Protein bars are nutrition bars that contain a high proportion of protein to carbohydrates/fats. |
| Fruit & Nut bar | These are often based on dates with other dried fruit and nut additions and, in some cases, flavorings. |
| NCA | The National Confectioners Association is an American trade organization that promotes chocolate, candy, gum and mints, and the companies that make these treats. |
| CGMP | Current good manufacturing practices are those conforming to the guidelines recommended by relevant agencies. |
| Unstandardized foods | Unstandardized foods are those that do not have a standard of identity or that deviate from a prescribed standard in any manner. |
| GI | The glycemic index (GI) is a way of ranking carbohydrate-containing foods based on how slowly or quickly they are digested and increase blood glucose levels over a period of time |
| Skimmed milk powder | Skimmed milk powder is obtained by removing water from pasteurized skim milk by spray-drying. |
| Flavanols | Flavanols are a group of compounds found in cocoa, tea, apples, and many other plant-based foods and beverages. |
| WPC | Whey protein concentrate- the substance obtained by the removal of sufficient nonprotein constituents from pasteurized whey so that the finished dry product contains greater than 25% protein. |
| LDL | Low density Lipoprotein- the bad cholesterol |
| HDL | High density Lipoprotein- the good cholesterol |
| BHT | butylated Hydroxytoluene is a lab-made chemical that is added to foods as a preservative. |
| Carrageenan | Carrageenan is an additive used to thicken, emulsify, and preserve foods and drinks. |
| Free form | Not containing certain ingredients, such as gluten, dairy, or sugar. |
| Cocoa butter | It is a fatty substance obtained from cocoa beans, used in the manufacture of confectionery. |
| Pastellies | A type of of Brazilian candy made from sugar, eggs, and milk. |
| Draggees | Small, round candies that are coated with a hard sugar shell |
| CHOPRABISCO | Royal Belgian Association of the chocolate, pralines, biscuit, and confectionery industry- A trade association that represents the Belgian chocolate industry. |
| European Directive 2000/13 | A European Union directive that regulates the labeling of food products |
| Kakao-Verordnung | The German chocolate ordinance, a set of regulations that define what can be labeled as "chocolate" in Germany. |
| FASFC | Federal Agency for the Safety of the Food Chain |
| Pectin | A natural substance that is derived from fruits and vegetables. It is used in confectionery to create a gel-like texture. |
| Invert sugars | A type of sugar that is made up of glucose and fructose. |
| Emulsifier | A substance that helps to mix to liquids that does not mix together. |
| Anthocyanins | A type of flavonoid that is responsible for the red, purple, and blue colors of confectionery. |
| Functional Foods | Foods that have been modified to provide additional health benefits beyond basic nutrition. |
| Kosher certificate | This certification verifies that the ingredients, production process including all machinery, and/or food-service process complies with the standards of Jewish dietary law |
| Chicory root extract | A natural extract from the chicory root that is a good source of fiber, calcium, phosphorous, and folate |
| RDD | Recommended daily dose |
| Gummies | A chewy gelatin-based candy that is often flavored with fruit. |
| Nutraceuticals | Food or dietary supplements that are claimed to have health benefits. |
| Energy bars | Snack bars that are high in carbohydrates and calories are designed to provide energy on the go. |
| BFSO | Belgian Food Safety Organization for the food chain. |


Research Methodology
Mordor Intelligence follows a four-step methodology in all our reports.
- Step-1: Identify Key Variables: In order to build a robust forecasting methodology, the variables and factors identified in Step 1 are tested against available historical market numbers. Through an iterative process, the variables required for market forecast are set, and the model is built on the basis of these variables.
- Step-2: Build a Market Model: Market-size estimations for the forecast years are in nominal terms. Inflation is not a part of the pricing, and the average selling price (ASP) is kept constant throughout the forecast period for each country.
- Step-3: Validate and Finalize: In this important step, all market numbers, variables, and analyst calls are validated through an extensive network of primary research experts from the market studied. The respondents are selected across levels and functions to generate a holistic picture of the market studied.
- Step-4: Research Outputs: Syndicated Reports, Custom Consulting Assignments, Databases & Subscription Platforms


