
Market Overview
| Study Period | 2021 - 2031 |
|---|---|
| Forecast Data Period | 2026 - 2031 |
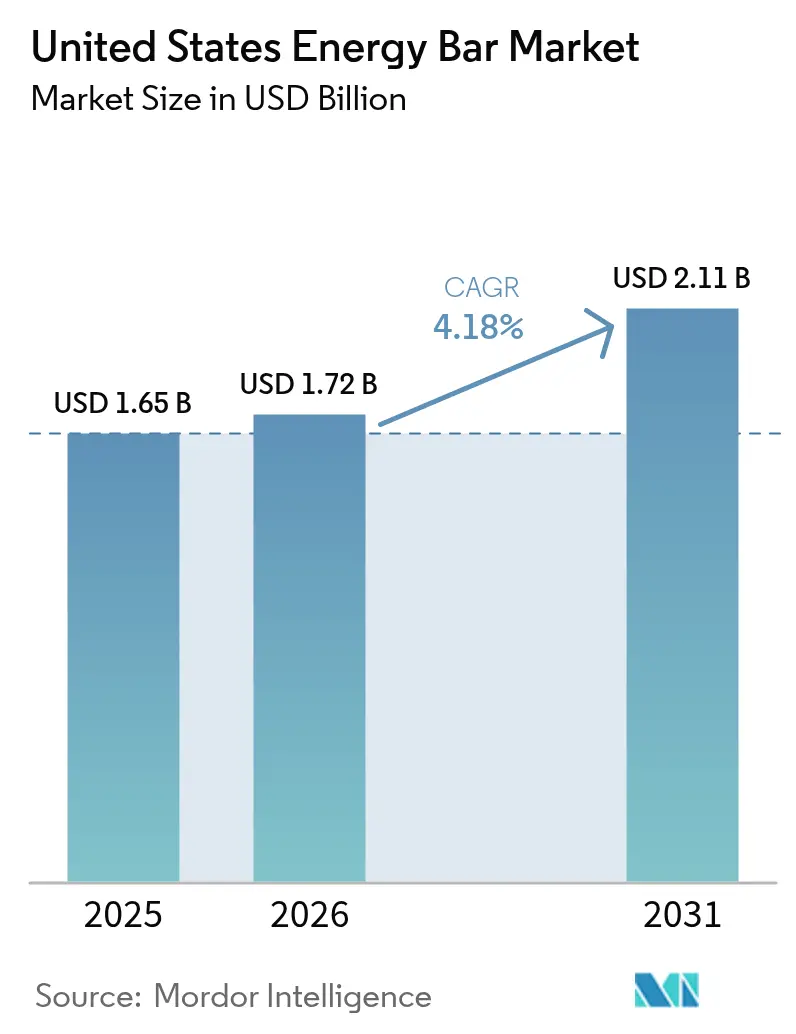
| Base Year Market Size (2025) | USD 1.65 Billion |
| Market Size (2026) | USD 1.72 Billion |
| Market Size (2031) | USD 2.11 Billion |
| Growth Rate (2026 - 2031) | 4.18 % |
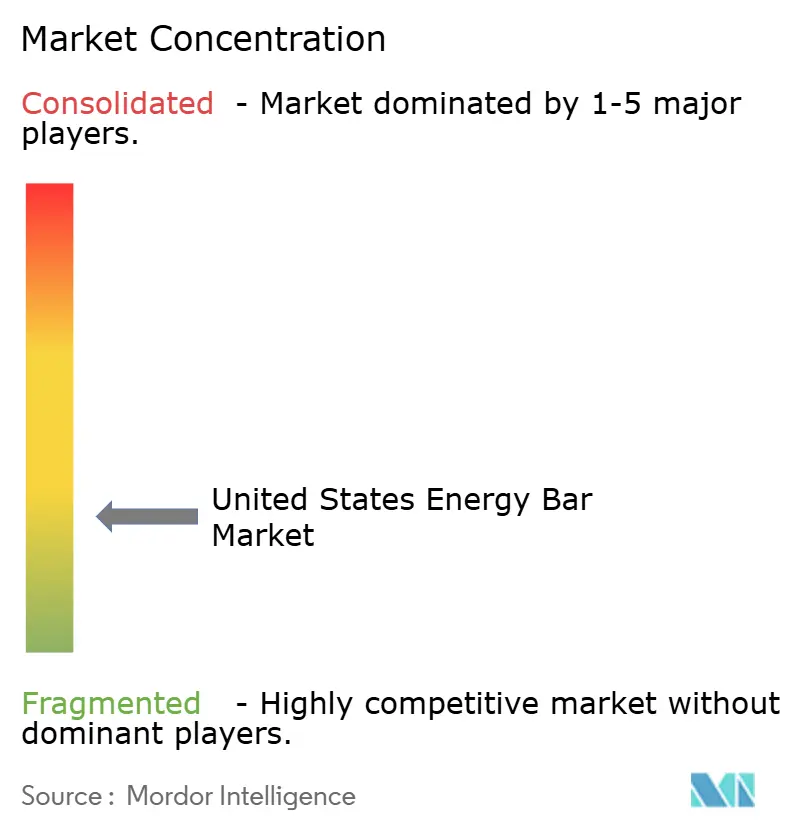
| Market Concentration | Low |
Major Players *Disclaimer: Major Players sorted in no particular order Image © Mordor Intelligence. Reuse requires attribution under CC BY 4.0. | |
United States Energy Bar Market Analysis by Mordor Intelligence
The United States energy bar market size is expected to grow from USD 1.65 billion in 2025 to USD 1.72 billion in 2026 and is forecast to reach USD 2.11 billion by 2031 at 4.18% CAGR over 2026-2031. This consistent growth trajectory underscores the market's progression toward maturity, driven by several key factors. Increasing consumer demand for convenient and nutritious snack options is a primary driver, as energy bars align with the fast-paced lifestyles of modern consumers. Additionally, the growing awareness of health and wellness, coupled with a shift toward on-the-go consumption, has further fueled the adoption of energy bars. The market is also benefiting from innovations in product formulations, including the incorporation of functional ingredients such as protein, fiber, and superfoods, which cater to specific dietary needs and preferences. Furthermore, the rising popularity of plant-based and clean-label products has encouraged manufacturers to diversify their offerings, appealing to a broader consumer base. The expanding distribution channels, including e-commerce platforms and specialty health stores, are also playing a significant role in enhancing product accessibility and driving market growth.
Key Report Takeaways
- By product type, conventional bars led with 63.48% of the United States energy bar market share in 2025; organic variants are projected to expand at a 4.76% CAGR through 2031.
- By protein source, plant-based products held 57.30% share of the United States energy bar market size in 2025, whereas animal-based offerings recorded the fastest 6.05% CAGR to 2031.
- By function/application, weight management and lifestyle bars captured 45.60% of the United States energy bar market size in 2025; sports and endurance nutrition bars accelerate at a 4.92% CAGR to 2031.
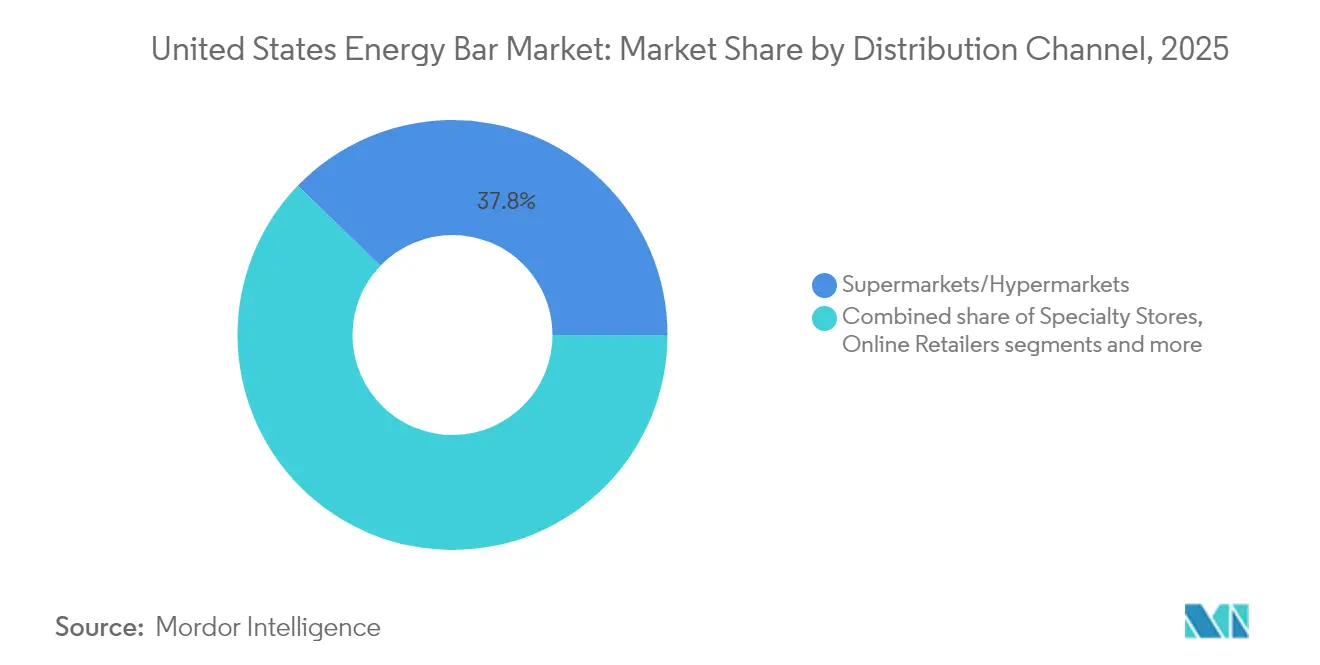
- By distribution channel, supermarkets/hypermarkets retained 37.80% of the United States energy bar market share in 2025, while online retailers exhibit a robust 5.98% CAGR through 2031.
Note: Market size and forecast figures in this report are generated using Mordor Intelligence’s proprietary estimation framework, updated with the latest available data and insights as of 2026.
United States Energy Bar Market Trends and Insights
Drivers Impact Analysis*
| Driver | (~) % Impact on CAGR Forecast | Geographic Relevance | Impact Timeline |
|---|---|---|---|
| Innovative formulations and clean-label ingredients favored by health-conscious consumers | +1.2% | National, with premium segments in coastal metropolitan areas | Medium term (2-4 years) |
| Quick energy-boosting snacks driving market growth | +0.8% | National, with higher penetration in urban centers | Short term (≤ 2 years) |
| Growth of outdoor and adventure sports culture boosts demand | +0.6% | Regional, concentrated in western states and mountain regions | Long term (≥ 4 years) |
| Demand for convenient and healthy on-the-go snacking | +0.9% | National, with emphasis on commuter corridors | Short term (≤ 2 years) |
| Rising adoption of specialized diets drives niche bar formulations | +0.7% | National, with premium positioning in affluent demographics | Medium term (2-4 years) |
| Growing popularity of plant-based and vegan energy bars | +0.5% | National, with coastal and urban concentration | Medium term (2-4 years) |
| Source: Mordor Intelligence | |||
Innovative Formulations and Clean-Label Ingredients Are Being Favored by Health-Conscious Consumers.
In the US energy bar market, the growing preference for innovative formulations and clean-label ingredients is a significant driver. Consumers are increasingly seeking products that align with their health and wellness goals. Clean-label ingredients, which emphasize transparency and the use of natural, minimally processed components, are gaining traction among health-conscious individuals. These ingredients often exclude artificial additives, preservatives, and synthetic chemicals, which resonate with consumers looking for healthier alternatives. Additionally, innovative formulations that cater to specific dietary needs, such as high-protein, low-sugar, gluten-free, or plant-based options, are becoming more popular. Manufacturers are also incorporating functional ingredients like superfoods, probiotics, and adaptogens to enhance the nutritional profile of energy bars, further appealing to the health-conscious demographic. This trend reflects a broader shift in consumer behavior, where individuals prioritize nutritional value, ingredient quality, and product transparency when selecting energy bars.
Quick Energy-Boosting Snacks Are Driving the Market's Growth
The increasing preference for convenient and nutritious snack options is significantly driving the growth of the United States energy bar market. Consumers are seeking quick energy-boosting snacks that align with their busy lifestyles, offering both portability and nutritional benefits. Energy bars, known for their ability to provide instant energy and essential nutrients, are becoming a popular choice among health-conscious individuals, athletes, and professionals. According to the International Food Information Council, 20% of U.S. consumers followed a high-protein diet in 2024 [1]. This shift toward high-protein diets has further fueled the demand for energy bars, as they are often formulated with high protein content to meet dietary needs. This trend is further supported by the growing awareness of health and wellness, which has led to a surge in demand for functional and on-the-go food products. The market is also benefiting from innovations in flavors, ingredients, and packaging, catering to diverse consumer preferences and dietary requirements. These factors collectively contribute to the robust growth of the energy bar market in the United States.
Growth of Outdoor and Adventure Sports Culture Boosts Demand
The expansion of outdoor recreation participation has created a specialized market segment that values portable, performance-oriented nutrition products designed for extended physical activity. USDA research indicates that outdoor recreation trends are evolving toward health-related activities, with potential increases in outdoor pursuits as consumers seek alternatives to traditional fitness routines. This shift represents more than recreational preference changes; it reflects a fundamental reorientation of wellness strategies toward nature-based activities that require specialized nutritional support. The outdoor sports demographic typically exhibits higher disposable income and greater willingness to pay premium prices for products that enhance performance and recovery, creating opportunities for manufacturers to develop specialized formulations with enhanced caloric density and specific nutrient profiles. Besides, climate change impacts on traditional winter sports may redirect consumer interest toward year-round outdoor activities like hiking, climbing, and trail running, potentially expanding the addressable market for energy bars designed for endurance activities.
Demand For Convenient and Healthy On-The-Go Snacking
The U.S. energy bar market demonstrates growth driven by demand for convenient, nutritious, and portable snacking options. Consumers, including working professionals and fitness enthusiasts, require snacks that deliver sustained energy while maintaining nutritional value. Energy bars fulfill these requirements through balanced nutrients, functional ingredients, and portion control, functioning as meal replacements or pre-workout supplements. The market has diversified beyond standard granola bars to incorporate specialized products, including gluten-free, keto, vegan, and high-protein variants. Besides, product offerings encompass chocolate almond to plant-based superfood formulations, addressing multiple dietary requirements and nutritional specifications. Consumer demand for clean-label products and ingredient transparency has increased, resulting in purchases of bars without artificial additives and containing identifiable ingredients. E-commerce platforms and subscription services have enhanced product distribution and facilitated recurring purchases. The market indicates continued growth potential as health awareness and active lifestyles remain significant consumer drivers.
Restraints Impact Analysis*
| Restraint | (~) % Impact on CAGR Forecast | Geographic Relevance | Impact Timeline |
|---|---|---|---|
| Fluctuating raw material prices disturb cost dynamics | -0.4% | National, with regional variations based on supply chain proximity | Short term (≤ 2 years) |
| Sugar levels and synthetic additives raise health alarm bells | -0.6% | National, with premium segments most affected | Medium term (2-4 years) |
| Rivalry from meal replacement beverages and other snack bars | -0.3% | National, with urban markets experiencing highest competition | Long term (≥ 4 years) |
| Allergens like nuts and dairy restrict growth for sensitive groups | -0.5% | National, with regulatory compliance costs affecting all manufacturers | Medium term (2-4 years) |
| Source: Mordor Intelligence | |||
Sugar Levels and Synthetic Additives Raise Health Alarm Bells
Rising health concerns regarding high sugar content and the presence of synthetic additives in energy bars are acting as significant market restraints in the market. As per the 2024 report from the Centers for Disease Control and Prevention, over 38 million Americans, roughly 1 in 10, are diagnosed with diabetes, with 90% to 95% of these cases being type 2 diabetes [2]. Consumers are increasingly scrutinizing product labels, seeking healthier alternatives with natural ingredients and reduced sugar levels. This shift in consumer preferences is pressuring manufacturers to reformulate their products to align with the growing demand for clean-label and health-conscious options. Failure to address these concerns could hinder market growth, as health-conscious consumers may opt for other snack options perceived as healthier. Additionally, regulatory bodies are imposing stricter guidelines on sugar content and synthetic additives, further challenging manufacturers in this market. Energy bars, often marketed as convenient and nutritious snacks, are facing criticism due to their high sugar content, which can contribute to health issues such as obesity, diabetes, and other metabolic disorders.
Allergens Like Nuts and Dairy Restrict Growth for Sensitive Groups
The FDA's updated allergen labeling requirements, including the addition of sesame as a major allergen, are creating compliance challenges that extend beyond simple labeling modifications to encompass entire supply chain management systems. The comprehensive allergen framework now requires manufacturers to declare nine major allergens—milk, eggs, fish, crustacean shellfish, tree nuts, wheat, peanuts, soybeans, and sesame—creating potential formulation constraints for products that rely on these ingredients for taste, texture, or nutritional profiles [3]. This regulatory expansion reflects growing recognition of food allergies as a public health concern, but it also creates market segmentation challenges for manufacturers who must balance broad appeal with allergen-free formulations. The requirement for clear allergen declarations may limit cross-contamination flexibility in manufacturing facilities, potentially necessitating dedicated production lines or extensive cleaning protocols that increase operational costs.
*Our forecasts treat driver/restraint impacts as directional, not additive. The impact forecasts reflect baseline growth, mix effects, and variable interactions.
Segment Analysis
By Function/Application: Weight Management Dominance Challenged by Sports Nutrition Growth
In 2025, weight management and lifestyle energy bars accounted for 45.60% of the United States energy bar market. These bars cater to consumers seeking convenient and nutritious options to support their weight management goals and active lifestyles. The growing awareness of health and wellness, coupled with the increasing demand for on-the-go snacks, has driven the popularity of this segment. Additionally, the rise in dietary trends such as keto, vegan, and gluten-free diets has further boosted the demand for these bars. Manufacturers are focusing on introducing innovative flavors and formulations, such as high-protein, low-sugar, and plant-based options, to meet diverse consumer preferences and dietary needs. The segment also benefits from strategic marketing efforts targeting health-conscious individuals and the increasing availability of these products across various retail channels, including supermarkets, convenience stores, and online platforms.
The sports and endurance nutrition bars segment is projected to grow at a CAGR of 4.92% through 2031. This growth is fueled by the rising participation in sports and fitness activities across the United States, driven by an increasing focus on physical health and wellness. These bars are specifically designed to provide sustained energy and support muscle recovery, making them a preferred choice among athletes and fitness enthusiasts. Companies in this segment are investing in research and development to enhance product efficacy, incorporating ingredients like amino acids, electrolytes, and superfoods to cater to the performance-driven needs of their target audience. Furthermore, the segment is witnessing a surge in demand due to the growing trend of endurance sports, such as marathons and triathlons, and the increasing adoption of fitness routines among the general population. The availability of these products in specialized sports nutrition stores and e-commerce platforms has also contributed to the segment's expansion.


By Product Type: Conventional Dominance Faces Organic Acceleration
In the United States energy bar market, conventional energy bars continue to dominate, holding a substantial 63.48% market share in 2025. This dominance can be attributed to their well-established distribution networks, where products are often priced competitively, making them an attractive option for cost-conscious consumers. Furthermore, conventional energy bars benefit from decades of market presence, which has helped ensure widespread availability across supermarkets, convenience stores, and online platforms. These are strong brand loyalty and consumer trust. Their ability to cater to a wide range of tastes and dietary preferences through diverse product offerings further solidifies their position as a go-to choice for consumers seeking convenient, affordable, and reliable nutrition solutions.
Conversely, organic energy bars are emerging as a rapidly growing segment, with a projected CAGR of 4.76% through 2031. This growth is primarily driven by a shift in consumer preferences toward products that align with environmental sustainability and health-conscious values. Consumers are increasingly willing to pay premium prices for organic options, perceiving them as healthier and more environmentally friendly alternatives. The segment's growth is further fueled by the rising demand for clean-label products, which emphasize transparency in ingredient sourcing and production processes. Organic energy bars often feature natural, non-GMO, and minimally processed ingredients, appealing to health-focused consumers. Additionally, the increasing awareness of the environmental impact of food production has led to a preference for organic products, which are often associated with sustainable farming practices.
By Distribution Channel: E-Commerce Disrupts Traditional Retail Dominance
In 2025, supermarkets/hypermarkets accounted for a significant 37.80% share of the United States energy bar market. These retail formats remain a dominant distribution channel due to their extensive reach and ability to offer a wide variety of products under one roof. Consumers often prefer supermarkets/hypermarkets for their convenience, as they provide the opportunity to compare multiple brands and flavors in a single visit. Additionally, promotional activities, discounts, and in-store sampling further drive sales through this channel, making it a key contributor to the market's overall growth. The presence of well-established retail chains and their ability to cater to a broad consumer base also play a crucial role in maintaining their market dominance.
Online retailers are experiencing the fastest growth in the United States energy bar market, with a projected CAGR of 5.98% through 2031. The increasing penetration of e-commerce platforms and the growing preference for doorstep delivery are fueling this growth. Online channels offer consumers the convenience of browsing a wide range of products, reading reviews, and accessing exclusive online discounts. Furthermore, the ability to cater to niche dietary preferences and the availability of subscription-based models are enhancing the appeal of online retail for energy bar purchases. The rise of mobile commerce, coupled with advancements in digital payment systems, has further simplified the purchasing process, encouraging more consumers to shift toward online platforms. This channel is expected to continue its robust expansion during the forecast period, driven by the increasing adoption of digital technologies and changing consumer shopping behaviors.
By Protein Source: Plant-Based Leadership Challenged by Animal Protein Growth
Plant-based protein alternatives are expected to dominate the United States energy bar market, holding a significant 57.30% market share in 2025. This growth is driven by increasing consumer preference for sustainable and health-conscious options. The rising awareness of plant-based diets, coupled with advancements in product innovation, has led to a surge in demand for energy bars made from ingredients like nuts, seeds, and legumes. Additionally, the growing vegan and flexitarian population in the country further supports the expansion of this segment, as consumers seek convenient and nutritious snack options aligned with their dietary preferences. Manufacturers are also focusing on clean-label products and incorporating superfoods such as chia seeds, quinoa, and spirulina to enhance the nutritional profile of plant-based energy bars, further fueling their popularity.
Animal-based protein sources, on the other hand, are witnessing the fastest growth in the market, with a projected CAGR of 6.05% through 2031. This growth is attributed to the high protein content and nutritional benefits offered by animal-based ingredients such as whey, casein, and egg proteins. These energy bars cater to a broad consumer base, including fitness enthusiasts and athletes, who prioritize muscle recovery and performance enhancement. The segment's growth is further bolstered by the increasing availability of premium and fortified animal-based energy bars, which appeal to health-conscious consumers seeking functional benefits. Additionally, the demand for animal-based protein bars is supported by their ability to provide complete amino acid profiles, making them a preferred choice for individuals aiming to meet their daily protein requirements efficiently.
Geography Analysis
The United States energy bar market demonstrates significant regional variations in consumption patterns and growth drivers. Coastal metropolitan areas, such as New York City, Los Angeles, and San Francisco, exhibit higher penetration rates for premium and specialty energy bars. These regions are characterized by a strong presence of health-conscious consumers who prioritize organic, plant-based, and high-protein options. The availability of diverse retail channels, including specialty health stores and premium supermarkets, further supports the demand for such products in these areas. Additionally, the influence of fitness trends and wellness-focused lifestyles in these cities drives the adoption of performance-oriented formulations among active individuals and professionals seeking convenient nutrition solutions.
Urban centers with established fitness cultures and higher disposable incomes, such as Chicago, Boston, and Seattle, also contribute significantly to the market's growth. These cities have a growing number of gyms, fitness studios, and wellness events, which create a conducive environment for energy bar consumption. Consumers in these areas often seek products that align with their dietary preferences, such as gluten-free, keto-friendly, or vegan options. The presence of a younger, health-conscious demographic further accelerates the demand for innovative and functional energy bars tailored to specific nutritional needs. For example, Seattle's active outdoor culture and Boston's emphasis on marathon training have spurred demand for energy bars designed for endurance and recovery.
Additionally, the rise of direct-to-consumer brands targeting urban millennials has further expanded the market in these regions. In contrast, suburban and rural markets, including regions in the Midwest and the South, show a stronger preference for value-oriented, conventional energy bars. These areas are often driven by price sensitivity and limited access to premium retail outlets. However, the growing awareness of health and wellness, coupled with the expansion of e-commerce platforms, is gradually influencing consumer preferences in these regions. Suburban families and rural consumers are increasingly opting for energy bars as convenient snack options, particularly for outdoor activities and on-the-go lifestyles. For instance, in states like Texas and Ohio, energy bars are becoming popular among families for road trips and outdoor recreation.
Regulatory Landscape
Energy bars sold in the United States are regulated as packaged foods under the U.S. Food and Drug Administration (FDA), with core labeling and nutrition disclosure requirements governed by 21 CFR Part 101. Manufacturers must ensure compliant Nutrition Facts labeling, ingredient statements, and allergen declarations, including the expanded list of nine major allergens (milk, eggs, fish, crustacean shellfish, tree nuts, wheat, peanuts, soybeans, and sesame), which can influence formulation choices and manufacturing controls for cross-contact.
Label-change timing is shaped by the FDA Uniform Compliance Date system for food labeling regulations, which applies to products introduced between January 1, 2025, and December 31, 2026, creating an operational window for coordinated packaging updates across SKUs. In parallel, the FDA has been advancing work on front-of-package nutrition labeling, reinforcing the direction of travel toward clearer, at-a-glance nutrition communication that can elevate the importance of sugar, fiber, and protein positioning on energy bar packs.
Value Chain Analysis
The value chain begins with agricultural and specialty ingredients used for bar bases and functional positioning, including grains, sweeteners, nuts, seeds, dried fruits, dairy-derived proteins for animal-based lines, and plant proteins. Suppliers and ingredient processors feed into brand owners and manufacturers that handle formulation, blending, cooking or extrusion or cold-pressing, and inclusions management, followed by portioning, enrobing or coating where applicable, and primary and secondary packaging. Co-manufacturers also play a material role in the United States by offering turnkey services spanning ingredient procurement, R&D support, production, packaging, and, in some cases, downstream logistics, supporting both emerging brands and established players seeking flexible capacity.
Downstream, distribution runs through mass retail and grocery, convenience, specialty, and growing e-commerce. Recent channel moves show how brands scale, including JiMMYBAR! expanding into more than 1,500 Chevron ExtraMile locations (April 2026) and Ready rolling out protein bars nationwide at Target and Target.com (May 2026), which highlights the importance of retail authorization, planogram placement, and high fill-rate execution. Innovation and renovation also flow through the chain via branded R&D and co-manufacturing, with Mondelēz expanding CLIF formats (energy bites and a limited-edition bar) and refreshing legacy bar platforms to maintain velocity across mainstream outlets.
Competitive Landscape
The U.S. energy bar market demonstrates high fragmentation, with three out of ten established companies controlling market share. These companies prioritize portfolio diversification and strategic acquisitions instead of engaging in direct price competition. Key players such as Mondelez, Mars, and General Mills have been focusing on expanding their product portfolios to cater to evolving consumer preferences. For instance, Clif Bar & Company has introduced organic and plant-based energy bars to appeal to health-conscious consumers. Similarly, KIND LLC has diversified its offerings by launching protein-packed and low-sugar variants to address the growing demand for functional snacks. General Mills, on the other hand, has strengthened its market position through acquisitions, such as its purchase of EPIC Provisions, to tap into the niche segment of meat-based energy bars.
Additionally, companies are leveraging innovation to differentiate their products in a highly competitive market. For example, RXBAR, owned by Kellogg’s, has gained significant traction by emphasizing clean labeling and minimal ingredients, which resonate with consumers seeking transparency in food products. Similarly, Quest Nutrition has introduced bars with high protein content and low net carbs, targeting fitness enthusiasts and individuals following ketogenic diets. These innovations reflect the growing trend of personalization in the energy bar market, where brands aim to meet specific dietary needs and preferences.
Strategic partnerships and marketing initiatives also play a crucial role in shaping the competitive landscape. For instance, Clif Bar & Company has collaborated with athletes and outdoor enthusiasts to promote its products as ideal for active lifestyles. Also, KIND LLC has invested in digital marketing campaigns to enhance brand visibility and connect with younger demographics. Furthermore, private-label brands are emerging as strong competitors, offering cost-effective alternatives to premium energy bars. This dynamic environment underscores the importance of strategic planning and adaptability for companies to sustain growth in the U.S. energy bar market.
United States Energy Bar Industry Leaders
-
General Mills Inc.
-
Mars Incorporated
-
Mondelez International Inc.
-
Glanbia PLC
-
The Hershey Company
- *Disclaimer: Major Players sorted in no particular order
Market Opportunities and Future Outlook
Whitespace is forming around functional differentiation that can be communicated simply at shelf level, particularly high-protein, higher-fiber, and lower-sugar propositions paired with clean-label positioning. In 2024, the International Food Information Council reported that 20% of U.S. consumers followed a high-protein diet, which supports continued product development in protein-forward bars alongside texture and format upgrades (layered, soft-baked, bites, and crisp structures) that aim to reduce sensory fatigue in a crowded bar aisle.
Manufacturing control and capacity access are also becoming more visible levers for brand expansion, especially when national listings require consistent supply and rapid packaging refreshes. Mars has pointed to large-scale U.S. snack manufacturing investment through 2026, and its Nature's Bakery facility in Salt Lake City, Utah has been positioned to produce nearly one billion snack bars annually, indicating how owned capacity can support broader bar portfolios and retail reach. At the same time, retail-channel expansion in 2026, including Target rollouts and large convenience networks, points to opportunity for brands that can execute omnichannel distribution while maintaining compliance-driven labeling discipline and allergen management across broader SKU counts.
Recent Industry Developments
- June 2026: Mars expanded the RXBAR High Protein line with a new Chocolate Chip Peanut Butter flavor positioned around a 19 g protein claim and a short ingredient list. The launch extends the brand's high-protein architecture with another mainstream flavor, supporting portfolio depth for retailers that are building functional snack sets.
- October 2025: General Mills launched Ghost-branded protein bars in collaboration with lifestyle brand Ghost, using a two-stick layered format. The tie-up brings a performance-lifestyle identity into the bar aisle and adds a differentiated texture format intended to compete beyond traditional single-slab protein bars.
- September 2024: VERB Energy expanded its retail presence to 91 GNC stores nationwide for its compact energy bars containing organic green tea. The wider placement in a specialty nutrition chain increased physical availability for an energy-positioned bar format and supported brand visibility alongside sports nutrition products.
Research Methodology Framework and Report Scope
Market Definition and Coverage
For this methodology, the market covers retail and online sales of energy bars in the United States, counted in value terms at the point where packaged products are sold through formal channels.
Scope exclusions: We do not include homemade or unpackaged snack substitutes, sports powders and drinks, or other non-bar functional foods that are not sold as bars.
Segmentation Overview
- By Product Type
- Organic
- Conventional
- By Protein Source
- Plant-Based
- Animal-Based
- By Function/Application
- Sports and Endurance Nutrition
- Meal Replacement
- Weight Management and Lifestyle Energy
- By Distribution Channel
- Supermarkets/Hypermarkets
- Convenience Stores
- Specialty Stores
- Online Retailers
- Other Distribution Channels
Data Sources, Market Sizing, and Validation
Desk Research
Desk research starts with public, non-paywalled references that help us frame demand and supply signals for packaged bars. We lean on sources such as USDA and other US government food and agriculture statistics, US Census retail and e-commerce releases, CDC nutrition and health indicators, and FDA updates that can shape labeling, ingredients, and claims.
Next, we add industry context from company filings, investor presentations, earnings transcripts, and product announcements, which help clarify pricing moves, channel focus, and portfolio changes. Trade association publications and reputable press are also used to check how categories like conventional and organic bars are discussed in the US market. Where needed, a paid subscription is used for company financials and intelligence, patent lookups, and selective news and financial data to support assumptions that are hard to verify from one public source alone. These examples are not exhaustive, and many other sources were consulted for data collection, validation, and research clarification.
Primary Interviews and Surveys
Primary work is used to convert category signals into realistic inputs for a US-only market model, especially around average selling prices, channel mix, and how shoppers trade between energy, protein, and meal replacement bars. We spoke with a mix of brand-side, distribution, ingredient, and retail experts across major US regions, and then we rechecked key assumptions when desk findings and field feedback did not line up.
Distribution of primary research fieldwork respondents
| Company type | Respondent position |
|---|---|
| Top tier: 33% | CXOs: 12% |
| Mid tier: 50% | Functional/Unit leaders: 29% |
| Smaller Players: 17% | Managers: 59% |
Market-Sizing & Forecasting
Market sizing is built using a top-down approach where category consumption and retail sell-through signals are reconstructed from US packaged-food indicators and channel patterns, and then converted into value using realistic price levels. To keep the totals grounded, selective bottom-up checks are run using sampled brand lineups, observed pack sizes, and channel-specific pricing to approximate volumes and revenue ranges, which are then used to adjust totals when the spread is too wide.
The model uses a set of practical inputs that tend to move the category year to year, including organic versus conventional mix, plant-based versus animal-based protein positioning, distribution split across supermarkets, convenience, specialist stores, and online retail, and the role of use-cases such as sports and endurance nutrition or meal replacement. Price progression is treated carefully, since promo intensity and ingredient cost pressure can change realized prices even if list prices rise. For forecasting, we use scenario analysis supported by a light multivariate regression check, where drivers like real disposable income trends, health and wellness participation cues, and e-commerce penetration are used to shape the forward path agreed with experts. When data gaps appear in smaller channels, the missing pieces are handled through conservative share-based allocations that are revalidated with interviews before finalizing.
Data Validation & Update Cycle
Validation is done through multiple checks so that the final number is consistent with independent signals, not only with one dataset. Outputs are compared against channel growth patterns, pricing direction, and category commentary from public company disclosures, and any sharp jumps are inspected before sign-off. If a mismatch is found, the driver assumption is revisited and, when needed, experts are re-contacted to confirm whether the shift is real or timing-related.
A second analyst review is completed to challenge the inputs, calculations, and scope logic, and then a final pass is done close to publication so figures reflect the latest available updates. The report is refreshed annually, and interim updates are made when material events occur that can change demand, pricing, or channel structure.
Mordor Intelligence's United States Energy Bar Market Size Measured Against Other Published Estimates
Published market sizes for US energy bars can differ even when the product looks similar, because each source sets its own category rules, channel coverage, and price treatment. Differences also come from the chosen base year, how inflation is handled, and whether the estimate is built from consumption signals or from broader packaged-snack revenues.
Some published figures group energy bars into wider snack, nutrition, and performance bar baskets, which lifts the total because adjacent bar types are counted together. In Mordor Intelligence, we count only products sold as energy bars within the United States and keep organic, protein source, application, and distribution splits inside that defined bar category, which limits spillover from meal replacement or other snack-bar definitions used elsewhere.
Benchmark comparison
| Source | Market Size | Gaps in Research Methodology |
|---|---|---|
| Mordor Intelligence | USD 1.65 B (2025) | |
| Industry Publisher A | USD 1.89 B (2025) | Uses a demand framing that can include a wider set of bar formats and pack configurations, which may pull in adjacent nutrition-bar revenues beyond a strict energy-bar definition. |
| Data Provider B | USD 5.40 B (2023) | Positions the market as a broad US bar category that explicitly includes protein, nutrition, meal replacement, and other specialty bars, so the scope is materially wider than energy bars alone and the base year is different. |
The spread across publishers is mainly explained by how narrowly the product category is defined, plus whether the estimate stays inside energy bars or expands into broader bar segments. By tying the model to clear channel mix and realistic pricing behavior, and then checking results with expert feedback, we keep the final number traceable to repeatable steps that a reader can follow.
Key Questions Answered in the Report
What is the current value of the United States energy bar market?
The sector is worth USD 1.72 billion in 2026 and is projected to reach USD 2.11 billion by 2031.
Which segment is growing fastest by protein source?
Animal-based protein bars are expanding at a 6.05% CAGR through 2031, outpacing plant-based alternatives.
How significant is online retail for energy bars?
Online channels are rising at a 5.98% CAGR, making them the most dynamic distribution avenue over the forecast period.
Which functional application currently holds the largest market share?
Weight management and lifestyle energy bars account for 45.60% of United States energy bar market size in 2025, maintaining category leadership.