Market Overview
| Study Period | 2021 - 2031 |
|---|---|
| Forecast Data Period | 2026 - 2031 |
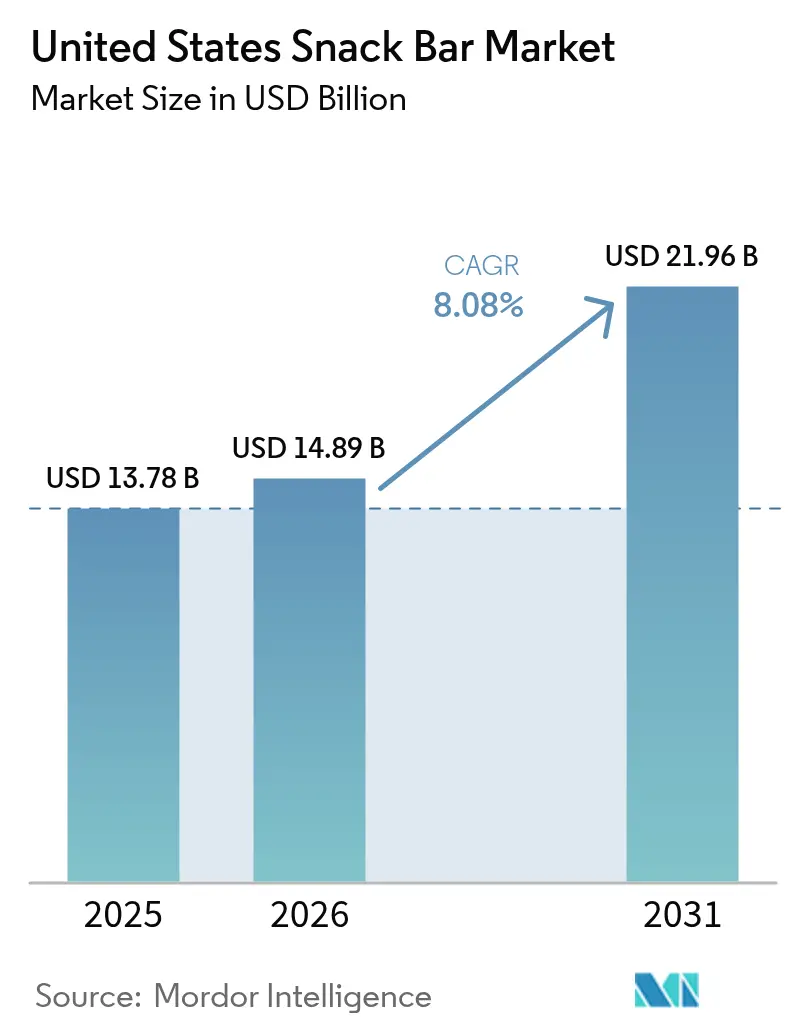
| Base Year Market Size (2025) | USD 13.78 Billion |
| Market Size (2026) | USD 14.89 Billion |
| Market Size (2031) | USD 21.96 Billion |
| Growth Rate (2026 - 2031) | 8.08% CAGR |
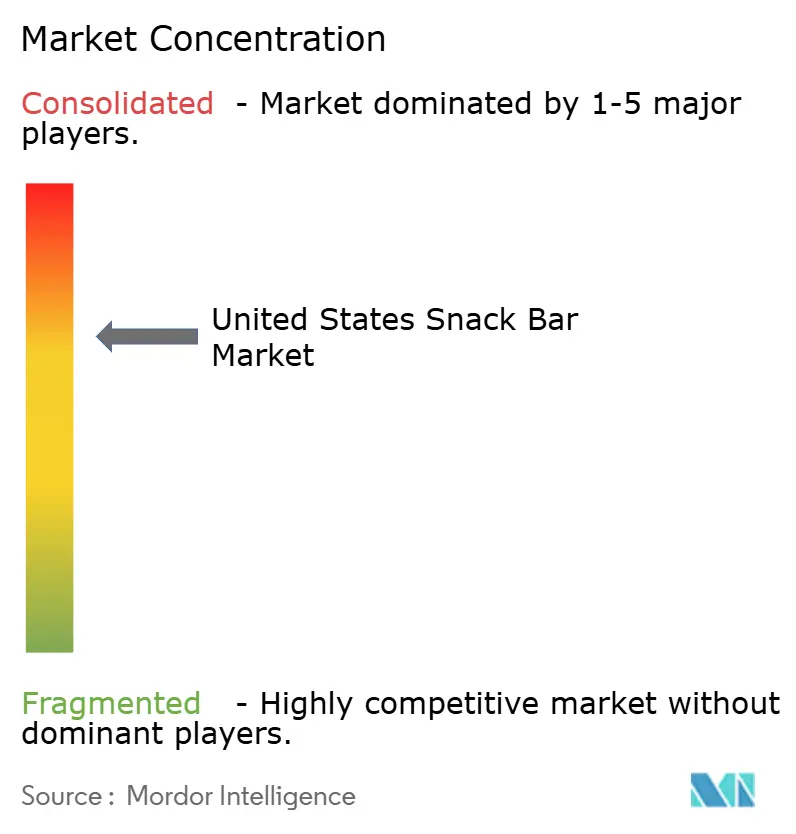
| Market Concentration | Medium |
Major Players
*Disclaimer: Major Players sorted in no particular order Image © Mordor Intelligence. Reuse requires attribution under CC BY 4.0. |
|
United States Snack Bar Market Analysis by Mordor Intelligence
TheUnited States snack bars market size is projected to expand from USD 13.78 billion in 2025, USD 14.89 billion in 2026, to USD 21.96 billion by 2031, registering an 8.08% CAGR between 2026 and 2031. Demand is shifting from convenience-led grab-and-go snacking toward portable nutrition that aligns with clean-label, high-protein, and weight-management goals. The nutritional and snack bars market is benefiting from the Food and Drug Administration (FDA) clarity on “healthy” claims, the surge of Glucagon-like peptide-1 (GLP-1) weight-loss therapy, and double-digit e-commerce penetration that lowers entry barriers for digital-first challengers. Mainstream retailers are rationalizing shelf space in favor of high-protein, low-sugar SKUs, while workplace micro-markets and rapid-delivery services are multiplying on-premise consumption occasions. Ingredient volatility and private-label pricing pressure continue to test gross margins, yet sustained product innovation and sustainability storytelling keep the nutritional and snack bars market on a strong growth arc.
Key Report Takeaways
- By product type, protein bars held 47.92% of the nutritional and snack bars market share in 2025, whereas fruit and nut bars are forecast to post the fastest 9.39% CAGR through 2031.
- By ingredient base, nut-based bars accounted for 33.12% of the nutritional and snack bars market size in 2025, while dairy and other protein blends are projected to grow at a 9.66% CAGR during 2026-2031.
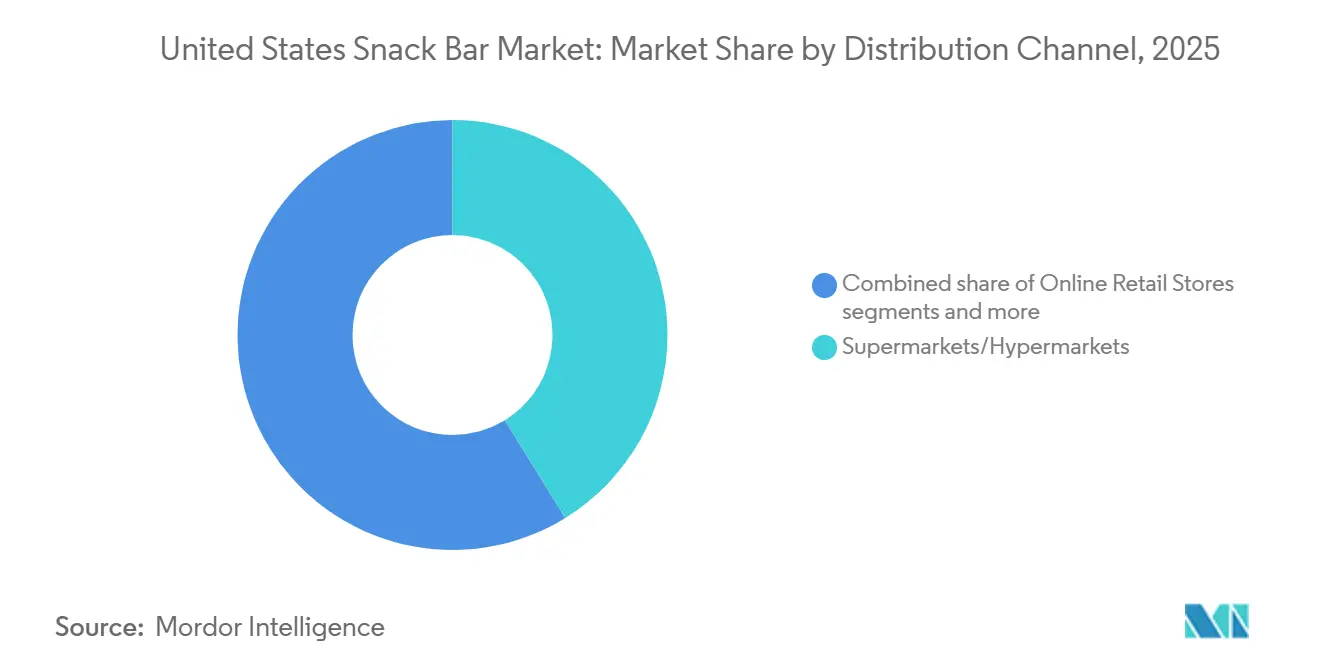
- By distribution channel, supermarkets and hypermarkets led with 41.22% revenue share in 2025, but online retail is the quickest-rising outlet at an 8.97% CAGR to 2031.
Note: Market size and forecast figures in this report are generated using Mordor Intelligence’s proprietary estimation framework, updated with the latest available data and insights as of 2026.
United States Snack Bar Market Trends and Insights
Drivers Impact Analysis*
| Driver | (~) % Impact on CAGR Forecast | Geographic Relevance | Impact Timeline |
|---|---|---|---|
| Health-and-wellness focus elevates nutritious, clean-label bars | +1.5% | National, with strongest penetration in West Coast, Northeast, and urban centers | Medium term (2-4 years) |
| High-protein, low-sugar reformulations win mass-market shelf space | +1.3% | National, led by major retail chains (Walmart, Kroger, Target, Costco) | Short term (≤ 2 years) |
| Fitness and sports-nutrition culture boosts protein-bar demand | +1.2% | National, concentrated in urban centers with high gym membership density | Medium term (2-4 years) |
| E-commerce/micro-fulfillment widens category availability | +1.0% | National, with highest penetration in major metropolitan areas | Short term (≤ 2 years) |
| GLP-1 weight-loss therapy spurs portion-controlled protein snacking | +0.9% | National, with early adoption in affluent urban and suburban markets | Medium term (2-4 years) |
| Corporate micro-markets increase workplace bar consumption | +0.7% | National, concentrated in corporate office hubs (New York, San Francisco, Chicago, Austin) | Long term (≥ 4 years) |
| Source: Mordor Intelligence | |||


Health-and-wellness focus elevates nutritious, clean-label bars
American shoppers now equate “healthy” with short ingredient lists, whole-food inclusions, and verifiable sourcing, a shift cemented when the FDA modernized its “healthy” definition in December 2024[1]Source: United States Food & Drug Administration, “FDA Finalizes Updated “Healthy” Nutrient Content Claim,” fda.gov. The rule lets bars rich in nuts and whole grains carry the claim even with higher total fat, provided saturated fat and sodium meet tighter caps. Brands such as Larabar capitalized quickly, launching Trail Mix bars with regeneratively farmed California almonds that pair provenance with 4 g protein and 3 g fiber per serving. Natural certifications USDA Organic, Non-GMO Project, and Regenerative Organic Certified are now shelf prerequisites in Whole Foods and Sprouts, insulating premium SKUs from private-label imitation. Come 2027, mandatory front-of-pack nutrient icons will further reward bars that already sit below new sugar and sodium thresholds, reinforcing the clean-label trajectory.
High-protein, low-sugar reformulations win mass-market shelf space
Retail planograms are increasingly focusing on SKUs that provide ≥10 g of protein and ≤5 g of added sugar, aligning with United States consumers' priorities of satiety and glycemic control. This shift reflects growing consumer awareness of the role of protein in promoting fullness and managing blood sugar levels, driving demand for products that meet these nutritional benchmarks. Mars has entered the functional product category with Snickers Hi Protein, which offers 20 g of protein and only 1 g of sugar per 55-g bar, expanding its well-known indulgent brand into the performance-focused segment. Similarly, Hershey’s United States launch of Fulfil bars and Kellanova’s protein-enhanced Nutri-Grain in January 2025 variants reflect this emphasis on macronutrient-driven offerings, targeting consumers seeking convenient, nutrient-dense snacks. Retailers are supporting these nutrient-focused products with end-cap placements and digital coupons, boosting sales velocity and phasing out slower-moving items from shelves.
Fitness and sports-nutrition culture boosts protein-bar demand
Strength training, recreational marathons, and boutique fitness studios have significantly contributed to the mainstream adoption of sports nutrition. Quest’s Protein Cereal Bars, launched in January 2025, deliver 15 g of protein per serving, targeting the breakfast hour, an underserved daypart in the protein category. This launch aligns with growing consumer demand, as highlighted by a 2025 Empower survey, which revealed that 72% of United States adults are willing to increase their spending on protein products[2]Source: EMPOWER, “The Protein is Extra,” ota.com, empower.com. Among these, bars have emerged as the second-most preferred format after powders, reflecting their convenience and portability. Athlete endorsements and sampling initiatives at CrossFit gyms and other fitness centers have further bolstered consumer trust and peer-to-peer validation, creating a competitive edge that private-label SKUs struggle to replicate. These factors have enabled premium average selling prices (ASPs) to remain resilient, even as economic sentiment shows signs of softening.
E-Commerce/micro-fulfillment widens category availability
Digital storefronts have eliminated geographic barriers that previously restricted access to specialty bars for rural shoppers, enabling broader market penetration. With the significant growth of e-commerce sales across the United States, online distribution channels are projected to achieve a high CAGR during the study period. For example, the Census Bureau of the Department of Commerce reported that the third-quarter 2025 e-commerce estimate increased by 5.1 percent (±1.2%) compared to the third quarter of 2024[3]Source: United States Census Bureau, "Quarterly Retail E-Commerce Sales," census.gov. Subscribe and Save discounts ranging from 5% to 25% incentivize bulk purchases, encouraging pantry stocking among consumers. Additionally, 30-minute courier delivery windows have transformed bars into convenient impulse purchases for urban consumers in cities like New York and Los Angeles. This approach boosts weekday sales volumes while reinforcing habitual consumption patterns among employees, further driving growth in the category.
Restraints Impact Analysis*
| Restraint | (~) % Impact on CAGR Forecast | Geographic Relevance | Impact Timeline |
|---|---|---|---|
| "Healthy" claim compliance and added-sugar labeling costs | -0.6% | National, with highest burden on small and mid-sized U.S. manufacturers | Short term (≤ 2 years) |
| Fierce price competition from traditional snacks and private label | -0.8% | National, most acute at mass retailers (Walmart, Kroger, Costco, Aldi) | Medium term (2-4 years) |
| Volatile specialty plant-protein input costs squeeze margins | -0.5% | National, with exposure to Canadian pea protein supply disruptions | Medium term (2-4 years) |
| Difficulty in balancing taste with health and nutritional value | -0.4% | National, with regional variations in sweetness preferences (South prefers sweeter profiles) | Long term (≥ 4 years) |
| Source: Mordor Intelligence | |||
"Healthy" claim compliance and added-sugar labeling costs
Front-of-pack icons slated for 2027 will force label redesigns and possible reformulations, significantly impacting smaller firms with an estimated increase in non-recurring spend by 10%-15%, as per the Food and Drug Administration. These changes will require companies to adapt their packaging and potentially reformulate products to meet new regulatory standards. The 2024 “healthy” rule has already introduced stricter sodium and saturated-fat ceilings, pushing mid-tier brands to either modify their ingredients or forfeit the "healthy" claim. Larger players, with their extensive portfolios, are better positioned to absorb these costs, further widening the cost disparity between large corporations and smaller competitors. This regulatory shift is expected to drive innovation in ingredient sourcing and product development, as brands strive to maintain compliance while meeting consumer expectations for taste and nutrition.
Fierce price competition from traditional snacks and private label
Retailer brands priced 15%-25% below flagship bars surpassed the 25% penetration threshold in 2025 at major retailers such as Walmart, Costco, and Aldi. This growth highlights the increasing consumer preference for cost-effective alternatives that still deliver on nutritional value. Concurrently, Frito-Lay’s introduction of protein-enriched chips has further blurred the lines between snack categories, intensifying competition for consumer spending. This shift in the market landscape has created additional pressure on mid-tier bar brands, which now face the dual challenge of maintaining competitive pricing and offering unique value propositions. Without superior macronutrient profiles or compelling provenance storytelling, these mid-tier brands risk SKU rationalization during retailer line reviews, potentially losing shelf space to more innovative or cost-effective alternatives.
*Our forecasts treat driver/restraint impacts as directional, not additive. The impact forecasts reflect baseline growth, mix effects, and variable interactions.
Segment Analysis
By Product Type: Protein Bars Lead, Fruit-and-Nut Formats Accelerate
Protein bars held 47.92% of the United States snack bar market share in 2025, anchored by 15-20 g whey-isolate formats popular with gym-goers and weekend athletes. Quest’s Protein Cereal Bar launch broadened daypart reach, proving that morning macros can coexist with cereal familiarity. Direct-to-consumer bundles offering 12-pack autoship discounts lock in repeat unit velocity, sustaining the United States snack bar market size leadership for the segment.
Fruit-and-nut bars, while smaller, post the quickest climb at 9.39% CAGR, powered by date-sweetened labels that skirt FDA added-sugar scrutiny. Larabar’s regenerative-almond narrative resonates with eco-minded coastal buyers, while the segment’s whole-food texture appeals to shoppers wary of protein-bar chalkiness. Furthermore, the segment is gaining traction among health-conscious consumers who prioritize minimally processed ingredients. Brands are increasingly highlighting certifications such as organic, non-GMO, and fair trade to align with evolving consumer preferences.


By Ingredient Base: Nut-Based Dominance, Dairy-Protein Blends Innovate
Nut-centric SKUs represented 33.12% of ingredient usage in 2025, with California almonds supplying both texture and a healthy-fat halo. Almond derivatives, paste, flour, and protein each posted double-digit volume gains as formulators sought to enhance flavor depth without relying on artificial additives. This significant base underpins the stability of the United States snack bar market, yet it also exposes costs to fluctuations in drought-indexed orchard prices, which could impact profitability and pricing strategies.
Dairy-and-other protein blends are expanding at a 9.66% CAGR as brands increasingly mix whey isolate with plant-based proteins like pea or rice to achieve a balance between sustainability and taste. This approach caters to evolving consumer preferences for environmentally friendly yet flavorful options. Glanbia’s probiotic-fortified whey partnership exemplifies the trend of multifunctional layering, which can justify premium price points by offering added health benefits. These hybrid formulations are projected to capture a growing share of the United States snack bar market.
By Distribution Channel: Supermarkets/Hypermarkets Anchor, Online Retail Surges
Supermarkets and hypermarkets delivered 41.22% of the 2025 volume thanks to checkout adjacency and high foot traffic in Walmart, Kroger, and Target. End-cap promotions and in-store sampling continue to seed trial, but shelf resets increasingly purge SKUs lacking ≤5 g added sugar or ≥10 g protein, concentrating facings among nutrient-dense leaders. Additionally, private-label offerings in these retail formats are gaining traction, as retailers leverage their own brands to offer competitive pricing and align with consumer preferences for healthier snack options.
Online retail claims the sharpest growth trajectory at 8.97% CAGR. Amazon’s algorithmic storefronts surface niche flavors to rural shoppers, while Subscribe and Save auto-deliveries underpin predictable repeat purchases that enlarge the United States snack bar market size through basket expansion. Emerging brands exploit this zero-slotting-fee route to build data flywheels before venturing into brick-and-mortar. Furthermore, the rise of direct-to-consumer (DTC) platforms has enabled smaller brands to establish a strong online presence, offering personalized subscription models and exclusive product bundles.
Geography Analysis
Per-capita consumption peaks on the West Coast and Northeast, where higher household incomes and entrenched wellness cultures sustain premium ASPs. Metropolitan clusters such as Los Angeles, San Francisco, Seattle, New York, and Boston register the highest velocities for organic, protein-fortified SKUs, reinforcing a coastal skew within the United States snack bar market. Natural-channel retailers, abundant in these regions, give smaller clean-label entrants a launchpad before national expansion. Additionally, the presence of health-conscious consumers in these areas drives innovation in snack bar formulations.
The South and Midwest supply the steepest growth curve from a smaller base. Texas, Florida, and Georgia gyms enrolled record new members in 2025, nurturing demand for high-protein recovery formats. Walmart’s regional dominance can either propel or block emergent brands, depending on their trade-promotion war chests. Furthermore, the growing popularity of fitness and wellness trends in these regions is encouraging snack bar manufacturers to invest in targeted marketing campaigns and partnerships with local gyms and fitness centers to boost brand visibility and consumer engagement.
Across all regions, urban ZIP codes outpace suburban and rural areas owing to dense fitness facilities, office micro-markets, and younger demographics. Yet e-commerce penetration is rising fastest in suburbia, plugging assortment gaps for households distant from specialty grocers. By 2031, balanced regional diffusion is expected to smooth historical consumption disparities, broadening the revenue base of the United States snack bar market.
Competitive Landscape
The United States snack bar market records a moderately high concentration, signifying that multinationals Mondelēz, Mars, Nestlé, and General Mills control most retail facings through portfolio breadth and eight-figure trade-promotion budgets. Their scale secures ingredient contracts that mute margin shocks from pea-protein spikes and funds rapid compliance with evolving FDA labeling rules. These companies also leverage their established distribution networks and brand equity to maintain dominance, ensuring their products are widely available across both traditional and digital retail channels.
Digital-first challengers are nonetheless chipping away. Built Brands, GoMacro, and Perfect Snacks rely on 5%-25% autoship discounts, influencer videos, and low-overhead fulfillment centers to sidestep slotting fees and cultivate brand tribes online. These brands are also capitalizing on direct-to-consumer (DTC) models, which allow them to gather consumer insights, test new flavors, and build loyalty through personalized marketing. Sustainability storytelling is another wedge: Act Bar’s upcycled brewery-grain protein and Larabar’s regenerative-almond sourcing tap circular-economy and soil-health narratives that resonate with Gen Z. Additionally, these smaller players are increasingly focusing on certifications such as organic, non-GMO, and fair trade to differentiate themselves in a crowded market.
Looking forward, whitespace lies in multifunctional hybrids bars that fuse complete proteins with gut-health probiotics or stress-modulating adaptogens while regional tailoring will differentiate flavor portfolios, especially in the sugar-leaning South. For instance, brands may explore incorporating local ingredients or flavors that cater to regional palates, such as pecan or citrus-based options in the South. Additionally, the integration of functional ingredients like collagen, turmeric, or ashwagandha could appeal to health-conscious consumers seeking added benefits beyond basic nutrition. Brands able to marry sensory pleasure, clinical nutrition, and transparent sourcing stand to command premium slices of future United States snack bar market share.
United States Snack Bar Industry Leaders
-
Mondelēz International Inc.
-
General Mills Inc.
-
Mars Inc.
-
Simply Good Foods Co.
-
Abbott Laboratories
- *Disclaimer: Major Players sorted in no particular order

Recent Industry Developments
- February 2026: ALOHA unveiled its Cookies & Crème Protein Bar across the United States. This new offering boasts a creamy white chocolate exterior, chocolate cookie bits, enriched with cocoa, and accented by a sea salt. Each bar is claimed to offer 14g of plant-based protein sourced from pumpkin seeds and brown rice, alongside 10g of fiber, and a mere 5g of sugar.
- October 2025: JiMMYBAR! Functional Protein, a family-run brand based in Illinois, launched its creatine protein bar. The product was made available nationwide through retailers such as Walmart, Amazon, and TikTok Shop, and is offered in Double Fudge Brownie and Chocolate Peanut Butter flavors.
- October 2025: GHOST launched its protein bar in partnership with General Mills, featuring a distinctive two-stick layered format inspired by classic candy bars. The bars offer 20g protein, 2g sugar, and 250-270 calories in three flavors.


United States Snack Bar Market Report Scope
Snack bars are portable, ready-to-eat food products made from a compressed mixture of grains (such as oats or granola), nuts, seeds, dried fruits, sweeteners (such as honey or syrup), and occasionally protein sources, chocolate, or functional ingredients like vitamins and fiber. They are designed as convenient, shelf-stable snacks that offer quick energy, nutrition, or meal replacement, often targeted at health-conscious consumers, athletes, or individuals with busy lifestyles. The United States Snack Bar Market is segmented by product type, ingredient base, and distribution channel. By product type, the market is segmented by cereal bars, energy and nutrition bars, protein bars, fruit and nut bars, and meal-replacement bars. By ingredient base, the market is segmented by nut-based, granola/oat-based, date-based, dairy/animal-protein, and plant-protein blends. By distribution channel, the market is segmented by supermarkets/hypermarkets, convenience/grocery stores, online retail stores, and other distribution channels. Market sizing is presented in both value (USD) and volume (tons) across all the above segments.
By Product Type
| Cereal Bars |
| Energy and Nutrition Bars |
| Protein Bars |
| Fruit and Nut Bars |
| Meal-Replacement Bars |
By Ingredient Base
| Nut-based |
| Granola/Oat-based |
| Date-based |
| Dairy/Animal-protein |
| Plant-protein Blends |
By Distribution Channel
| Supermarkets/Hypermarkets |
| Convenience/Grocery Stores |
| Online Retail Stores |
| Other Distribution Channels |
| By Product Type | Cereal Bars |
| Energy and Nutrition Bars | |
| Protein Bars | |
| Fruit and Nut Bars | |
| Meal-Replacement Bars | |
| By Ingredient Base | Nut-based |
| Granola/Oat-based | |
| Date-based | |
| Dairy/Animal-protein | |
| Plant-protein Blends | |
| By Distribution Channel | Supermarkets/Hypermarkets |
| Convenience/Grocery Stores | |
| Online Retail Stores | |
| Other Distribution Channels |


Market Definition
- Milk and White Chocolate - Milk chocolates is a solid chocolate made with milk (in the form of either milk powder, liquid milk, or condensed milk) and cocoa solids. White chocolate is made from cocoa butter and milk and contains no cocoa solids whatsoever. The scope includes regular chocolates, low-sugar, and sugar-free variants
- Toffees & Nougats - Toffees include hard, chewy, and small or one-bite candies marketed with labels as toffee or toffee-like confectionery. Nougat is a chewy confection with almond, sugar, and egg white as a basic ingredient; and it originated in Europe and Middle East countries.
- Cereals Bars - A snack composed of breakfast cereal that has been compressed into a bar shape and is held together with a form of edible adhesive. The scope includes snack bars made with cereals such as rice, oats, corn, etc. mixed with a binding syrup. These also include products labeled as cereal bars, cereal treat bars, or grain bars.
- Chewing Gum - This is a preparation for chewing, usually made of flavored and sweetened chicle or such substitutes as polyvinyl acetate. The types of chewing gums included in the scope are sugar-chewing gums and sugar-free chewing gums
| Keyword | Definition |
|---|---|
| Dark Chocolate | Dark chocolate is a form of chocolate containing cocoa solids and cocoa butter without the milk. |
| White Chocolate | White chocolate is the type of chocolate containing the highest percentage of milk solids, typically around or over 30 percent. |
| Milk Chocolate | Milk chocolate is made from dark chocolate that has a low cocoa solid content and higher sugar content, plus a milk product. |
| Hard Candy | A candy made of sugar and corn syrup boiled without crystallizing. |
| Toffees | A hard, chewy, often brown sweet that is made from sugar boiled with butter. |
| Nougats | A chewy or brittle candy containing almonds or other nuts and sometimes fruit. |
| Cereal bar | A cereal bar is a bar-shaped food product, made by pressing cereals and usually dried fruit or berries, which are in most cases held together by glucose syrup. |
| Protein bar | Protein bars are nutrition bars that contain a high proportion of protein to carbohydrates/fats. |
| Fruit & Nut bar | These are often based on dates with other dried fruit and nut additions and, in some cases, flavorings. |
| NCA | The National Confectioners Association is an American trade organization that promotes chocolate, candy, gum and mints, and the companies that make these treats. |
| CGMP | Current good manufacturing practices are those conforming to the guidelines recommended by relevant agencies. |
| Unstandardized foods | Unstandardized foods are those that do not have a standard of identity or that deviate from a prescribed standard in any manner. |
| GI | The glycemic index (GI) is a way of ranking carbohydrate-containing foods based on how slowly or quickly they are digested and increase blood glucose levels over a period of time |
| Skimmed milk powder | Skimmed milk powder is obtained by removing water from pasteurized skim milk by spray-drying. |
| Flavanols | Flavanols are a group of compounds found in cocoa, tea, apples, and many other plant-based foods and beverages. |
| WPC | Whey protein concentrate- the substance obtained by the removal of sufficient nonprotein constituents from pasteurized whey so that the finished dry product contains greater than 25% protein. |
| LDL | Low density Lipoprotein- the bad cholesterol |
| HDL | High density Lipoprotein- the good cholesterol |
| BHT | butylated Hydroxytoluene is a lab-made chemical that is added to foods as a preservative. |
| Carrageenan | Carrageenan is an additive used to thicken, emulsify, and preserve foods and drinks. |
| Free form | Not containing certain ingredients, such as gluten, dairy, or sugar. |
| Cocoa butter | It is a fatty substance obtained from cocoa beans, used in the manufacture of confectionery. |
| Pastellies | A type of of Brazilian candy made from sugar, eggs, and milk. |
| Draggees | Small, round candies that are coated with a hard sugar shell |
| CHOPRABISCO | Royal Belgian Association of the chocolate, pralines, biscuit, and confectionery industry- A trade association that represents the Belgian chocolate industry. |
| European Directive 2000/13 | A European Union directive that regulates the labeling of food products |
| Kakao-Verordnung | The German chocolate ordinance, a set of regulations that define what can be labeled as "chocolate" in Germany. |
| FASFC | Federal Agency for the Safety of the Food Chain |
| Pectin | A natural substance that is derived from fruits and vegetables. It is used in confectionery to create a gel-like texture. |
| Invert sugars | A type of sugar that is made up of glucose and fructose. |
| Emulsifier | A substance that helps to mix to liquids that does not mix together. |
| Anthocyanins | A type of flavonoid that is responsible for the red, purple, and blue colors of confectionery. |
| Functional Foods | Foods that have been modified to provide additional health benefits beyond basic nutrition. |
| Kosher certificate | This certification verifies that the ingredients, production process including all machinery, and/or food-service process complies with the standards of Jewish dietary law |
| Chicory root extract | A natural extract from the chicory root that is a good source of fiber, calcium, phosphorous, and folate |
| RDD | Recommended daily dose |
| Gummies | A chewy gelatin-based candy that is often flavored with fruit. |
| Nutraceuticals | Food or dietary supplements that are claimed to have health benefits. |
| Energy bars | Snack bars that are high in carbohydrates and calories are designed to provide energy on the go. |
| BFSO | Belgian Food Safety Organization for the food chain. |


Research Methodology
Mordor Intelligence follows a four-step methodology in all our reports.
- Step-1: Identify Key Variables: In order to build a robust forecasting methodology, the variables and factors identified in Step 1 are tested against available historical market numbers. Through an iterative process, the variables required for market forecast are set, and the model is built on the basis of these variables.
- Step-2: Build a Market Model: Market-size estimations for the forecast years are in nominal terms. Inflation is not a part of the pricing, and the average selling price (ASP) is kept constant throughout the forecast period for each country.
- Step-3: Validate and Finalize: In this important step, all market numbers, variables, and analyst calls are validated through an extensive network of primary research experts from the market studied. The respondents are selected across levels and functions to generate a holistic picture of the market studied.
- Step-4: Research Outputs: Syndicated Reports, Custom Consulting Assignments, Databases & Subscription Platforms


