Natural Cosmetics Market Size and Share
Market Overview
| Study Period | 2020 - 2030 |
|---|---|
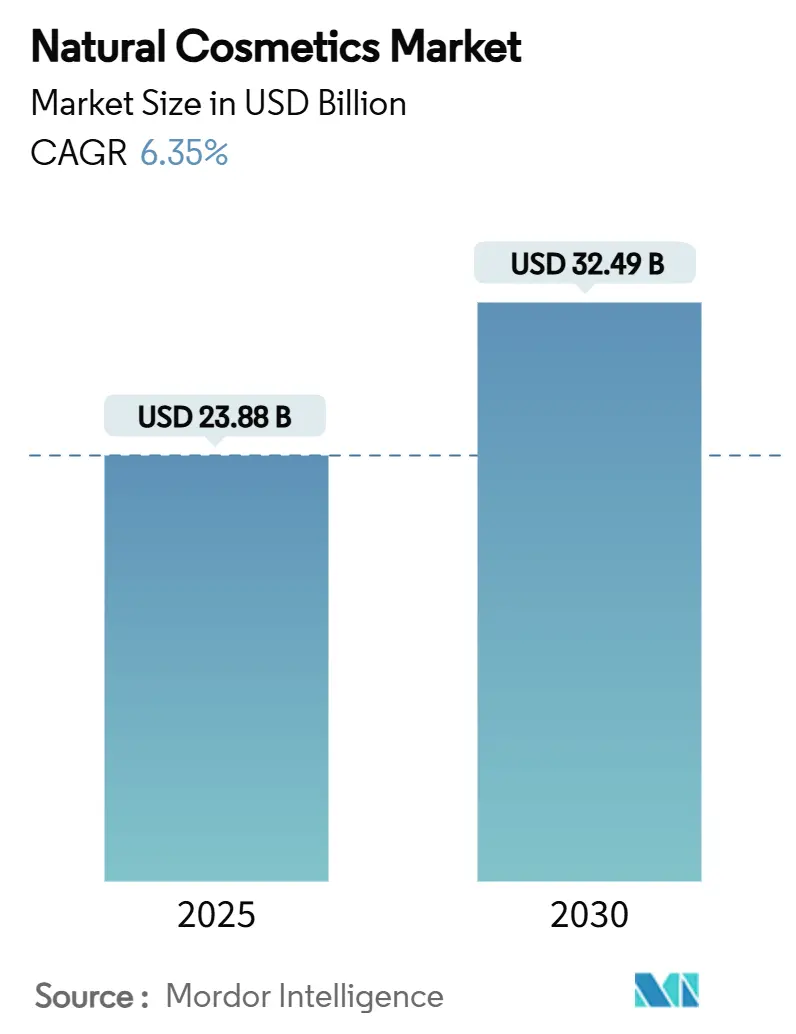
| Market Size (2025) | USD 23.88 Billion |
| Market Size (2030) | USD 32.49 Billion |
| Growth Rate (2025 - 2030) | 6.35% CAGR |
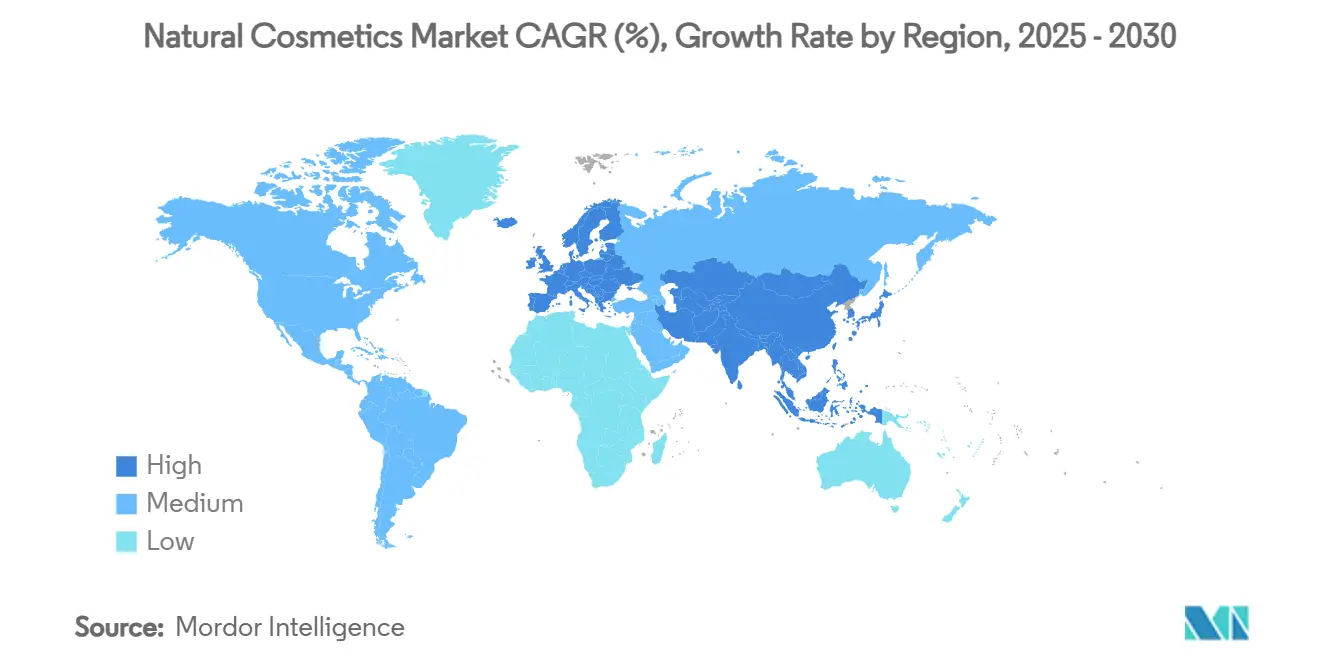
| Fastest Growing Market | Asia Pacific |
| Largest Market | Asia Pacific |
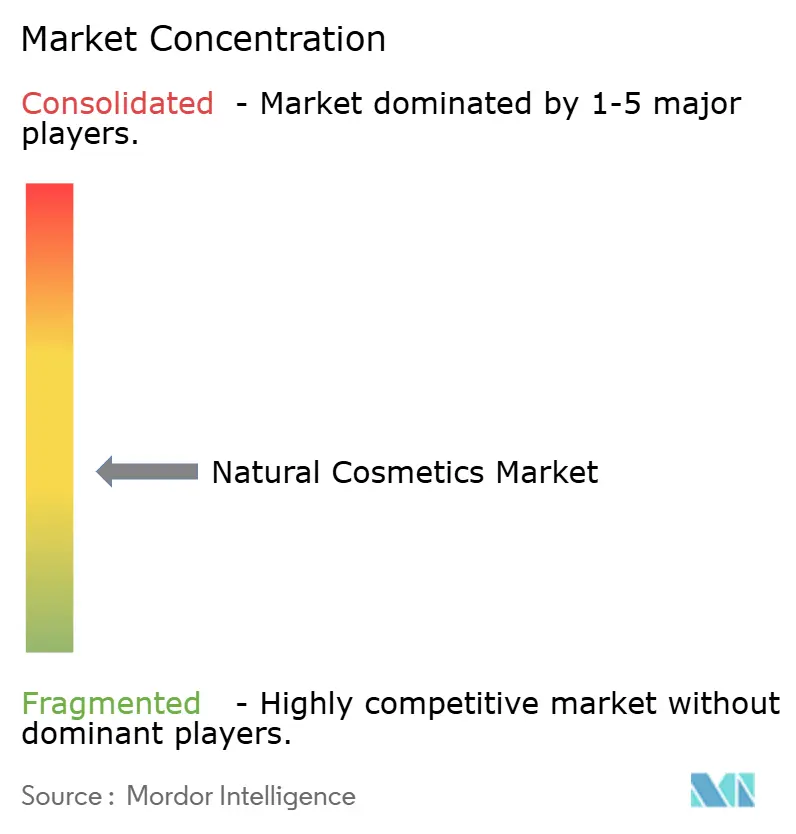
| Market Concentration | Medium |
Major Players
*Disclaimer: Major Players sorted in no particular order Image © Mordor Intelligence. Reuse requires attribution under CC BY 4.0. |
|
Natural Cosmetics Market Analysis by Mordor Intelligence
The natural cosmetics market size stands at USD 23.88 billion in 2025, projected to reach USD 32.49 billion by 2030, expanding at a compound annual growth rate of 6.35% CAGR. This growth trajectory reflects the industry's transition from niche wellness positioning to mainstream consumer adoption, driven by regulatory tightening around synthetic ingredients and the convergence of beauty with health-conscious lifestyle choices. The market's resilience stems from its ability to command premium pricing while addressing safety concerns that traditional cosmetics struggle to resolve through conventional formulation approaches. This expansion is attributed largely to rising health and environmental concerns, with more consumers—especially millennials and Gen Z—preferring cosmetics that are perceived as safer, ethically produced, and environmentally friendly. Regulatory support, advances in biotechnology, and the spread of e-commerce and digital marketing have further accelerated this shift, making natural cosmetics increasingly visible and accessible globally. Social media, beauty influencers, and the clean-label movement are shaping consumer perceptions, increasing transparency expectations, and propelling innovation across product categories. Overall, rapid new product introductions, the entry of multinational conglomerates, and steady consumer demand for personalized and sustainable beauty are expected to continue driving impressive growth in the natural cosmetics sector worldwide
Key Report Takeaways
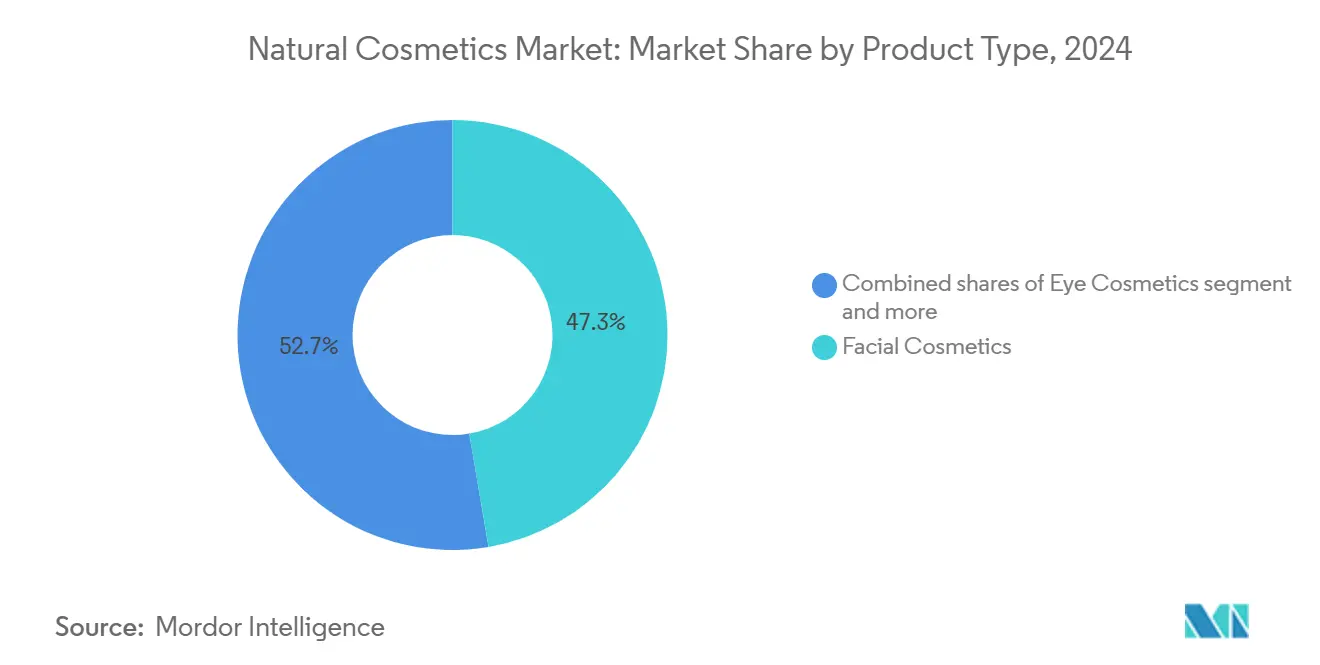
- By product type, facial cosmetics led with 47.33% revenue share in 2024; eye cosmetics are forecast to expand at a 6.73% CAGR through 2030.
- By gender, female shoppers commanded 90.67% of the natural cosmetics market share in 2024, whereas the male segment is advancing at 7.45% CAGR to 2030.
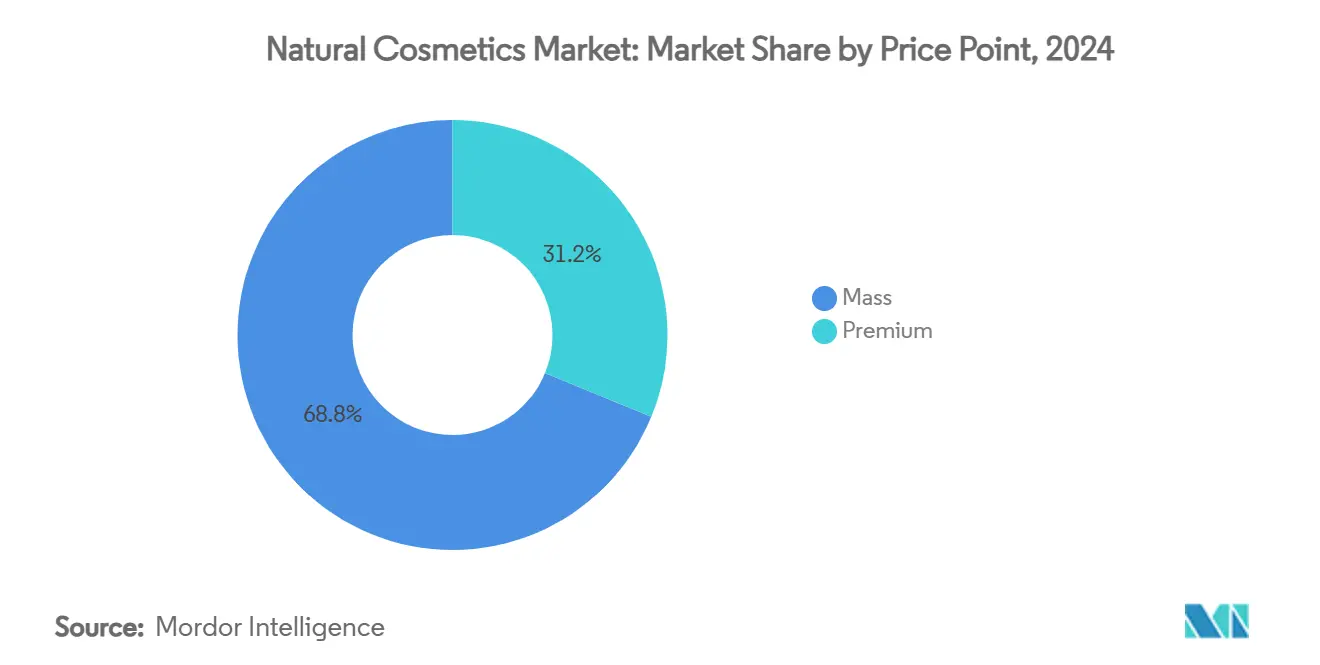
- By price point, mass products held 68.79% of 2024 revenue, while premium lines are set to grow at 7.11% CAGR through 2030.
- By distribution channel, specialty stores captured 46.54% of 2024 sales; online retail is projected to rise at 6.87% CAGR to 2030.
- By geography, Asia-Pacific contributed 33.21% of revenue in 2024 and is projected to expand at 7.83% CAGR to 2030.
Global Natural Cosmetics Market Trends and Insights
Drivers Impact Analysis*
| Driver | (~) % Impact on CAGR Forecast | Geographic Relevance | Impact Timeline |
|---|---|---|---|
| Popularity of Vegan and Cruelty-Free Products | +1.0% | Global, with stronger impact in North America and European Union | Medium term (2-4 years) |
| Celebrity Endorsements and Influencer Marketing | +0.8% | Global, particularly strong in Asia-Pacific and North America | Short term (≤ 2 years) |
| Rising Demand for Sensitive Skin Solutions | +0.6% | Global, with emphasis in developed markets | Long term (≥ 4 years) |
| Personalization and AI-Driven Beauty Tech | +0.5% | North America and European Union core, spill-over to Asia-Pacific | Medium term (2-4 years) |
| Innovation in Formulations | +0.4% | Global, led by R&D centers in North America and European Union | Long term (≥ 4 years) |
| Product Availability and Retail Expansion | +0.3% | Asia-Pacific core, expanding to Middle East and Africa and South America | Medium term (2-4 years) |
| Source: Mordor Intelligence | |||
Popularity of Vegan and Cruelty-Free Products
The demand for vegan and cruelty-free products in the natural cosmetics market is surging due to several converging factors. Consumers—especially Millennials and Gen Z—are increasingly driven by ethical and environmental values, seeking products that align with their stance against animal testing and preference for plant-based or non-toxic ingredients. This demographic shift has led to a sharp increase in demand for certified cruelty-free and vegan beauty, as shoppers are willing to pay a premium for transparent, clean-labeled formulations that exclude animal-derived ingredients like beeswax and lanolin and are not tested on animals. Consumer advocacy around animal welfare has evolved from ethical positioning to regulatory mandate, with the European Union’s animal testing ban creating a compliance framework that natural cosmetics brands leverage for competitive advantage. This regulatory foundation enables manufacturers to market cruelty-free credentials as legal compliance rather than voluntary commitment, reducing consumer skepticism about greenwashing. The trend extends beyond testing protocols to ingredient sourcing, where plant-based alternatives replace animal-derived components like lanolin and carmine. NATRUE's 2024 sustainability guidelines emphasize transparency in supply chain practices, requiring brands to document cruelty-free certifications throughout their ingredient procurement processes [1]Source: The International Natural and Organic Cosmetic Association, "Sustainability Guidelines", natrue.org. The shift toward vegan formulations also addresses religious and cultural dietary restrictions that extend to personal care products, expanding addressable market segments in regions with diverse religious populations.
Celebrity Endorsements and Influencer Marketing
With social media platforms at the center of beauty conversations, celebrities and influencers provide instant credibility and aspirational value, guiding consumer choices toward products that emphasize ingredient safety, ethical sourcing, and environmental sustainability. Their authentic storytelling and personal use demonstrations resonate deeply with health- and eco-conscious consumers—particularly Millennials and Gen Z—who are more likely to trust peer and celebrity recommendations over traditional advertising. High-profile figures can quickly shift trends—when a celebrity or influencer showcases a natural makeup routine or publicly commits to using only clean-label beauty products, their followers often emulate these choices, rapidly expanding market penetration and brand loyalty. For instance, actress, model and outspoken anti-vaxxer Jenny McCarthy launched a vegan cosmetics brand—Formless Beauty. The product line was eco-friendly, cruelty-free and made with ingredients that were easy to understand. Moreover, influencer-led product launches and collaborations frequently sell out, illustrating the potent impact digital personalities have on purchasing behavior within this segment. The ripple effect not only boosts short-term sales but also increases the long-term visibility and credibility of natural cosmetic brands, reinforcing consumer trust and encouraging industry-wide adoption of transparent, sustainable practices
Rising Demand for Sensitive Skin Solutions
Rising demand for sensitive skin solutions is a significant driver in the natural cosmetics market, as increasing numbers of consumers experience skin irritation, allergies, and sensitivities due to environmental pollutants, stress, and exposure to harsh chemicals in traditional skincare and makeup products. This trend has led to a surge in preference for natural cosmetics formulated with plant-based, organic, and non-toxic ingredients that are perceived as safer and more compatible with sensitive skin. The FDA's modernized cosmetics regulation requires manufacturers to report serious adverse events within 15 business days, elevating safety considerations in product development [2]Source: U.S Food and Drug Administration, "FDA Issues Updated Instructions for Serious Adverse Event Reporting for Cosmetic Products", fda.gov. Natural ingredients like oat-derived avenanthramides demonstrate clinically proven anti-inflammatory properties, with Symrise's SymCalmin® Avena showing effectiveness in alleviating itching and redness while maintaining COSMOS certification. The trend extends beyond reactive treatment to preventive skincare, where consumers seek products that strengthen skin barrier function rather than merely addressing symptoms. This shift requires manufacturers to invest in clinical testing and dermatological validation, creating barriers to entry that favor established players with research capabilities.
Personalization and AI-Driven Beauty Tech
The integration of personalization and AI-driven technologies is fundamentally reshaping the natural cosmetics market, propelling it toward greater consumer satisfaction, transparency, and sustainability, and setting new benchmarks for innovation and trust. Advanced AI tools analyze consumers’ unique profiles to suggest natural foundations, eyeshadows, and lip colors that align with both their aesthetic desires and clean ingredient preferences, ensuring better compatibility and reducing returns. Virtual try-on technology lets customers visualize subtle, natural finishes before purchasing, building confidence in shade selection while minimizing uncertainty. Additionally, AI supports brands in formulating innovative, clean-label products by identifying sustainable, plant-based ingredients and enhancing transparency through traceable supply chains. These technologies also foster sustainability by optimizing eco-friendly packaging design and reducing waste. By combining personalization, transparency, and sustainability, AI-driven solutions boost consumer trust and accelerate growth in the natural color cosmetics market, helping brands connect authentically with discerning, ethically minded customers.
Restraints Impact Analysis*
| Restraint | (~) % Impact on CAGR Forecast | Geographic Relevance | Impact Timeline |
|---|---|---|---|
| Counterfeit and Low-Quality Products | -0.7% | Global, particularly severe in Asia-Pacific and Middle East and Africa | Short term (≤ 2 years) |
| Certification Inconsistency | -0.5% | Global, with regulatory fragmentation across regions | Long term (≥ 4 years) |
| Higher R&D and Compliance Costs | -0.4% | North America and European Union primarily, expanding globally | Medium term (2-4 years) |
| Allergic Reactions and Sensitivities | -0.3% | Global, with higher impact in developed markets | Long term (≥ 4 years) |
| Source: Mordor Intelligence | |||
Counterfeit and Low-Quality Products
E-commerce platform proliferation has enabled counterfeit natural cosmetics to enter markets through de minimis exemptions and limited inspection capacity, with the US Consumer Product Safety Commission facing overwhelming import volumes from China [3]Source: US-China Economic and Security Review Commission, "Unsafe and Unregulated Chinese Consumer Goods", uscc.gov. These products often contain prohibited substances or fail to meet organic certification standards, creating safety risks that undermine consumer confidence in legitimate natural cosmetics. An August 2024 report on illegal sales from the Argentine Chamber of Trade and Services (CAC) indicated that Barrio Once represented 27.7% of total illegal street vendors in the City of Buenos Aires. The challenge intensifies in developing markets where regulatory enforcement remains limited and price sensitivity drives consumers toward unverified products. Brand protection requires investment in authentication technologies, legal enforcement, and consumer education, diverting resources from product development and market expansion. The proliferation of counterfeit products also creates regulatory pressure for stricter import controls and platform accountability, potentially increasing compliance costs for legitimate manufacturers.
Certification Inconsistency
The absence of harmonized global standards for natural and organic cosmetics creates regulatory fragmentation that increases compliance costs and consumer confusion. While COSMOS certification covers over 29,000 products internationally, regional variations in USDA, NATRUE, and national standards require manufacturers to navigate multiple certification processes for global market access. The FDA's lack of formal definitions for 'natural' and 'organic' in cosmetics contrasts with USDA's agricultural product standards, creating legal ambiguity that competitors exploit through misleading claims. This inconsistency particularly affects smaller manufacturers who lack resources to obtain multiple certifications, limiting their market reach and competitive positioning. The challenge extends to ingredient sourcing, where suppliers must meet varying certification requirements across different markets, increasing supply chain complexity and costs.
*Our forecasts treat driver/restraint impacts as directional, not additive. The impact forecasts reflect baseline growth, mix effects, and variable interactions.
Segment Analysis
By Product Type: Facial Cosmetics Lead Through Skincare Integration
Facial cosmetics command 47.33% market share in 2024, driven by the convergence of makeup categories that emphasizes skin health over coverage. Eye cosmetics demonstrate the strongest growth trajectory at 6.73% CAGR through 2030, benefiting from social media's visual culture and the technical challenge of formulating natural products for sensitive eye areas. The segment's growth reflects consumer willingness to pay premium prices for products that combine aesthetic enhancement with skin nourishment, particularly in anti-aging and protective formulations. Lip and nail makeup cosmetics face formulation constraints due to natural ingredient limitations in achieving vibrant colors and long-lasting wear, requiring innovation in plant-based pigments and natural binding agents.
Health-conscious buyers are increasingly avoiding synthetic ingredients, opting instead for makeup formulated with plant-based pigments and clean-label botanicals that are gentle on the skin, especially for sensitive areas like the eyes and face. Advances in formulation technology have also made natural color cosmetics more competitive, offering high-performance features like long wear, vibrant pigmentation, and skin-nourishing benefits. Natural Deep Eutectic Solvents (NaDES) technology enhances the stability and efficacy of natural formulations, enabling manufacturers to develop products that match conventional cosmetics' performance while maintaining natural credentials. This technological advancement addresses the primary barrier to natural cosmetics adoption - the perception that natural products compromise performance for environmental benefits.


By Gender: Male Segment Accelerates Despite Female Dominance
The male segment's 7.45% CAGR through 2030 contrasts sharply with female consumers' 90.67% market share in 2024, indicating untapped growth potential in men's natural grooming products. This expansion reflects changing masculinity concepts and economic shifts that normalize male beauty product usage. Younger generations, particularly Gen Z and Millennials, are embracing cosmetics as a form of self-expression and confidence, leading to greater acceptance and usage of products like foundations, concealers, tinted moisturizers, eyebrow fillers, and bronzers designed specifically for men or positioned as gender-neutral. The growth of K-beauty trends and the normalization of beauty routines for men by influencers and digital campaigns have helped destigmatize makeup use, further accelerating demand.
Makeup is increasingly about enhancing features or showcasing personality, not just concealing imperfections. Women use everything from bold eyeliners to natural “no-makeup” looks as part of their daily routine, reflecting confidence, creativity, and personal identity. Social trends—like seasonal “clean girl” aesthetics or festival-inspired looks—fuel adoption and experimentation. There is strong demand for color cosmetics that serve a broad spectrum of skin tones, ages, and personal preferences. Female consumers are increasingly conscious of ingredient safety and ethical standards. Products that are vegan, cruelty-free, and free from harmful chemicals are in high demand, especially among Gen Z and Millennial women. Clean labels, sustainability in sourcing, and eco-friendly packaging—such as recyclable or refillable solutions—are significant purchase motivators.
By Price Point: Premium Growth Signals Quality Premiumization
Premium segment growth at 7.11% CAGR through 2030 outpaces mass market products despite representing only 31.21% of 2024 market share, indicating consumer willingness to pay for perceived quality and authenticity. This trend reflects the natural cosmetics market's evolution from alternative positioning to luxury category, where organic certification and sustainable sourcing justify price premiums. Mass market products maintain 68.79% share in 2024 through accessibility and broad distribution, but face margin pressure from ingredient costs and certification requirements that premium brands can better absorb. The premiumization trend creates opportunities for mid-tier brands to position products as accessible luxury while maintaining natural credentials.
The price point segmentation reveals geographic variations in purchasing power and value perception, with developed markets showing higher premium segment penetration while emerging markets prioritize accessibility. L'Oréal's EUR 43.48 billion sales in 2024 demonstrate how established players leverage premium positioning to maintain growth despite market maturity. The company's Green Sciences initiative exemplifies how premium brands integrate sustainability with performance, creating products that justify higher prices through environmental and efficacy benefits. This strategy enables market expansion while maintaining profitability in an increasingly competitive landscape.
By Distribution Channel: Online Growth Challenges Specialty Store Expertise
Specialty stores maintain 46.54% market share in 2024 through product expertise and trial experiences that online channels cannot replicate, particularly for natural cosmetics where ingredient education drives purchase decisions. Online retail channels are projected to grow at a 6.87% CAGR through 2030, reflecting convenience and broader product access, with Asian markets such as China and Korea exhibiting high e-commerce penetration. The channel divergence creates strategic challenges for brands balancing digital growth with specialty retail relationships that provide credibility and consumer education. Ulta Beauty's expansion plan of 200 new stores over three years from 2025 onwards demonstrates continued investment in physical retail despite digital growth trends.
Supermarkets/hypermarkets, pharmacies/drug stores, and other distribution channels compete for the remaining market share through convenience and impulse purchasing opportunities. The distribution landscape reflects consumer shopping behavior variations across regions, with developed markets showing omnichannel preferences while emerging markets rely heavily on traditional retail formats. Natural cosmetics brands must navigate these channel preferences while maintaining consistent brand messaging and product quality across different retail environments. The challenge intensifies for smaller brands lacking resources to support multiple distribution strategies simultaneously.
Geography Analysis
Asia-Pacific's 33.21% market share in 2024 and 7.83% CAGR through 2030 position the region as both the largest and fastest-growing market for natural cosmetics. China's domestic brands dominate local markets while exploring foreign acquisitions to accelerate growth, with companies like Skintific expanding into Southeast Asian markets. The region's growth stems from rapid urbanization, rising disposable incomes, and increasing awareness of ingredient safety, particularly among younger consumers who prioritize natural products. India's regulatory framework under the Cosmetics Rule 2020 emphasizes Good Manufacturing Practices and ingredient transparency, creating opportunities for certified natural cosmetics while challenging non-compliant products. Japan and South Korea lead innovation in natural formulations and packaging technologies, influencing global trends through their advanced beauty industries.
Europe represents the second-largest market with established regulatory frameworks that favor natural cosmetics through strict ingredient controls and animal testing prohibitions. The EU's Cosmetics Regulation (EC) No. 1223/2009 bans over 1,400 chemicals compared to fewer than 20 in the USA, creating competitive advantages for natural formulations that avoid prohibited substances. Germany, France, and Italy lead European consumption, with strong consumer preference for organic certification and sustainable packaging. The European Chemicals Agency's 2024 findings that 6.4% of inspected cosmetics contained hazardous chemicals highlight regulatory gaps that natural cosmetics can exploit for market positioning.
North America shows steady growth driven by consumer health consciousness and regulatory modernization through the Modernization of Cosmetics Regulation Act of 2022 (MoCRA). The USDA's National Organic Program provides certification pathways for cosmetics containing agricultural ingredients, though the FDA's lack of formal definitions for 'natural' creates market confusion that established brands exploit. Canada's regulatory alignment with US standards facilitates cross-border trade while Mexico's growing middle class creates expansion opportunities for natural cosmetics brands. The region's mature market characteristics require innovation and premiumization strategies to maintain growth, with consumers willing to pay premium prices for products that demonstrate clear environmental and health benefits.

Competitive Landscape
The natural cosmetics market exhibits moderate fragmentation, creating opportunities for both consolidation by established players and niche positioning by emerging brands. Major multinational corporations like Chanel Limited, Estée Lauder Inc., L’Oréal, LVMH Moët Hennessy Louis Vuitton SE, and AS MADARA Cosmetics leverage their distribution networks and R&D capabilities to acquire natural brands and develop organic product lines, while smaller companies differentiate through specialized formulations and authentic brand narratives.
The competitive intensity reflects the market's transition from a niche wellness category to a mainstream beauty segment, where traditional cosmetics companies compete with dedicated natural brands for consumer attention and retail shelf space. Moreover, opportunities exist in male grooming products, sensitive skin solutions, and emerging market penetration, where regulatory barriers and distribution challenges favor companies with global capabilities.
Technology adoption drives competitive differentiation, with companies investing in AI-driven personalization, biotechnology formulations, and sustainable packaging solutions to capture market share. Estée Lauder's partnership with Exuud demonstrates how established players integrate breakthrough technologies like SoliqaireTM for smart fragrance delivery, combining innovation with sustainability to maintain competitive advantages. The competitive landscape rewards brands that successfully balance natural positioning with performance delivery, as consumer expectations for efficacy continue to rise alongside environmental consciousness.
Natural Cosmetics Industry Leaders
-
LVMH Moët Hennessy Louis Vuitton SE
-
L'Oreal S.A
-
AS MADARA Cosmetics
-
Inika Organic
-
Weleda AG
- *Disclaimer: Major Players sorted in no particular order

Recent Industry Developments
- October 2024: L'Oréal partnered with Abolis Biotechnologies and Evonik to develop and manufacture new innovative and sustainable biotech-based ingredients. These ingredients were created from renewable sources rather than synthetically engineered from pollution-heavy processes. The ingredients made from this agreement are to be used in beauty and skincare products, and beyond.
- June 2024: Polite Society expanded its product offering with a new setting powder and eyeshadow palette. The formula included vegan hyaluronic acid to soothe the skin and nasturtium flower extract to aid in reactivating the skin oxygenation system. The powders came in three shades, Universal Translucent, Brightening Petal, and Brightening Peach. V.I.P Very Important Palette was a nine-neutral shade palette offering matte and shiny shades. The formula was 100% vegan and was free from talc, parabens, and mineral oil.
- October 2023: Color cosmetics brand CMYK Cosmetics launched a line of seven "limitless natural" vegan lipsticks – all in fall colors and packaged in 2023's trendiest color per Pantone: Viva Magenta. CMYK's shades—Cameo, Incognito, Pom Pom, Clairet, Rosewood, Scarlet and Wineberry— delivered long-lasting pigment in what the brand called a "clean, creamy, plush formula" that complemented all skin tones.
- January 2023: Estée Lauder launched its new Pure Color Lipstick line. Formulated with a Moisture Lock Complex and naturally derived ingredients, these lipsticks were the brand's most conditioning and long-wearing products at the time. The collection was available in 55 shades from nude to berry with matte, crème, and lustre finishes, and these Estée Lauder lipsticks were designed to flatter all skin tones.


Global Natural Cosmetics Market Report Scope
| Facial Cosmetics |
| Eye Cosmetics |
| Lip and Nail Make-up Cosmetics |
| Female |
| Male |
| Mass |
| Premium |
| Supermarkets/Hypermarkets |
| Pharmacies/Drug Stores |
| Specialty Stores |
| Online Retail Stores |
| Other Distribution Channel |
| North America | United States |
| Canada | |
| Mexico | |
| Rest of North America | |
| Europe | Germany |
| United Kingdom | |
| Italy | |
| France | |
| Spain | |
| Netherlands | |
| Poland | |
| Belgium | |
| Sweden | |
| Rest of Europe | |
| Asia-Pacific | China |
| India | |
| Japan | |
| Australia | |
| Indonesia | |
| South Korea | |
| Thailand | |
| Singapore | |
| Rest of Asia-Pacific | |
| Middle East and Africa | South Africa |
| Saudi Arabia | |
| United Arab Emirates | |
| Nigeria | |
| Egypt | |
| Morocco | |
| Turkey | |
| Rest of Middle East and Africa | |
| South America | Brazil |
| Argentina | |
| Colombia | |
| Chile | |
| Peru | |
| Rest of South America |
| By Product Type | Facial Cosmetics | |
| Eye Cosmetics | ||
| Lip and Nail Make-up Cosmetics | ||
| By Gender | Female | |
| Male | ||
| By Price Point | Mass | |
| Premium | ||
| By Distribution Channel | Supermarkets/Hypermarkets | |
| Pharmacies/Drug Stores | ||
| Specialty Stores | ||
| Online Retail Stores | ||
| Other Distribution Channel | ||
| By Geography | North America | United States |
| Canada | ||
| Mexico | ||
| Rest of North America | ||
| Europe | Germany | |
| United Kingdom | ||
| Italy | ||
| France | ||
| Spain | ||
| Netherlands | ||
| Poland | ||
| Belgium | ||
| Sweden | ||
| Rest of Europe | ||
| Asia-Pacific | China | |
| India | ||
| Japan | ||
| Australia | ||
| Indonesia | ||
| South Korea | ||
| Thailand | ||
| Singapore | ||
| Rest of Asia-Pacific | ||
| Middle East and Africa | South Africa | |
| Saudi Arabia | ||
| United Arab Emirates | ||
| Nigeria | ||
| Egypt | ||
| Morocco | ||
| Turkey | ||
| Rest of Middle East and Africa | ||
| South America | Brazil | |
| Argentina | ||
| Colombia | ||
| Chile | ||
| Peru | ||
| Rest of South America | ||


Key Questions Answered in the Report
What is the projected value of the natural cosmetics market by 2030?
The natural cosmetics market is forecast to reach USD 32.49 billion by 2030, expanding at a 6.35% CAGR between 2025 and 2030.
Which region leads growth in the natural cosmetics market?
Asia-Pacific leads with a 33.21% revenue share in 2024 and is projected to grow at 7.83% CAGR through 2030.
Which product segment shows the fastest growth?
Eye cosmetics are forecast to expand at a 6.73% CAGR through 2030, outpacing other product categories.
Why are premium natural cosmetics growing faster than mass segments?
Consumers view certification, sustainable sourcing, and biotech innovation as value drivers, supporting higher price points and a 7.11% CAGR for premium lines.
Page last updated on:


