Online Cosmetics Market Size and Share
Market Overview
| Study Period | 2021 - 2031 |
|---|---|
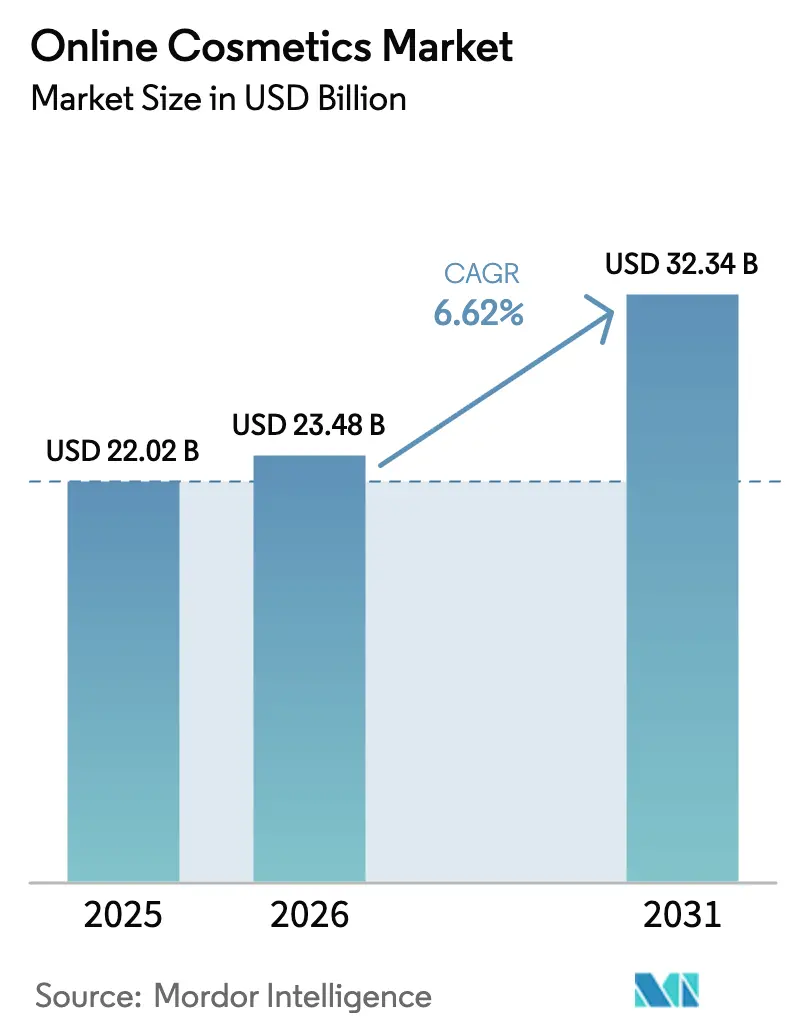
| Market Size (2026) | USD 23.48 Billion |
| Market Size (2031) | USD 32.34 Billion |
| Growth Rate (2026 - 2031) | 6.62% CAGR |
| Fastest Growing Market | Asia-Pacific |
| Largest Market | North America |
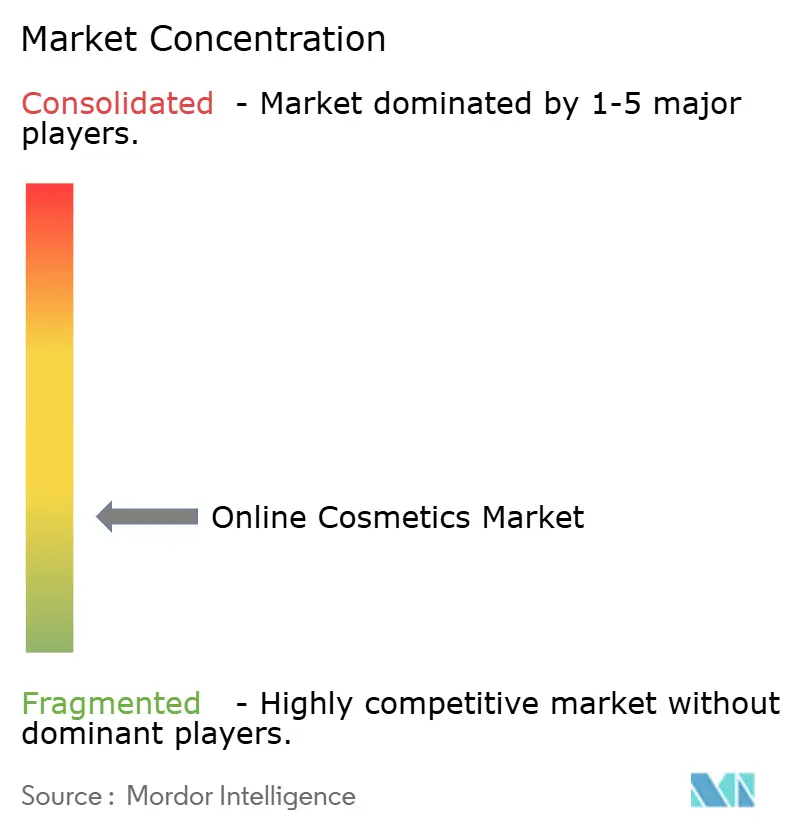
| Market Concentration | Low |
Major Players
*Disclaimer: Major Players sorted in no particular order Image © Mordor Intelligence. Reuse requires attribution under CC BY 4.0. |
|
Online Cosmetics Market Analysis by Mordor Intelligence
The Online Cosmetics market size is expected to grow from USD 22.02 billion in 2025 to USD 23.48 billion in 2026 and is forecast to reach USD 32.34 billion by 2031 at 6.62% CAGR over 2026-2031. This digital-first beauty ecosystem represents a fundamental shift from traditional retail models, driven by technological convergence and evolving consumer expectations that prioritize convenience, personalization, and authentic brand engagement. The market's resilience stems from its ability to adapt rapidly to regulatory changes, with the FDA's Modernization of Cosmetics Regulation Act of 2022 creating new compliance frameworks that favor digitally native brands capable of implementing robust traceability and safety reporting systems [1]Source: U.S Food & Drug Administration, "Registration and Listing of Cosmetic Product Facilities and Products", fda.gov. Rapid gains stem from livestream selling, AI-powered personalization, and growing demand for clean formulations that elevate perceived value and justify premium prices. Strong platform loyalty, robust traceability systems introduced under the Modernization of Cosmetics Regulation Act, and short replenishment cycles for core categories further strengthen the online cosmetics market’s resilience. Competitive dynamics remain fluid because technology partnerships lower entry barriers and enable niche brands to reach scale quickly. Finally, regional growth differentials—especially the outsized contribution from Asia-Pacific e-commerce ecosystems—underscore why companies prioritize localized strategies rather than one-size-fits-all global rollouts.
Key Report Takeaways
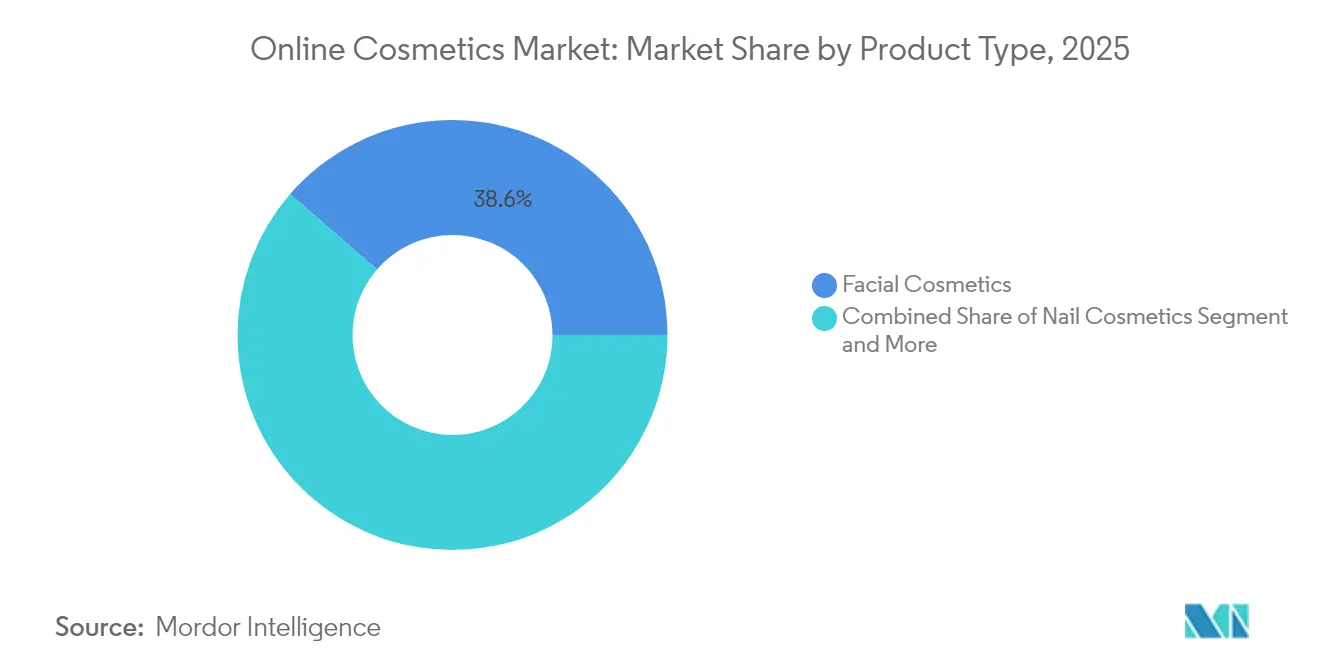
- By product type, facial cosmetics held 38.62% of online cosmetics market share in 2025, while nail cosmetics advanced at a 7.03% CAGR through 2031.
- By category, conventional items accounted for 71.45% of the online cosmetics market size in 2025; organic products are forecast to expand at an 8.19% CAGR through 2031.
- By price range, mass products represented 61.72% of revenue in 2025, whereas premium lines will post a 7.12% CAGR by 2031.
- By distribution channel, third-party retailer platforms captured 94.85% of sales in 2025, yet company-owned platforms are on track for an 8.02% CAGR to 2031.
- By geography, Asia-Pacific commanded 36.85% of spend in 2025 and is also the fastest-growing region at a 6.94% CAGR through 2031.
Note: Market size and forecast figures in this report are generated using Mordor Intelligence’s proprietary estimation framework, updated with the latest available data and insights as of 2026.
Global Online Cosmetics Market Trends and Insights
Drivers Impact Analysis*
| Driver | (~) % Impact on CAGR Forecast | Geographic Relevance | Impact Timeline |
|---|---|---|---|
| Personalization and Virtual Try-Ons | +1.8% | Global, with Asia-Pacific and North America leading adoption | Medium term (2-4 years) |
| Expansion of Premium and Luxury Brands Online | +1.5% | North America & Europe core, expanding to Asia-Pacific | Long term (≥ 4 years) |
| Convenience and Timesaving | +1.2% | Global, particularly urban markets | Short term (≤ 2 years) |
| Innovative Marketing and E-commerce Strategies | +1.0% | Global, with social commerce emphasis in Asia-Pacific | Medium term (2-4 years) |
| Social Media Influence | +0.9% | Global, Gen Z demographic focus | Short term (≤ 2 years) |
| Demand for Organic and Natural Products | +0.6% | North America & Europe primarily | Long term (≥ 4 years) |
| Source: Mordor Intelligence | |||
Personalization and Virtual Try-Ons
Advanced AI-powered personalization technologies are reshaping customer acquisition and retention strategies, with virtual try-on applications demonstrating measurable conversion improvements that justify significant technology investments. L'Oréal's Makeup Genius app has generated over 20 million downloads, while partnership case studies show conversion rates nearly doubling when consumers engage with AI-powered skincare advisors. The technology's impact extends beyond customer experience to supply chain optimization, enabling brands to predict demand patterns and reduce inventory risks through personalized product recommendations. Regulatory compliance frameworks under FDA's cosmetics modernization requirements favor companies with robust data collection capabilities, as personalization engines generate the traceability data needed for adverse event reporting and safety substantiation. The convergence of AI personalization with regulatory requirements creates competitive advantages for digitally native brands while challenging traditional players to accelerate their technology adoption timelines.
Expansion of Premium and Luxury Brands Online
Premium beauty brands are abandoning previous digital hesitancy as online channels prove capable of delivering the high-touch experiences previously exclusive to physical retail environments. Estée Lauder's expansion into Amazon Premium Beauty stores represents a strategic shift toward marketplace partnerships that maintain brand prestige while accessing broader customer bases. The premium segment's 7.37% CAGR outpaces mass market growth, driven by consumers' willingness to pay higher prices for authentic brand experiences and exclusive product access. Digital luxury positioning requires sophisticated content strategies and influencer partnerships, with brands investing heavily in virtual boutique experiences and limited-edition online exclusives. This premiumization trend creates margin expansion opportunities for established players while raising barriers to entry for new competitors lacking brand heritage and digital sophistication.
Convenience and Timesaving
Consumer time scarcity drives demand for streamlined purchasing experiences that eliminate traditional beauty shopping friction points such as product testing, shade matching, and inventory availability. The shift toward convenience-first shopping behaviors accelerated during 2024, with subscription models and auto-replenishment services gaining traction among time-pressed consumers seeking predictable beauty routines. Mobile commerce optimization becomes critical as consumers increasingly purchase cosmetics during micro-moments throughout their daily schedules rather than dedicated shopping sessions. Same-day delivery and click-and-collect services are evolving from premium offerings to baseline expectations, forcing brands to invest in logistics capabilities or partner with specialized fulfillment providers. The convenience imperative also drives consolidation in product portfolios, with multi-functional products gaining preference over single-use items that complicate purchasing decisions.
Demand for Organic and Natural Products
Consumer awareness of ingredient safety and environmental impact drives premium pricing acceptance for organic and natural formulations, despite supply chain complexities that challenge traditional cosmetics manufacturing. The organic segment's 8.62% CAGR reflects willingness to pay higher prices for products perceived as safer and more sustainable, though regulatory definitions remain inconsistent across markets. USDA organic certification requirements for agricultural ingredients in cosmetics create compliance advantages for brands with established natural product expertise [2]Source: U.S. Department of Agriculture, "Cosmetics, Body Care, and Personal Care Products", ams.usda.gov. The trend toward clean beauty formulations intersects with personalization demands, as consumers seek natural products tailored to their specific skin concerns and sensitivities. Brands investing in sustainable packaging and ethical sourcing practices gain competitive advantages in markets where environmental consciousness influences purchasing decisions, particularly among younger demographics willing to research ingredient lists and company practices.
Restraints Impact Analysis*
| Restraint | (~) % Impact on CAGR Forecast | Geographic Relevance | Impact Timeline |
|---|---|---|---|
| Increasing Market Penetration of Counterfeit Products | -1.2% | Global, with concentration in developing markets | Short term (≤ 2 years) |
| Consumer Awareness of Chemical Ingredients in Products Restricts Growth | -0.8% | North America & Europe primarily | Medium term (2-4 years) |
| Impact of Strict Regulations on New Product Development | -0.6% | Global, with varying regional intensity | Long term (≥ 4 years) |
| Premium Pricing of Organic and Natural Products | -0.4% | Global, affecting mass market penetration | Medium term (2-4 years) |
| Source: Mordor Intelligence | |||
Increasing Market Penetration of Counterfeit Products
Counterfeit cosmetics proliferation threatens brand integrity and consumer safety, with fake products often containing dangerous substances including lead, beryllium, and harmful bacteria that pose serious health risks [3]Source: New York State Department of State, "Fake Cosmetics and their Health Risks", dos.ny.gov. The problem intensifies in online marketplaces where product authentication becomes challenging, particularly for premium brands whose higher margins make counterfeiting financially attractive. E-commerce platforms struggle to implement effective screening mechanisms, as sophisticated counterfeiters replicate packaging and product appearance while selling through unauthorized channels at significant discounts. The issue disproportionately affects developing markets where price sensitivity makes consumers more susceptible to deeply discounted fake products, potentially damaging brand reputation and customer trust. Brands are investing in blockchain-based authentication systems and working with platforms to improve seller verification, but the global nature of online commerce makes comprehensive enforcement difficult.
Consumer Awareness of Chemical Ingredients in Products Restricts Growth
Heightened ingredient scrutiny creates formulation constraints that limit product innovation while increasing development costs and time-to-market for new products. Social media amplifies concerns about specific ingredients, often without scientific context, leading to widespread avoidance of safe and effective formulations based on misinformation rather than regulatory guidance. The trend toward "clean" beauty creates marketing challenges for brands using synthetic ingredients that may be safer and more effective than natural alternatives, requiring extensive consumer education investments. Ingredient transparency demands conflict with intellectual property protection needs, as brands must balance disclosure requirements with competitive advantage preservation. The phenomenon particularly affects color cosmetics and long-wearing formulations that rely on synthetic ingredients for performance characteristics that consumers expect but may not associate with chemical complexity.
*Our forecasts treat driver/restraint impacts as directional, not additive. The impact forecasts reflect baseline growth, mix effects, and variable interactions.
Segment Analysis
By Product Type: Facial Cosmetics Lead Innovation
Facial cosmetics command 38.62% market share in 2025, reflecting their central role in daily beauty routines and the category's adaptability to digital shopping experiences through virtual try-on technologies and AI-powered shade matching. The segment benefits from frequent repurchase cycles and seasonal product launches that drive consistent revenue streams, while foundation and concealer subcategories leverage advanced formulation technologies that appeal to quality-conscious consumers. BB and CC creams gain traction as multifunctional products that align with convenience trends, offering skincare benefits alongside coverage that resonates with time-pressed consumers seeking simplified routines. Eye cosmetics maintain steady demand through social media-driven makeup tutorials, with kohl and kajal products particularly strong in Asian markets where cultural preferences drive consistent usage patterns.
Nail cosmetics emerge as the fastest-growing segment at 7.03% CAGR through 2031, driven by nail art trends popularized on social media platforms and the category's accessibility for experimentation without permanent commitment. The segment benefits from lower price points that encourage frequent purchases and color experimentation, while gel and long-lasting formulations meet consumer demands for durability and professional appearance. Lip cosmetics face intensifying competition from multifunctional products but maintain relevance through innovative textures and hybrid formulations that combine color with skincare benefits. The product type segmentation reflects broader industry trends toward personalization and multifunctionality, with successful brands investing in technology platforms that help consumers navigate extensive product ranges and find optimal matches for their specific needs and preferences.


By Category: Organic Segment Accelerates
Conventional products maintain 71.45% market share in 2025, demonstrating the continued dominance of traditional formulations that offer proven performance and accessible pricing for mass market consumers. The conventional segment benefits from established supply chains and manufacturing efficiencies that enable competitive pricing while meeting diverse consumer needs across multiple demographics and income levels. However, organic products surge ahead with 8.19% CAGR, reflecting consumer willingness to pay premium prices for products perceived as safer and more environmentally responsible. The organic segment's growth trajectory indicates a fundamental shift in consumer values, particularly among younger demographics who prioritize ingredient transparency and sustainability over price considerations.
USDA organic certification requirements create both opportunities and challenges for brands, as compliance with agricultural ingredient standards enables premium positioning while adding complexity to sourcing and manufacturing processes. The category distinction increasingly influences product development strategies, with conventional brands incorporating natural ingredients to appeal to health-conscious consumers while organic specialists focus on expanding product ranges and improving performance characteristics. The growth differential between categories suggests a gradual market evolution toward cleaner formulations, though conventional products will likely maintain majority share due to price sensitivity and performance requirements in specific product categories.
By Price Range: Premium Growth Outpaces Mass
Mass market products dominate with 61.72% market share in 2025, reflecting price sensitivity and the accessibility requirements for broad consumer adoption across diverse economic segments. The mass segment benefits from economies of scale and established distribution relationships that enable competitive pricing while maintaining acceptable quality standards for everyday use. Premium products demonstrate faster growth at 7.12% CAGR, indicating consumer willingness to invest in higher-quality formulations and brand experiences that justify elevated price points. The premium segment's expansion reflects broader consumer trends toward quality over quantity, with buyers increasingly viewing cosmetics as long-term investments rather than disposable commodities.
The price range segmentation reveals market polarization, with mid-tier products facing pressure from both affordable alternatives and premium offerings that provide superior performance or brand prestige. Premium brands leverage digital channels to communicate value propositions through detailed ingredient information, sustainability credentials, and exclusive access to limited-edition products that create emotional connections with consumers. The growth differential suggests opportunities for brands that can successfully position products at premium price points while delivering demonstrable benefits that justify higher costs. This trend particularly benefits established luxury brands expanding online presence and emerging premium specialists that can compete on innovation and brand authenticity rather than price alone.

By Distribution Channel: Platform Concentration Dominates
Third-party retailer platforms command 94.85% market share in 2025, demonstrating the overwhelming dominance of established e-commerce marketplaces and multi-brand beauty retailers in online cosmetics distribution. This concentration reflects consumer preferences for one-stop shopping experiences that offer product comparison, reviews, and convenient checkout processes across multiple brands and categories. The platform dominance also indicates the challenges individual brands face in driving direct traffic to proprietary websites without the discovery advantages and trust signals provided by established marketplaces. Major platforms benefit from sophisticated recommendation algorithms and customer data that enable personalized product suggestions and targeted marketing campaigns that individual brands struggle to replicate independently.
Company-owned platforms grow fastest at 8.02% CAGR through 2031, signaling brand recognition of the strategic importance of direct-to-consumer relationships and higher margin opportunities available through proprietary channels. The growth trajectory reflects successful brand investments in digital infrastructure, customer acquisition strategies, and exclusive product offerings that incentivize consumers to purchase directly rather than through third-party platforms. Direct-to-consumer success requires significant marketing investments and operational capabilities, favoring larger brands with resources to compete against platform advantages while smaller brands may struggle to achieve sufficient scale. The channel dynamics suggest a gradual rebalancing toward more direct brand relationships, though third-party platforms will likely maintain majority share due to consumer convenience preferences and discovery advantages.
Geography Analysis
North America commands 36.10% market share in 2025 while growing at a moderate pace, reflecting market maturity and the region's early adoption of e-commerce beauty shopping that created established consumer behaviors and competitive dynamics. The United States drives regional performance through sophisticated digital infrastructure and high consumer spending power that supports frequent beauty purchases and premium product adoption. Canada contributes steady growth through cross-border e-commerce facilitation and consumer preferences that align closely with U.S. trends, while Mexico represents an emerging opportunity as digital payment systems and logistics networks improve access to online beauty products. The region's growth trajectory reflects saturation in traditional categories offset by premiumization trends and the expansion of specialized segments like clean beauty and personalized products that command higher margins.
Asia-Pacific emerges as the fastest-growing region at 6.94% CAGR through 2031, driven by China's digital commerce leadership where beauty e-commerce penetration exceeds 40% and livestreaming commerce creates immediate purchase decisions through real-time product demonstrations. India represents significant untapped potential with digital beauty sales currently at 10% but rapidly expanding as mobile commerce infrastructure improves and disposable incomes rise among urban consumers. Japan maintains strong market presence, indicating opportunities for brands that can bridge digital and physical experiences through omnichannel strategies. South Korea leads innovation in K-beauty trends and digital marketing approaches that influence global beauty standards, while Southeast Asian markets benefit from increasing internet penetration and growing middle-class populations seeking quality beauty products.
Europe demonstrates steady growth supported by strong consumer preferences for organic and natural products that align with regional sustainability values and regulatory frameworks that favor clean beauty formulations. Germany and the United Kingdom lead regional e-commerce adoption with sophisticated logistics networks and consumer familiarity with online beauty shopping, while France maintains its position as a global beauty innovation center through luxury brand heritage and premium product development. The region's fragmented regulatory landscape creates complexity for online sellers but also opportunities for brands that can navigate compliance requirements across multiple markets while leveraging the European Union's digital single market initiatives. Smaller European markets benefit from cross-border e-commerce facilitation and shared cultural preferences that enable regional marketing strategies and distribution efficiencies.
Competitive Landscape
The online cosmetics market exhibits fragmented competition, creating opportunities for both established players and emerging disruptors to gain market share through technological differentiation and targeted consumer engagement strategies. This fragmentation reflects the low barriers to entry in digital channels, where direct-to-consumer brands can launch with minimal capital investment while leveraging social media marketing and third-party logistics providers to compete against established players.
Major brands pursue aggressive AI partnerships to maintain competitive advantages, with Estée Lauder collaborating with Microsoft on generative AI innovation labs and Ulta Beauty partnering with Haut.AI for personalized skin analysis that improves customer experience and conversion rates. The competitive dynamics favor companies with sophisticated data analytics capabilities and technology infrastructure that enable personalization at scale while maintaining operational efficiency across multiple digital touchpoints. Strategic consolidation accelerates through targeted acquisitions that combine traditional beauty expertise with digital-native capabilities, exemplified by L'Oréal's USD 1.7 billion acquisition of Galderma to expand into injectable aesthetics and Estée Lauder's completion of the DECIEM acquisition to strengthen direct-to-consumer capabilities.
Opportunities emerge in specialized segments like nail cosmetics and personalized beauty solutions where technological innovation can create sustainable competitive advantages and premium pricing power. Emerging disruptors leverage social media influence and authentic brand positioning to challenge established players, particularly in categories where performance differences are less pronounced and brand perception drives purchasing decisions. The competitive landscape evolution suggests continued fragmentation in the near term, with eventual consolidation around brands that successfully integrate technology capabilities with authentic consumer relationships and operational excellence in digital commerce execution.
Online Cosmetics Industry Leaders
-
LVMH Moet Hennessy Louis Vuitton
-
CHANEL
-
Estée Lauder Inc.
-
Revlon
-
L'Oréal S.A.
- *Disclaimer: Major Players sorted in no particular order

Recent Industry Developments
- September 2025: Rhode, the beauty brand founded by Hailey Rhode Bieber, launched at Sephora online and in all stores across the U.S. and Canada. Sephora carried Rhode's core product assortment, including its iconic Peptide Lip line, and "perfectly pigmented" blush.
- August 2025: La Beauté Louis Vuitton was finally revealed. La Beauté Louis Vuitton featured an extensive array of 55 LV Rouge lipsticks (a nod to the Roman numeral LV), 10 LV Baume tinted lip balms, and eight LV Ombres eyeshadows. La Beauté Louis Vuitton launched in the month of August, 2025 in 116 Louis Vuitton stores globally and online.
- June 2024: Beauty and skincare brand Lakmé joined forces with artificial intelligence and augmented reality beauty and fashion technology provider Perfect Corp to launch a personalised virtual makeover experience for its 'MultiSlayer Sticks'. Lakmé aimed to engage shoppers online with its new AI launch - Lakmé. Online shoppers could virtually try out Lakmé's MultiSlayer Sticks with the DefineU tool which scanned the individual's face to identify their unique face shape and recommended a makeup look for them based on their features.


Global Online Cosmetics Market Report Scope
As per the study scope, online cosmetics refer to different beauty-enhancing products, including facial cosmetics, eye cosmetics, and lip cosmetics, that are sold through company-owned websites and e-commerce websites.
The online cosmetics market is segmented by type, category, distribution channel, and geography. Based on type, the market is segmented into facial cosmetics, eye cosmetics, lip cosmetics, and nail cosmetics. By category, the market is segmented into mass and premium products. Based on distribution channels, the market is segmented into company and retail websites. It analyzes emerging and established economies worldwide, comprising North America, Europe, South America, Asia-Pacific, Middle-East, and Africa.
For each segment, the market sizing and forecasts have been done based on value (in USD million).
| Facial Cosmetics | Foundation |
| Compact and Pressed Powder | |
| Highlighter | |
| Blush | |
| Concealer | |
| Make-Up Remover | |
| BB and CC Creams | |
| Others | |
| Eye Cosmetics | Kohl and Kajal |
| Eyeliners | |
| Mascara | |
| Others | |
| Lip Cosmetics | Lipsticks |
| Lip Gloss | |
| Others | |
| Nail Cosmetics | Nail Polish |
| Nail Polish Remover |
| Conventional |
| Organic |
| Mass |
| Premium |
| Third-Party Retailer Platform |
| Company-Owned Platform |
| North America | United States |
| Canada | |
| Mexico | |
| Rest of North America | |
| Europe | Germany |
| United Kingdom | |
| Italy | |
| France | |
| Spain | |
| Netherlands | |
| Poland | |
| Belgium | |
| Sweden | |
| Rest of Europe | |
| Asia-Pacific | China |
| India | |
| Japan | |
| Australia | |
| Indonesia | |
| South Korea | |
| Thailand | |
| Singapore | |
| Rest of Asia-Pacific | |
| South America | Brazil |
| Argentina | |
| Colombia | |
| Chile | |
| Peru | |
| Rest of South America | |
| Middle East and Africa | South Africa |
| Saudi Arabia | |
| United Arab Emirates | |
| Nigeria | |
| Egypt | |
| Morocco | |
| Turkey | |
| Rest of Middle East and Africa |
| By Product Type | Facial Cosmetics | Foundation |
| Compact and Pressed Powder | ||
| Highlighter | ||
| Blush | ||
| Concealer | ||
| Make-Up Remover | ||
| BB and CC Creams | ||
| Others | ||
| Eye Cosmetics | Kohl and Kajal | |
| Eyeliners | ||
| Mascara | ||
| Others | ||
| Lip Cosmetics | Lipsticks | |
| Lip Gloss | ||
| Others | ||
| Nail Cosmetics | Nail Polish | |
| Nail Polish Remover | ||
| By Category | Conventional | |
| Organic | ||
| By Price Range | Mass | |
| Premium | ||
| By Distribution Channel | Third-Party Retailer Platform | |
| Company-Owned Platform | ||
| By Geography | North America | United States |
| Canada | ||
| Mexico | ||
| Rest of North America | ||
| Europe | Germany | |
| United Kingdom | ||
| Italy | ||
| France | ||
| Spain | ||
| Netherlands | ||
| Poland | ||
| Belgium | ||
| Sweden | ||
| Rest of Europe | ||
| Asia-Pacific | China | |
| India | ||
| Japan | ||
| Australia | ||
| Indonesia | ||
| South Korea | ||
| Thailand | ||
| Singapore | ||
| Rest of Asia-Pacific | ||
| South America | Brazil | |
| Argentina | ||
| Colombia | ||
| Chile | ||
| Peru | ||
| Rest of South America | ||
| Middle East and Africa | South Africa | |
| Saudi Arabia | ||
| United Arab Emirates | ||
| Nigeria | ||
| Egypt | ||
| Morocco | ||
| Turkey | ||
| Rest of Middle East and Africa | ||


Key Questions Answered in the Report
How big is the online cosmetics market in 2026?
It is valued at USD 23.48 billion in 2026 and is expected to grow at a 6.62% CAGR to 2031.
Which region grows fastest in online beauty sales?
Asia-Pacific posts the quickest ascent, expanding at a 6.94% CAGR on the back of livestream commerce and rising smartphone penetration.
What product segment leads digital sales?
Facial cosmetics hold the largest share at 38.62% thanks to AI shade matching and high replenishment frequency.
Which distribution channel delivers most orders?
Third-party retailer platforms dominate with 94.85% of sales, although brand-owned sites are the fastest-growing at 8.02% CAGR.
Page last updated on:


