Middle East & Africa Infrastructure Construction Market Size and Share
Market Overview
| Study Period | 2020 - 2031 |
|---|---|
| Forecast Data Period | 2026 - 2031 |
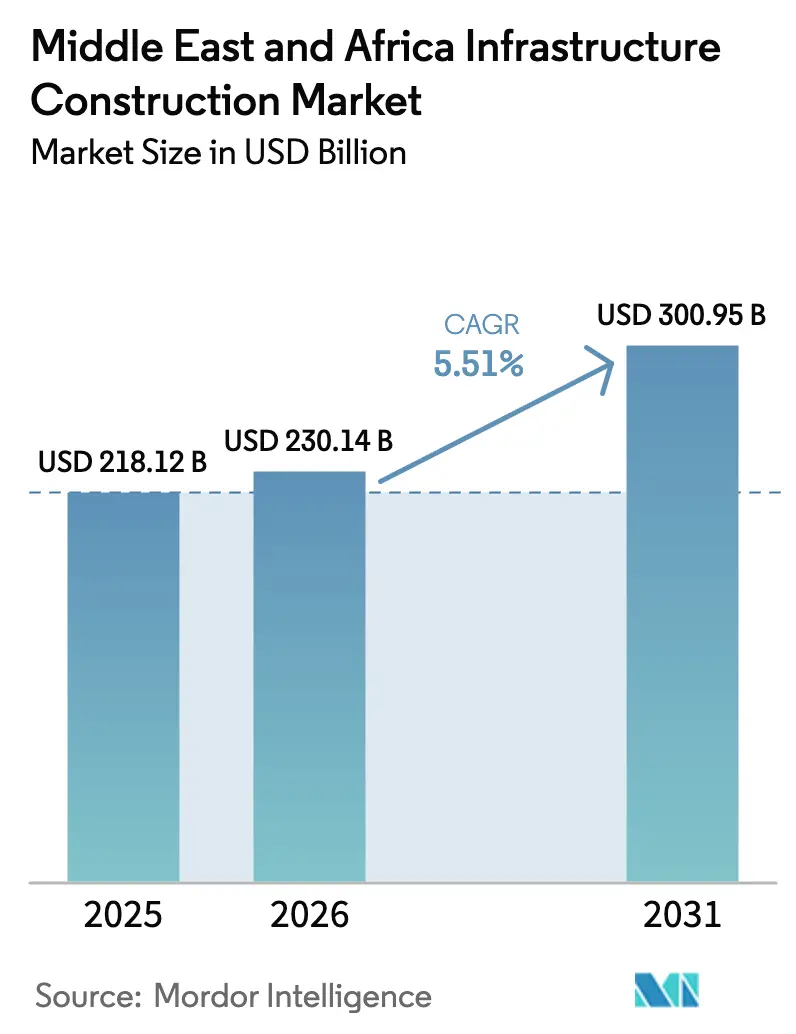
| Base Year Market Size (2025) | USD 218.12 Billion |
| Market Size (2026) | USD 230.14 Billion |
| Market Size (2031) | USD 300.95 Billion |
| Growth Rate (2026 - 2031) | 5.51% CAGR |
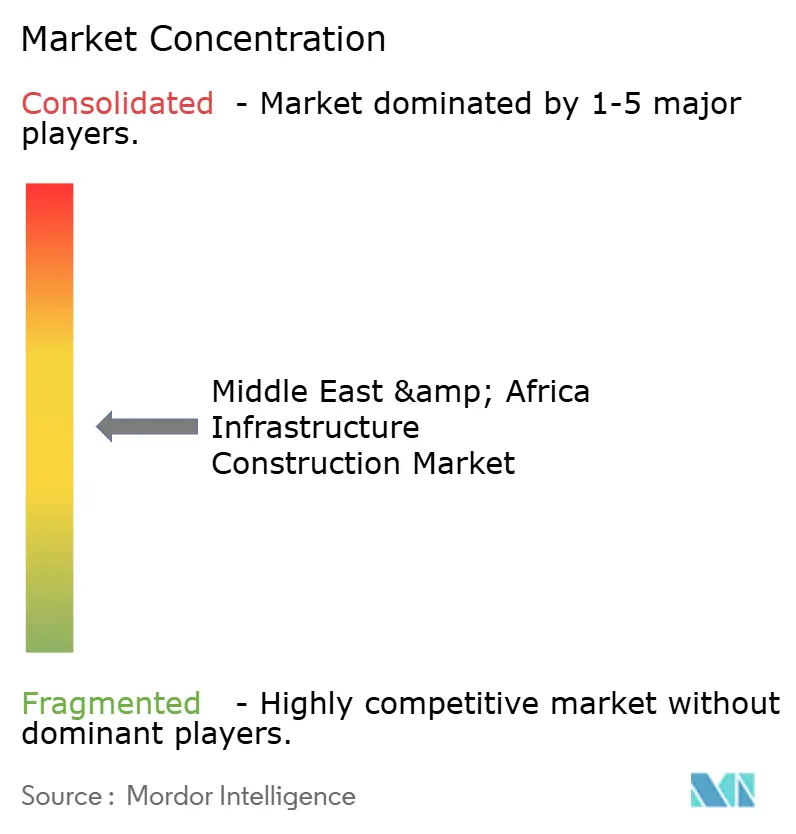
| Market Concentration | Medium |
Major Players *Disclaimer: Major Players sorted in no particular order Image © Mordor Intelligence. Reuse requires attribution under CC BY 4.0. | |
Middle East & Africa Infrastructure Construction Market Analysis by Mordor Intelligence
The Middle East & Africa Infrastructure Construction Market size is projected to expand from USD 218.12 billion in 2025 and USD 230.14 billion in 2026 to USD 300.95 billion by 2031, registering a CAGR of 5.51% between 2026 to 2031.
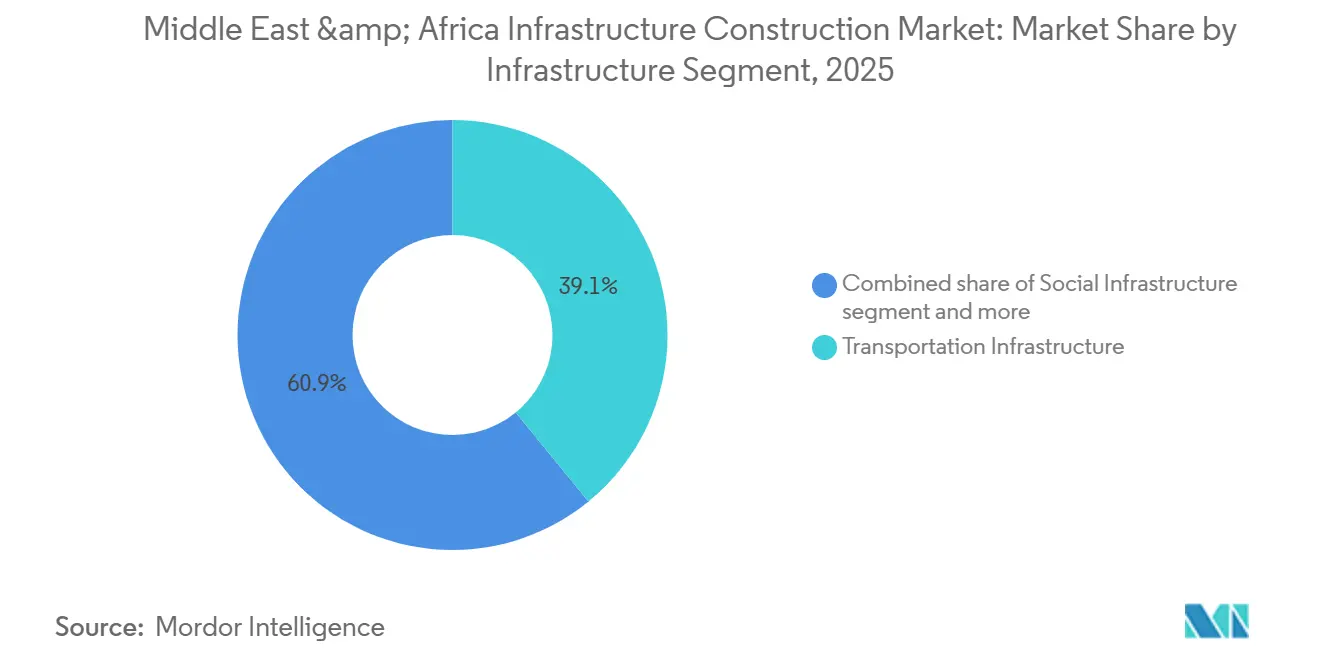
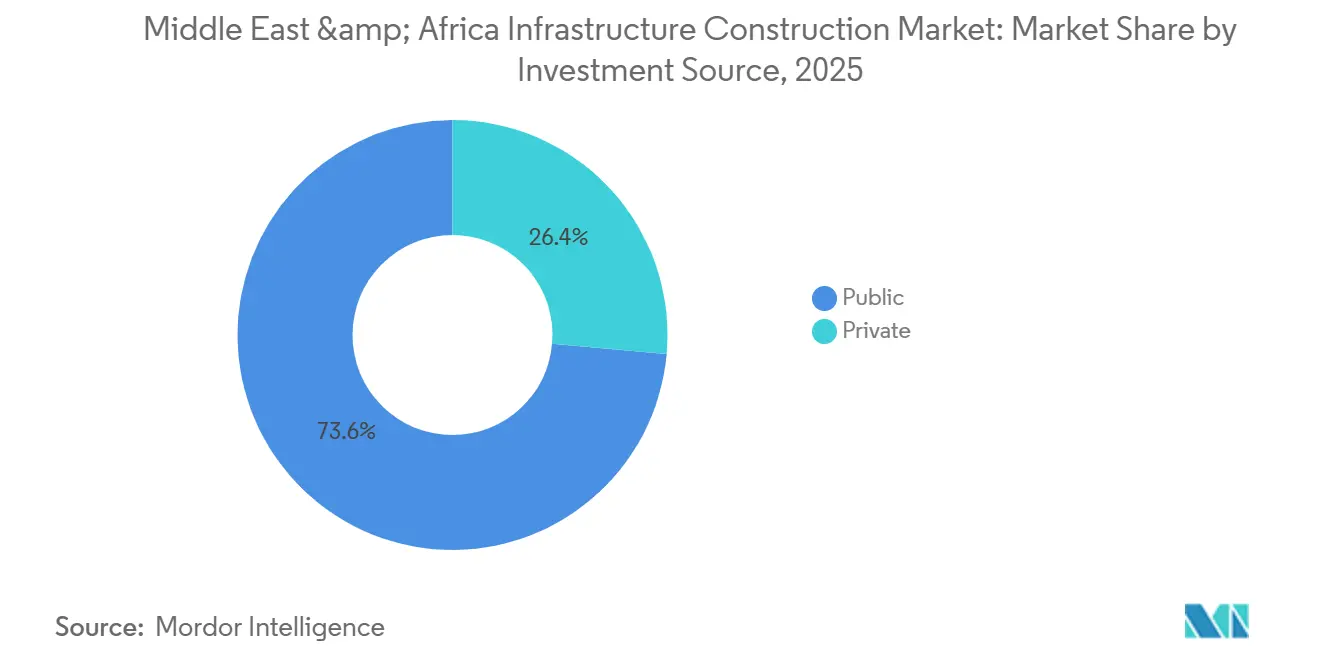
This performance shows how sovereign wealth funds, public-private partnerships, and energy-transition mandates are steadily replacing hydrocarbon-driven capital programs. Transportation infrastructure held a 39.1% revenue share in 2025, but utilities infrastructure is projected to record a 6.11% CAGR after 2026 as desalination and grid-strengthening projects accelerate. New construction commanded 79.3% of 2025 spending; nevertheless, renovation work is picking up on aging roads and water mains that approach end-of-life thresholds. Public budgets supplied 73.6% of funds in 2025, yet private investors are moving in as improved concession laws de-risk toll roads, airports, and desalination plants. Saudi Arabia led with 31.4% regional share, while Egypt is on track for a 6.31% CAGR through 2031 as its New Administrative Capital, Suez Canal upgrades, and ten-gigawatt renewables roll-out gather pace.
Key Report Takeaways
- By infrastructure segment, transportation captured a 39.1% Middle East & Africa infrastructure construction market share in 2025; utilities infrastructure is set to log a 6.11% CAGR to 2031.
- By construction type, new construction controlled 79.3% of 2025 spending, whereas renovation is the fastest-growing slice at a 5.97% CAGR between 2026 and 2031.
- By investment source, public outlays provided 73.6% of capital in 2025, but private funding is forecast to rise at a 5.88% CAGR as concession pipelines deepen.
- By City, Saudi Arabia commanded 31.4% of 2025 spending, yet Egypt shows the quickest expansion, with a 6.31% CAGR projected through 2031.
Note: Market size and forecast figures in this report are generated using Mordor Intelligence’s proprietary estimation framework, updated with the latest available data and insights as of 2026.
Worldwide, activity is shaped by contributions from multiple regions, with Middle east and africa representing one of the more structurally developed among them. The global report on infrastructure construction market by Mordor Intelligence reflects how these regional layers combine into a single system.
Middle East & Africa Infrastructure Construction Market Trends and Insights
Drivers Impact Analysis*
| Drivers | (~) % IMPACT ON CAGR FORECAST | Geographic Relevance | Impact Timeline |
|---|---|---|---|
| Sovereign-backed megaproject pipelines expanding road, rail, airport, and urban infrastructure awards | +1.8% | Saudi Arabia, United Arab Emirates, Egypt | Long term (≥ 4 years) |
| Energy-transition build-out accelerating renewables, grid upgrades, and water-desalination investments | +1.5% | GCC core, Egypt, South Africa | Medium term (2-4 years) |
| Logistics-competitiveness priorities driving ports, corridors, and intermodal freight expansions | +0.9% | Saudi Arabia, UAE, Egypt, Nigeria | Medium term (2-4 years) |
| Rapid urban growth is lifting demand for metros, utilities networks, and social assets | +0.8% | Egypt, Nigeria, Saudi Arabia | Short term (≤ 2 years) |
| Public-private partnership frameworks are widening funding access and private participation | +0.7% | Nigeria, South Africa, Egypt | Long term (≥ 4 years) |
| Source: Mordor Intelligence | |||
Sovereign-Backed Megaproject Pipelines Expanding Road, Rail, Airport, and Urban Infrastructure Awards
Sovereign wealth funds channeled more than USD 150 billion into new awards during 2025, most visibly through Saudi Arabia’s Public Investment Fund commitments at NEOM[1]Public Investment Fund, “Annual Report 2025,” pif.gov.sa . Egypt’s New Administrative Capital alone consumed USD 800 million in water and sewer packages that year. In parallel, the United Arab Emirates’ Masdar allocated USD 6 billion to a solar-plus-battery portfolio to anchor its 2050 carbon-neutrality pledge[2]Masdar, “Utility-Scale Solar and BESS Portfolio Fact Sheet 2025,” masdar.ae. Because local-content rules now sit at roughly 40% in the Gulf, international contractors must create fabrication yards and skills academies before mobilization. Integrated program-management contracts, such as the Bechtel-Parsons mandate at King Salman International Airport, bundle schedule risk with performance incentives and increasingly favor firms wielding digital-twin and modular-construction toolkits.
Energy-Transition Build-Out Accelerating Renewables, Grid Upgrades, and Water-Desalination Investments
National climate commitments are shifting capital toward reverse-osmosis (RO) plants and high-voltage direct-current links that back up intermittent solar power. Saudi Arabia’s Water and Electricity Company awarded four RO plants, each sized at 600,000 m³/day, between 2024 and 2025. Egypt’s Nexus of Water, Food, and Energy program steers USD 10 billion into 10 gigawatts of wind and solar by 2030[3]Egypt Ministry of Electricity & Renewable Energy, “NWFE Renewable-Energy Plan,” moee.gov.eg. The United Arab Emirates’ 180-million-gallon-per-day Hassyan RO facility—a USD 920 million build-own-operate contract—will curb the city’s reliance on older multi-stage-flash desalination. South Africa, meanwhile, plans USD 24 billion in independent transmission projects to integrate renewables and cut load-shedding. Contractors with RO-membrane supply chains and HVDC experience have a head start as these programs favor proven balance-of-plant execution.
Logistics-Competitiveness Priorities Driving Ports, Corridors, and Intermodal-Freight Expansions
Seaborne trade competition is fueling berth deepening and terminal automation. King Abdullah Port in Saudi Arabia lifted throughput capacity to 2.5 million twenty-foot-equivalent units in 2025, and Egypt issued USD 800 million in dredging and crane-automation contracts for Ain Sokhna and Alexandria ports. Nigeria broke ground on the 700 km Lagos-Calabar Coastal Highway in 2024; the first 47 km phase alone is tagged at USD 1.9 billion. Rail extensions, notably the UAE’s Etihad Rail Phase 2, are cutting diesel-based road freight and shrinking carbon footprints. EPC firms armed with automated-terminal systems and rail-electrification know-how stand to capture the lion’s share of upcoming packages.
Rapid Urban Growth Lifting Demand for Metros, Utilities Networks, and Social Assets
Metro schemes are advancing as megacities densify. Riyadh’s six-line, 176-km network reached full service in 2025, and a January 2026 bid awarded Larsen & Toubro an 8.4-km Red Line extension. Cairo Metro’s Line 3 Phase 3 added six stations in 2025, and feasibility work for Lines 6 and 7 is underway with World Bank support. Lagos’ Blue Line carried 50,000 commuters daily by mid-2025 and now triggers the Red and planned Green lines. Water networks show equal urgency; Egypt swapped 1,200 km of cast-iron mains for HDPE pipe in 2025 to trim non-revenue water from 42% to 38%. Contractors holding tunnel-boring machines and trenchless-laying kits dominate awards where road closures are politically sensitive.
Restraints Impact Analysis*
| Restraints | (~) % IMPACT ON CAGR FORECAST | Geographic Relevance | Impact Timeline |
|---|---|---|---|
| Fiscal and foreign-exchange volatility is elevating funding risk and contractor cash-flow stress | -1.2% | Egypt, Nigeria | Short term (≤ 2 years) |
| Contractor capacity gaps and supply-chain constraints are raising costs and delaying schedules | -0.8% | GCC, wider MEA import-dependent states | Short term (≤ 2 years) |
| Permitting, land acquisition, and stakeholder approvals are prolonging pre-construction | -0.6% | Egypt, Ethiopia, Nigeria | Medium term (2-4 years) |
| Source: Mordor Intelligence | |||
Fiscal and Foreign-Exchange Volatility Elevating Funding Risk and Contractor Cash-Flow Stress
Steep currency swings are eroding fixed-price margins. Egypt’s pound lost 50% against the dollar after the IMF-mandated devaluation in 2025, inflating imported cement and steel costs for EPCs. Nigeria’s naira slid to NGN 1,500 per USD the same year, forcing ministries to defer road tenders and slash counterpart funding. South Africa’s rand instability also chilled investor appetite despite regulated-return concessions. Firms billing in local currency and layering in currency-swap hedges have protected cash flow better than dollar-denominated peers. Absent these tactics, delay claims and payment disputes mount quickly under tight public budgets.
Contractor Capacity Gaps and Supply-Chain Constraints Raising Costs and Delaying Schedules
Skilled labor shortages and long equipment lead times have pushed 2026 construction-input inflation to 4% in Saudi Arabia and 3% in the UAE. Steel rebar jumped 12% and cement 8% across Gulf markets. Delivery of large transformers or RO membranes can now exceed 18 months, locking builders into costly inventory buffers. To cope, NEOM’s USD 347 million robotics joint venture with Samsung C&T automates rebar tying, cutting person-hours by 80% and slashing direct costs by 40%. Yet only mega-projects can absorb that upfront spend, leaving mid-tier contractors exposed to liquidated-damages penalties.
*Our forecasts treat driver/restraint impacts as directional, not additive. The impact forecasts reflect baseline growth, mix effects, and variable interactions.
Segment Analysis
By Infrastructure Segment: Utilities Outpace Legacy Transport Spend
Utilities infrastructure represented the fastest-moving slice of the Middle East & Africa infrastructure construction market in 2025, while transportation still controlled 39.1% of revenue. Rabigh 4 and Shuaiba 3, two 600,000 m³/day Saudi desalination plants, entered service in early 2026 at a combined USD 1.5 billion. The utilities segment’s 6.11% CAGR is anchored by Egypt’s USD 10 billion NWFE renewables program and the UAE’s USD 920 million Hassyan RO project. In contrast, transportation adds capacity mainly through Saudi Arabia’s King Abdullah Port expansion and Nigeria’s USD 15 billion Lagos-Calabar Highway. The Middle East & Africa infrastructure construction market size attached to utilities is therefore expected to eclipse transportation additions beyond 2028 as power-grid interconnectors and water-reuse schemes multiply.
Technology adoption is sharpening competitive divides. Siemens’ digital twin at NEOM Port accelerated crane cycles 15%, underlining how data models can flatten cost curves in bulk-handling utility works. Firms versed in HVDC cabling, membrane procurement, and battery-energy-storage systems hold a two-to-three-year lead in bid scoring. By contrast, asphalt paving faces margin squeeze from climate policies nudging freight to rail; hence, road contractors are actively pivoting toward bridge refurbishment and toll-road life-cycle concessions.


By Construction Type: Renovation Gains as Networks Age
New construction held a dominant 79.3% Middle East & Africa infrastructure construction market share in 2025, yet renovation is rising at a 5.97% CAGR as pipes, pavements, and substations reach wear-out limits. Egypt upgraded 1,200 km of water mains in 2025, cutting non-revenue leakage by four percentage points. South Africa’s USD 4.2 billion port-rail overhaul package and Nigeria’s multicity pothole resurfacing—USD 2.8 billion—show how backlog reduction fuels renovation demand. Contractors with trenchless-laying methods win repeat orders because city agencies now fine lane-closure overruns hourly.
Lifecycle-cost modeling is also turning into a tender prerequisite. Utility clients refer to ISO 55000 asset-management standards when grading bids, raising the bar for predictive-maintenance capability. Khansaheb Group’s January 2026 purchase of ANABEEB’s pipe plant illustrates how EPCs are vertical-integrating to lock in HDPE supply for renovation jobs. As capital scarcity bites, greenfield megaprojects must clear higher hurdle rates, letting shorter-duration rehabilitation schemes secure a growing slice of annual capex.
By Investment Source: Private Capital Chases Concession Pipelines
Public budgets financed 73.6% of projects in 2025, but private funding is forecast to expand at a 5.88% CAGR. Saudi Arabia’s Private Sector Participation Law now makes competitive tender mandatory above USD 267 million, while Nigeria’s 2025 PPP Guidelines standardize risk matrices for roads and airports. South Africa’s transmission concessions drew USD 2.4 billion of equity in 2025 via 20-year, inflation-linked tariffs. Egypt, despite 18 listed PPPs worth USD 6 billion, still grapples with exchange-rate pass-through; therefore, dollar-hedged revenue schemes are price lower.
The Middle East & Africa infrastructure construction market size linked to concessions remains modest today, but could double by 2031 if tariff formulas stabilize. Sponsors with sovereign-credit wraps or multilateral guarantees crowd out pure equity bidders. Orascom Construction’s merger with OCI Global creates a USD 1 billion war chest aimed squarely at such deal flow, underscoring the value placed on integrated developer-EPC platforms.
Geography Analysis
Saudi Arabia captured a 31.4% Middle East & Africa infrastructure construction market share in 2025, solidifying its lead through NEOM’s scaled portfolio, the USD 7.2 billion King Salman International Airport upgrade, and USD 2.87 billion of desalination projects that came on line in early 2026. Labor shortages lifted construction-input prices 4% during 2026, prompting the Public Investment Fund to back a USD 347 million robotics venture with Samsung C&T that trims rebar-assembly time 80%. The program underscores how automation is becoming a hedge against skilled-worker scarcity in high-volume Gulf projects. Ongoing local-content rules near 40% keep international engineering, procurement, and construction firms partnering with domestic fabricators. As a result, large contractors holding fabrication yards and training centers secure repeat orders on airport, metro, and water packages.
Egypt is set to be the fastest-growing geography at a 6.31% CAGR through 2031, thanks to its New Administrative Capital utilities spine, Suez Canal port dredging, and a ten-gigawatt renewables rollout tied to the Nexus of Water, Food, and Energy program. The country attracted USD 800 million in 2025 water-and-wastewater contracts, switching 1,200 kilometers of cast-iron mains to high-density polyethylene pipe. Currency devaluation challenges persist, yet the International Monetary Fund supports conditions for large-scale infrastructure disbursements on steady project execution. These factors position Egypt to expand its slice of the Middle East & Africa infrastructure construction market size once macro-stability anchors investor confidence.
The United Arab Emirates maintains steady growth on Masdar’s USD 6 billion solar-plus-battery pipeline and the USD 920 million Hassyan reverse-osmosis desalination phase, both of which lower carbon intensity and water costs. Nigeria advances episodically as the USD 15 billion Lagos–Calabar Coastal Highway and metro extensions battle funding gaps caused by naira volatility. South Africa earmarked USD 58 billion over three years, yet environmental approvals averaging 12 months slow its USD 24 billion independent transmission plan. Secondary markets—Morocco, Algeria, and Kenya—jointly absorbed nearly one-fifth of 2025 spending with port, road, and power refurbishment programs, showing investors that diversification beyond the Gulf is underway. Together, these dynamics keep regional deal flow active even as cost inflation and permitting delays temper near-term award velocity.
Mordor Intelligence provides coverage of the infrastructure construction market across other key regional markets. Detailed country-level analysis extends to Saudi Arabia, China, Brazil, and Canada incorporating local coverage and market participation, as required.
Competitive Landscape
International EPC majors such as Bechtel, Vinci, Fluor, and BESIX vie with regional leaders Orascom Construction, Larsen & Toubro, and Consolidated Contractors Company for megaprojects exceeding USD 1 billion. Technology and local content are decisive: Bechtel-Parsons’ delivery-partner model at the USD 7.2 billion King Salman Airport transfers schedule risk but earns incentive fees for passenger-throughput milestones. Orascom’s 2026 merger with OCI Global combines development capital and lump-sum-turnkey muscle, while NEOM’s robotics tie-up with Samsung C&T showcases automation as a hedge against Gulf labor shortages.
Indian and Chinese contenders are gaining share on cost and financing. Larsen & Toubro’s January 2026 Riyadh Metro extension award proved that Gulf owners now trust Asian TBM expertise. Chinese state-owned builders mobilized on Nigeria’s Lagos-Calabar Highway, leveraging concessional funding to secure early works. European material suppliers are also bulking up: Sika’s 2025 buyout of Gulf Seal’s membranes and Master Builders Solutions’ pick-up of Arkaz Al Sharq’s chemical line widen product portfolios essential to Vision 2030 concrete demand.
Midsize local firms face consolidation pressure as imported steel and freight tariffs erode thin margins. Those that responded by acquiring fabrication yards—Khansaheb’s purchase of ANABEEB’s HDPE plant—now command better supply security. Without similar moves, smaller players risk liquidated-damages penalties and exclusion from high-profile tender lists.
Middle East & Africa Infrastructure Construction Industry Leaders
KEO International Consultants
Bechtel
Parsons International
Tiger Group
WorleyParsons (UAE)
- *Disclaimer: Major Players sorted in no particular order

Recent Industry Developments
- January 2026: Larsen & Toubro won the 8.4 km Riyadh Metro Red Line extension, validating Indian contractors’ GCC foothold.
- January 2026: Khansaheb Group acquired ANABEEB’s pipe plant to target Gulf water-main upgrades.
- January 2026: Orascom Construction and OCI Global announced a USD 1 billion-equivalent merger to form an Abu Dhabi-based platform.
- May 2025: Bechtel-Parsons secured a delivery-partner role for the USD 7.2 billion King Salman Airport overhaul.


Middle East & Africa Infrastructure Construction Market Report Scope
| Transportation Infrastructure |
| Utilities Infrastructure |
| Social Infrastructure |
| Extraction Infrastructure |
| New Construction |
| Renovation |
| Public |
| Private |
| Saudi Arabia |
| UAE |
| Nigeria |
| Egypt |
| South Africa |
| Rest of the Middle East and Africa |
| By Infrastructure Segment | Transportation Infrastructure |
| Utilities Infrastructure | |
| Social Infrastructure | |
| Extraction Infrastructure | |
| By Construction Type | New Construction |
| Renovation | |
| By Investment Source | Public |
| Private | |
| By City | Saudi Arabia |
| UAE | |
| Nigeria | |
| Egypt | |
| South Africa | |
| Rest of the Middle East and Africa |


Key Questions Answered in the Report
How large is the Middle East & Africa infrastructure construction market in 2026?
It stands at USD 230.14 billion in 2026 with a forecast to reach USD 300.95 billion by 2031.
Which infrastructure segment is growing the fastest?
Utilities infrastructure, supported by desalination plants and grid upgrades, is projected to post a 6.11% CAGR through 2031.
Why is private capital increasing its share of funding?
Updated PPP laws in Saudi Arabia, Nigeria, and South Africa clarify risk allocation and offer inflation-linked tariffs, making concessions more bankable.
Which country shows the strongest growth outlook?
Egypt leads with a 6.31% forecast CAGR on the back of its New Administrative Capital build-out and large renewable-energy pipeline.
What main risks threaten project delivery?
Currency volatility, lengthy permitting cycles, and skilled-labor shortages raise cost and schedule pressures for contractors.
How are contractors responding to labor constraints?
Large players invest in automation, such as NEOM’s robotics for rebar work, and integrate supply chains to secure key materials.
Page last updated on:


