
Technology, Media and Telecom
5th MayPricing Strategy for Semiconductor Components
3 Min Read
Micro Fulfillment Center Market is Segmented by Component (Hardware, Software, and Services), Fulfilment Model (Stand-Alone MFCs, Store-Integrated MFCs, and More), Picking Technology (Goods-To-Person Robotics, Shuttle-Based AS/RS, and More), End-User (Traditional Retailers and Distributors, E-Commerce Pure-Players, and More), and Geography (North America, South America, Europe, Asia-Pacific, and Middle East and Africa).
Market Overview
| Study Period | 2020 - 2031 |
|---|---|
| Market Size (2026) | USD 8.54 Billion |
| Market Size (2031) | USD 25.89 Billion |
| Growth Rate (2026 - 2031) | 24.84 % CAGR |
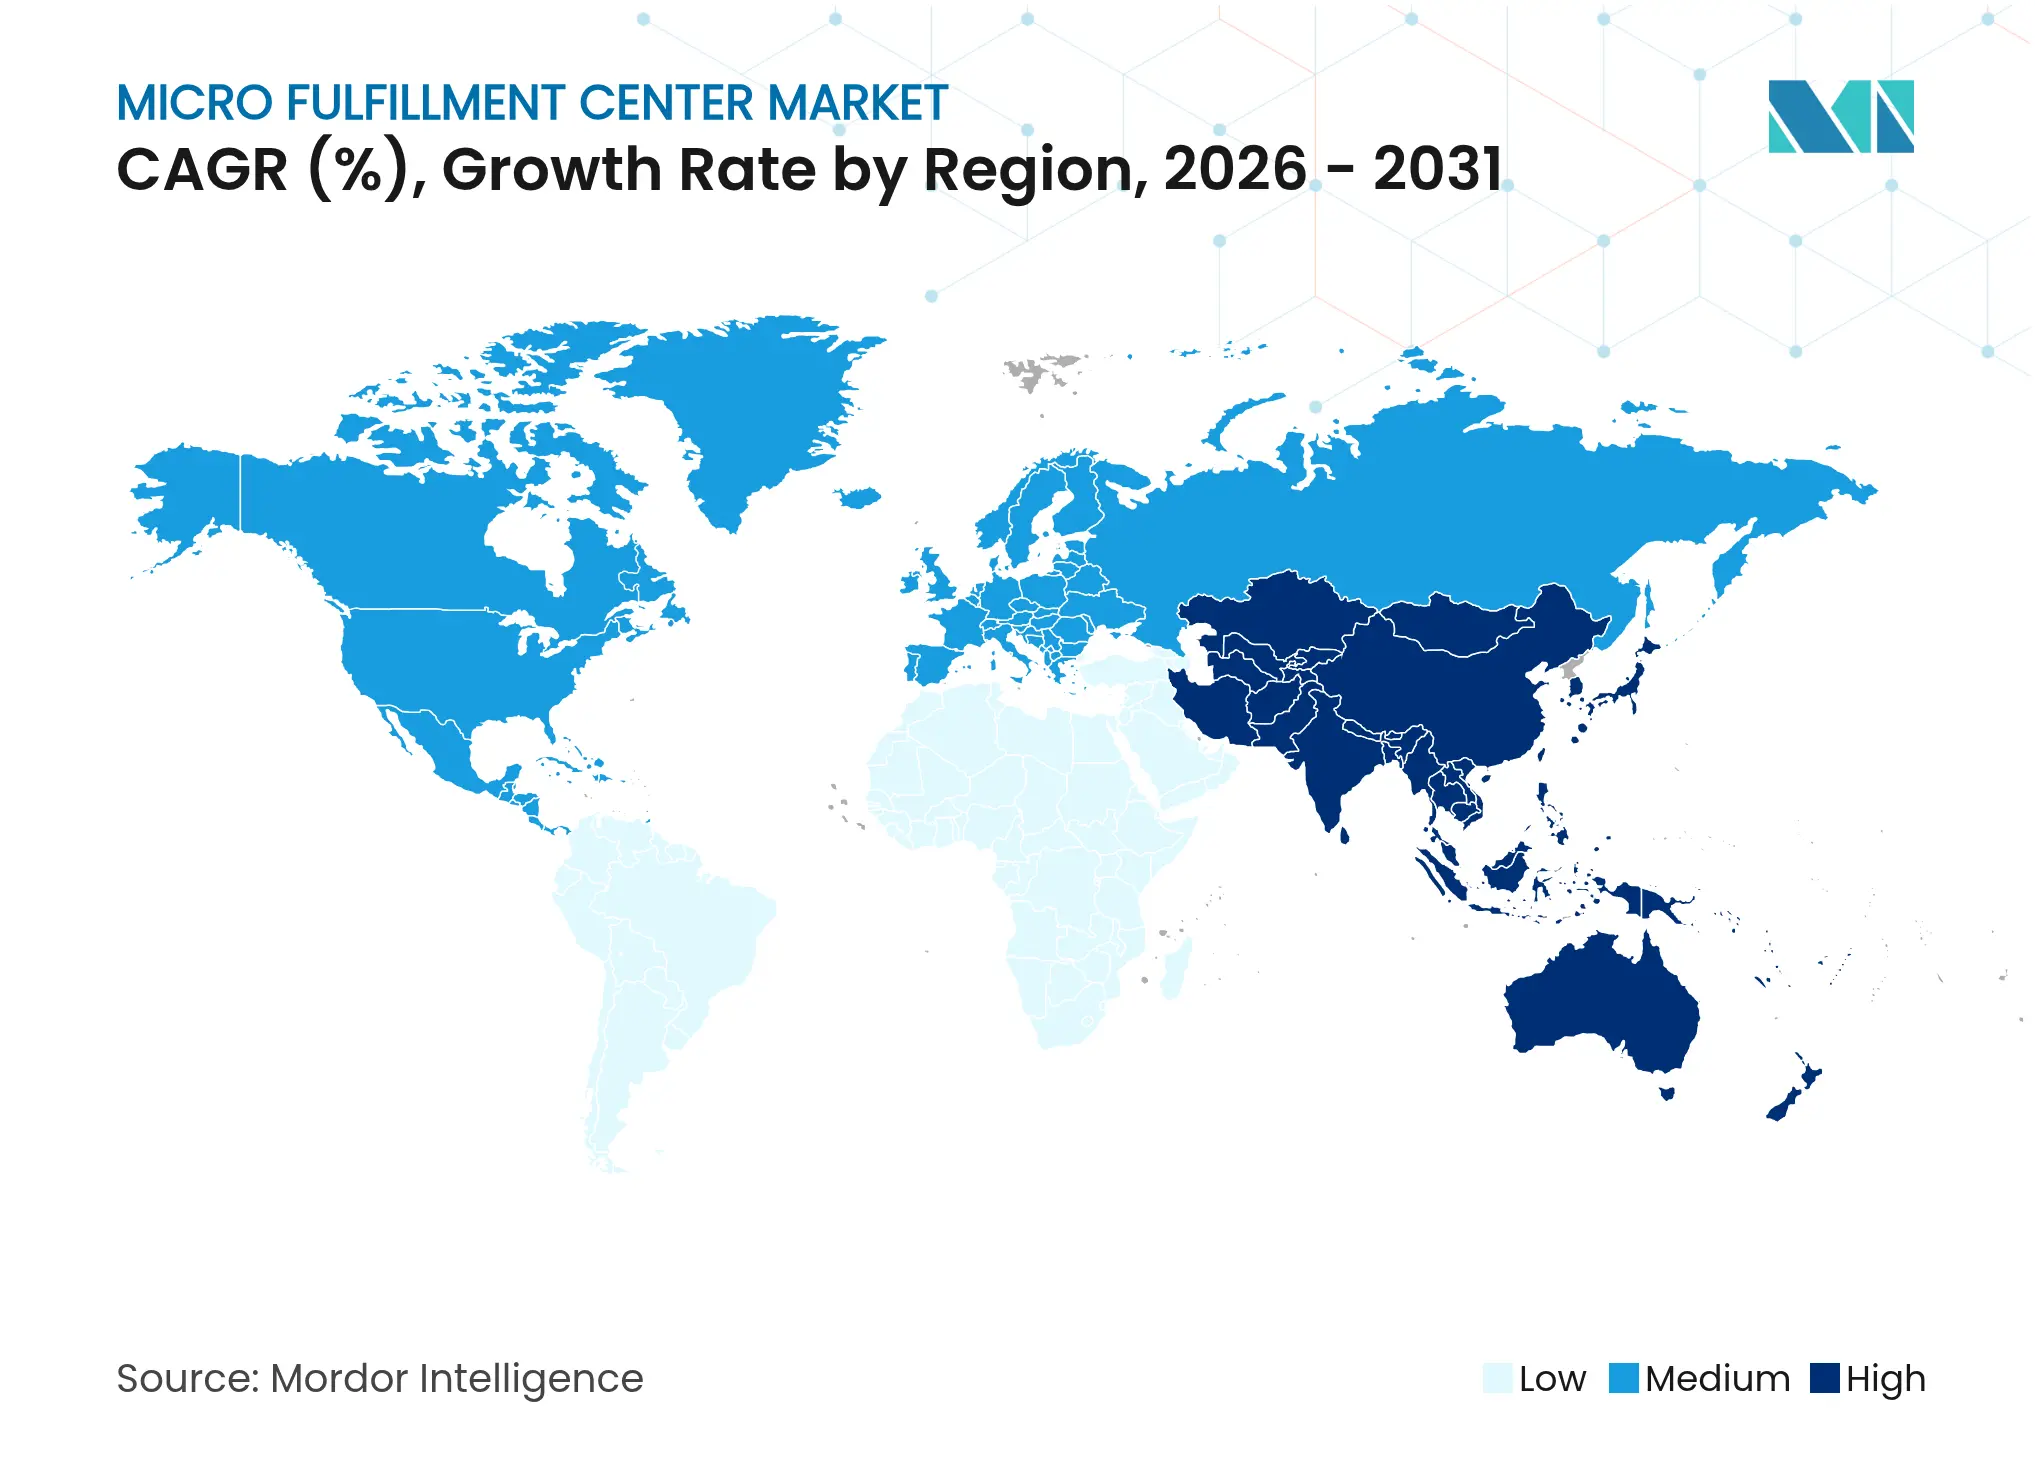
| Fastest Growing Market | Asia Pacific |
| Largest Market | North America |
| Market Concentration | Low |
Major Players *Disclaimer: Major Players sorted in no particular order. Image © Mordor Intelligence. Reuse requires attribution under CC BY 4.0. |
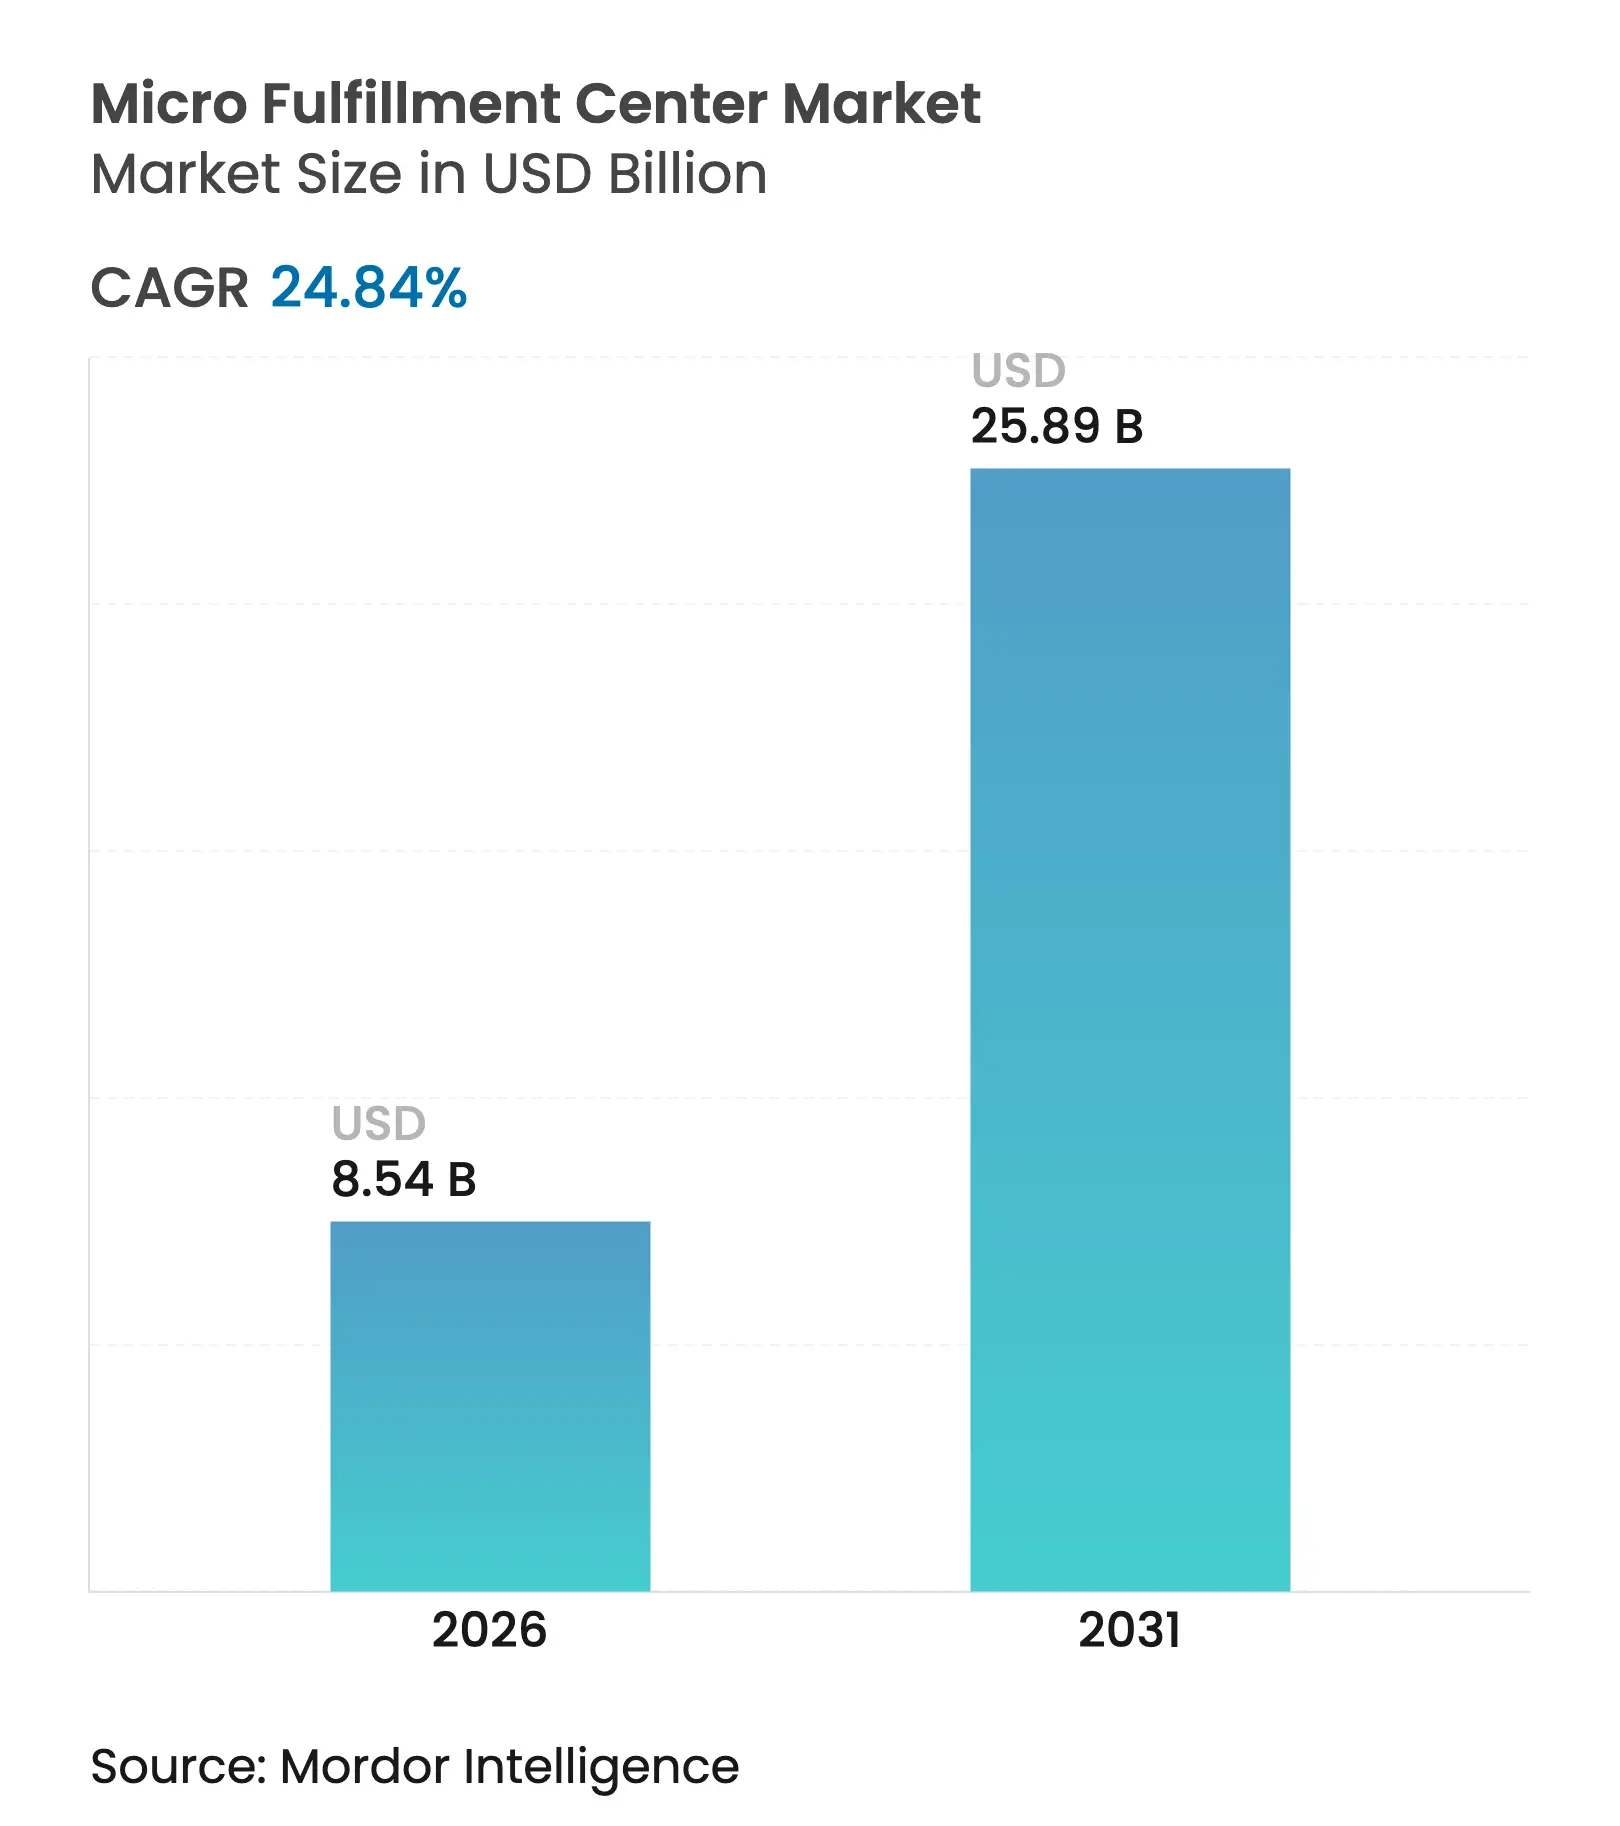
The micro-fulfillment centre market size was valued at USD 6.84 billion in 2025 and estimated to grow from USD 8.54 billion in 2026 to reach USD 25.89 billion by 2031, at a CAGR of 24.84% during the forecast period (2026-2031). Intensifying e-commerce activity, rising urban density, and the quest to control fulfillment labour costs accelerated investments in high-throughput, small-footprint facilities that shorten delivery lead times. Retailers anchored their network strategies on sites located within 3 miles of large customer clusters, striking a cost–service balance that conventional regional distribution centres could not match. Automation suppliers expanded modular offerings that allowed phased roll-outs, limiting cash-flow strain while supporting continuous technology upgrades. Meanwhile, regulatory momentum around fire codes for high-bay robotic systems and energy-efficiency mandates influenced equipment specifications and facility layouts across most new builds.
Key Report Takeaways
Note: Market size and forecast figures in this report are generated using Mordor Intelligence's proprietary estimation framework, updated with the latest available data and insights as of 2026.
Drivers Impact Analysis
| Driver | (~) % Impact on CAGR Forecast | Geographic Relevance | Impact Timeline | |||
|---|---|---|---|---|---|---|
E-grocery boom and shrinking delivery windows
E-grocery boom and shrinking delivery windows
| +8.2% | Global, focus on North America and Europe | Short term (≤ 2 years) |
(~) % Impact on CAGR Forecast
:
+8.2%
|
Geographic Relevance
:
Global, focus on North America and Europe
|
Impact Timeline
:
Short term (≤ 2 years)
|
Urbanisation and real estate proximity needs
Urbanisation and real estate proximity needs
| +6.1% | Asia-Pacific core, spill-over to MEA cities | Medium term (2-4 years) | |||
Labour scarcity is pushing warehouse automation
Labour scarcity is pushing warehouse automation
| +5.8% | North America and the EU developed APAC | Medium term (2-4 years) | |||
Retail-media data monetisation from MFCs
Retail-media data monetisation from MFCs
| +2.3% | Advanced North America and EU markets | Long term (≥ 4 years) | |||
Municipal tax incentives for brownfield sites
Municipal tax incentives for brownfield sites
| +1.9% | Primarily United States industrial corridors | Medium term (2-4 years) | |||
Micro-grid energy savings for 24/7 robotics
Micro-grid energy savings for 24/7 robotics
| +1.3% | Global, sustainability-driven regions | Long term (≥ 4 years) | |||
| Source: Mordor Intelligence | ||||||
E-grocery boom and shrinking delivery windows
Same-day grocery demand rose beyond pandemic levels and reached a 21% online penetration rate in 2025. Retailers deployed high-density storage and goods-to-person robotics in micro-fulfillment nodes embedded inside or adjacent to stores, cutting typical pick-pack cycles to under 10 minutes. Walmart’s plan for roughly 100 in-store automated modules illustrated how retailers compressed the last mile while leveraging existing real estate.[1]SCDigest Editorial Staff, “Walmart and Start Ups Chasing Delivery in Minutes,” SCDigest, scdigest.com Superior service levels reduced basket abandonment and increased fresh-food attachment rates, reinforcing capital allocation toward the micro-fulfillment centre market. Competitors without comparable speed risked revenue leakage, accelerating overall network redesign across grocery chains.
Urbanization and real estate proximity needs
Urban land prices in key Asian metros surpassed USD 50 per ft² annually in 2024, making legacy 300,000 ft² fulfillment centres unaffordable for dense city coverage. Operators instead targeted 5,000–25,000 ft² footprints that fit into mixed-use blocks and refurbished warehouses. City-logistics studies highlighted how smaller hubs lowered congestion by enabling foot and e-bike delivery from micro-fulfillment stockpiles. Yet, community pushback against traffic spikes around “dark stores” led to hybrid operating hours and curbside zoning rules. Retailers that balanced neighbourhood engagement with high throughput secured faster permitting, underscoring proximity planning as a strategic capability in the micro-fulfillment centre market.
Labour scarcity is pushing warehouse automation
Warehouse job vacancy rates in the United States stayed above 7% through 2024, while average hourly wages climbed 13% over two years. Operators justified autonomous picking, shuttle, and AMR investments that delivered 3–4× productivity gains and 99.99% accuracy. Automation also unlocked 24/7 operations, improving asset turns and aligning with shorter delivery windows. Declining robot costs narrowed payback periods below 24 months for many high-volume SKUs, driving broader adoption by mid-tier retailers and cementing automation as a non-negotiable lever in the micro-fulfillment centre market.
Retail-media data monetization from MFCs
Proximity-based micro-fulfillment nodes produced real-time sell-through data at neighbourhood granularity. Retailers packaged these insights into advertising products that commanded premiums from CPG brands looking for hyper-local targeting. Integrated analytics platforms mapped demand spikes to micro-promotion slots, creating a new revenue stream that boosted ROI on MFC deployments. Early adopters reported double-digit margin lift from retail-media programs, reinforcing the strategic logic for continual software upgrades and cross-functional data teams in the micro-fulfillment centre market.
Restraints Impact Analysis
| Restraint | (~) % Impact on CAGR Forecast | Geographic Relevance | Impact Timeline | |||
|---|---|---|---|---|---|---|
High
upfront CAPEX and ROI uncertainty
High
upfront CAPEX and ROI uncertainty
| -4.7% | Global, particularly acute in emerging markets | Short term (≤ 2 years) |
(~) %
Impact on CAGR Forecast
:
-4.7%
|
Geographic
Relevance
:
Global,
particularly acute in emerging markets
|
Impact
Timeline
:
Short
term (≤ 2 years)
|
Legacy
IT and ERP integration complexity
Legacy
IT and ERP integration complexity
| -3.2% | North America and the EU with established systems | Medium term (2-4 years) | |||
Local
zoning / fire-safety restrictions
Local
zoning / fire-safety restrictions
| -2.1% | Global, with stricter enforcement in the EU and developed APAC | Medium term (2-4 years) | |||
Cyber-physical
security vulnerabilities
Cyber-physical
security vulnerabilities
| -1.8% | Global, heightened in critical infrastructure regions | Long term (≥ 4 years) | |||
| Source: Mordor Intelligence | ||||||
High upfront CAPEX and ROI uncertainty
Installation budgets ranged between USD 2 million and USD 10 million per site, depending on throughput and automation density, with estimated 18–36 month payback windows for. Retailers faced the risk that shifting customer routines or rapid technology advances could extend breakeven timelines. Many mid-market chains opted for robotics-as-a-service plans that moved large portions of spending from capital budgets to operating expenses, yet even subscription models demanded long-term volume commitments. Financing hurdles were most pronounced in Latin America and Southeast Asia, where the cost of capital remained elevated and currency volatility undermined multi-year return forecasts, slowing uptake despite clear service-level benefits.
Legacy IT and ERP integration complexity
Retailers running 15-year-old warehouse management systems confronted API gaps and poor data refresh rates that impeded real-time inventory updates required by micro-fulfillment orchestration platforms. Middleware layers and custom connectors inflated deployment budgets and lengthened project timelines to as much as 24 months. Cyber-physical convergence also introduced new attack surfaces, triggering additional spending on penetration testing and network segmentation. The shortage of engineers versed in both legacy ERP stacks and modern robotics stretched internal IT departments, occasionally forcing phased rollouts that slowed the scale-up pace of the micro-fulfillment centre market.
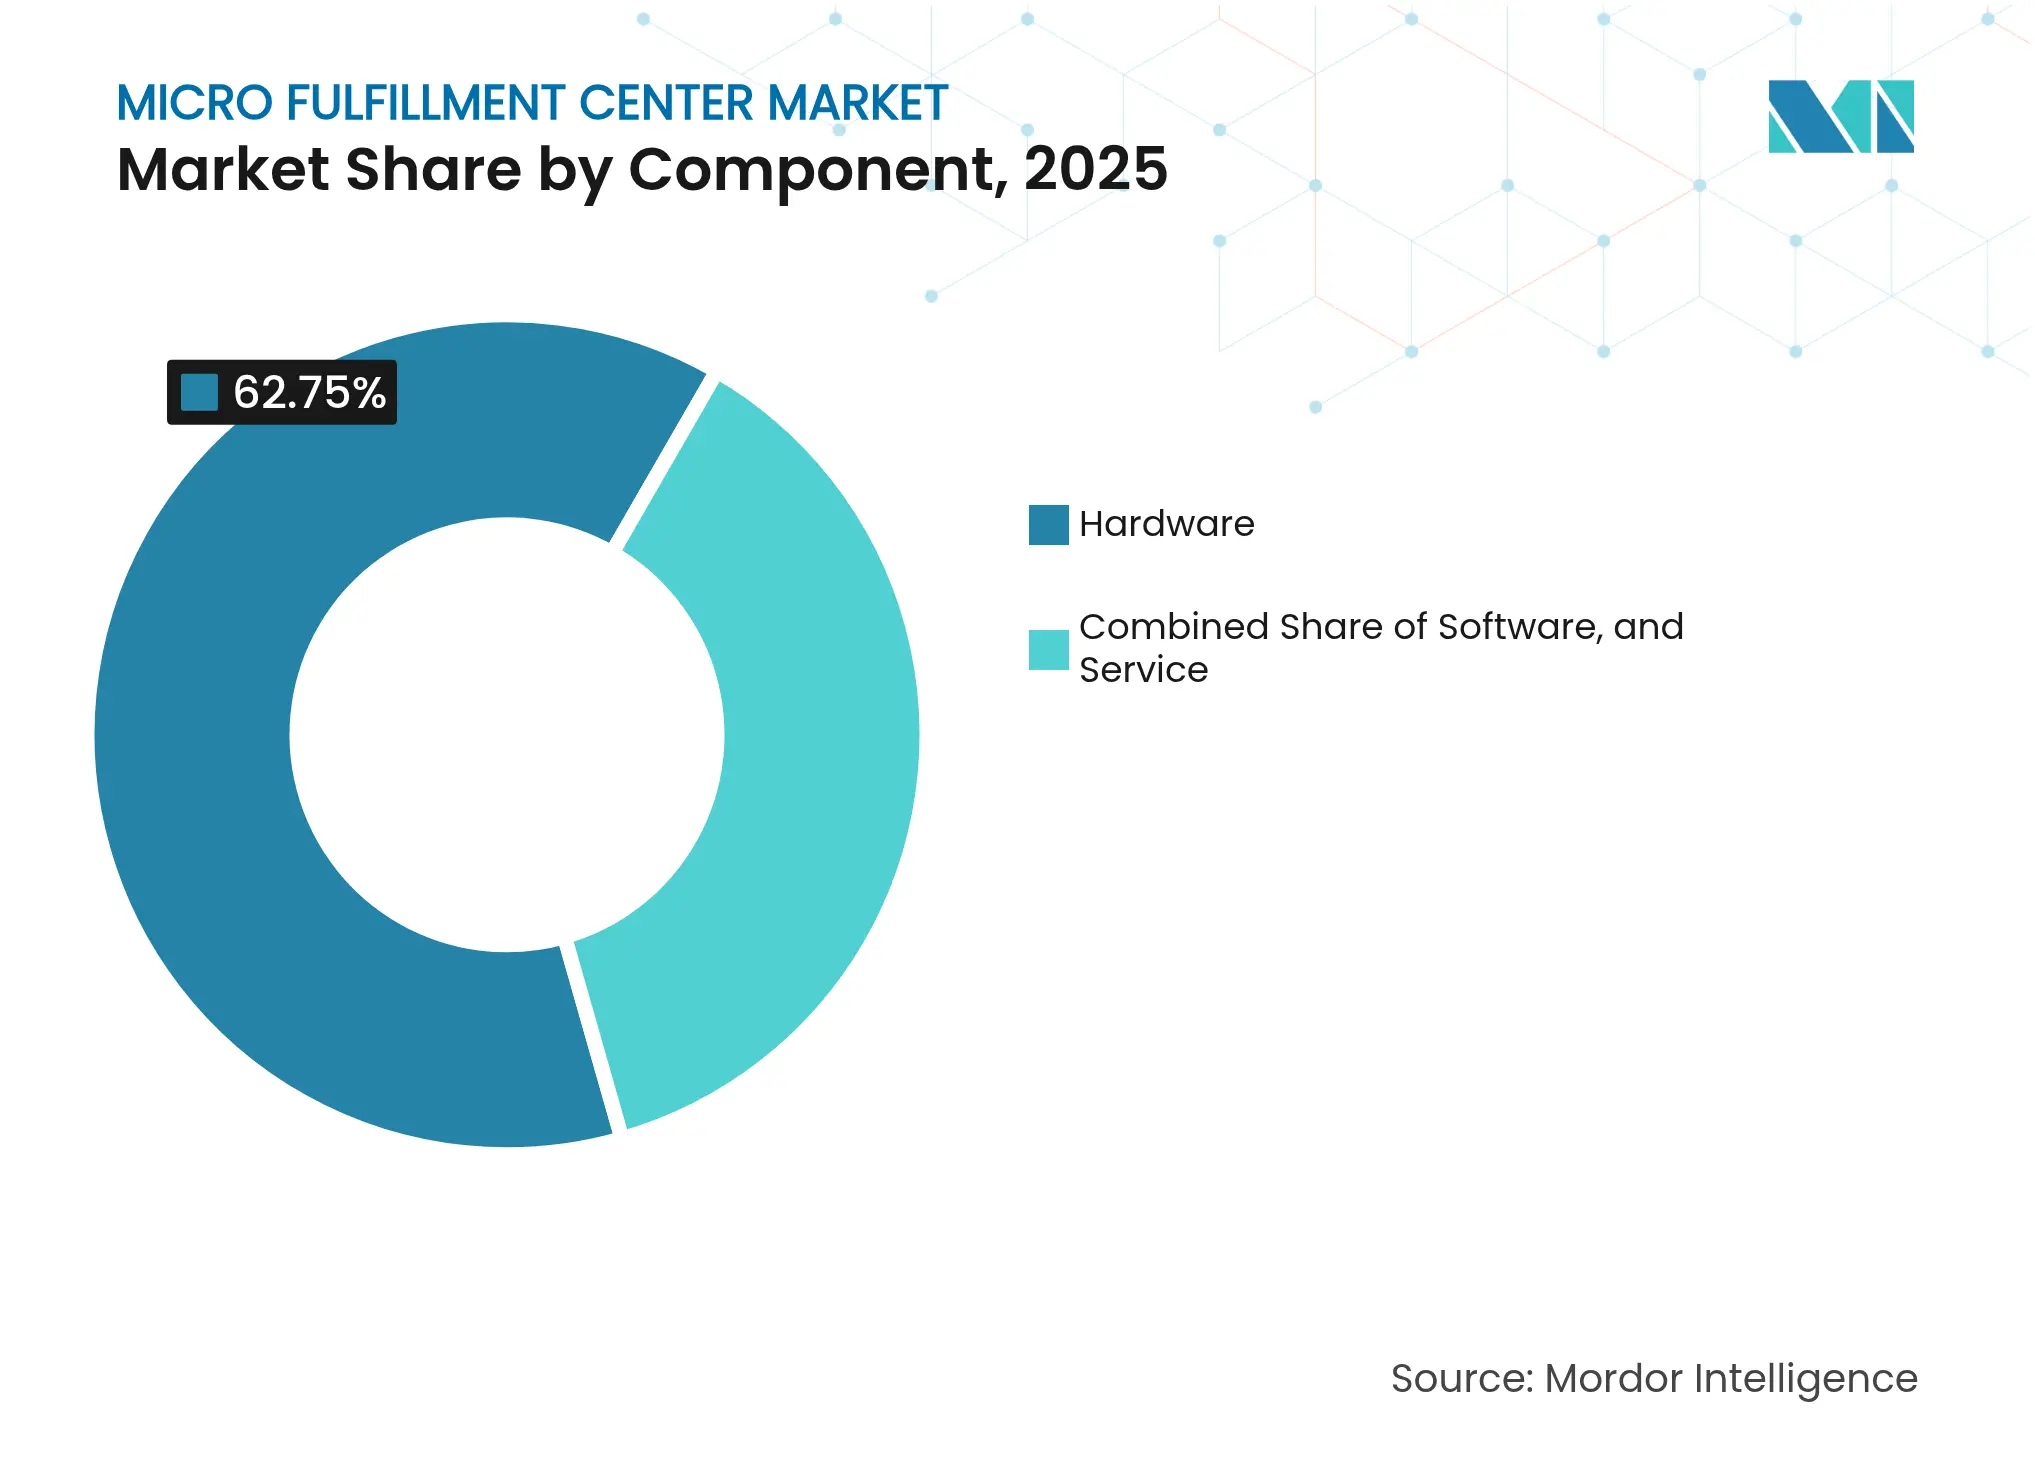
By Component: Hardware Dominance Meets Software Acceleration
Hardware commanded 62.75% revenue in 2025, reflecting the capital-intensive robotics, shuttle, and material-handling backbone essential for high-density storage in the micro-fulfillment centre market. Hardware spending peaked during initial buildouts when operators installed goods-to-person robots, conveyors, and lifts sized for projected five-year throughput. Software, though smaller in absolute value, expanded at a 32.6% CAGR, positioning orchestration, AI-based slotting, and predictive maintenance platforms as performance multipliers that squeezed hidden capacity from installed equipment. Services bridged both layers, covering integration, 24/7 remote monitoring, and continuous improvement programs that protected uptime.
The pivot to intelligence-driven optimization became evident when Kardex released FulfillX, a warehouse execution layer that cut roll-out timelines to six months via low-code configuration templates. Operators who upgraded to real-time digital twins reported 6–8% throughput gains without additional robots. As facilities aged, software subscriptions grew proportionally, making recurring revenue an attractive profit pool for automation vendors. Over the forecast horizon, a rising share of value creation is expected to come from learning algorithms that autonomously balance order waves, labour allocation, and energy consumption within each micro-fulfillment centre market node.
Note: Segment shares of all individual segments available upon report purchase
By Fulfillment Model: Integration Versus Specialization
Store-integrated nodes contributed 47.60% revenue in 2025, leveraging sunk real-estate costs and pre-existing traffic to accelerate go-live schedules. These hybrid sites used back-of-house space or adjacent annexes, minimizing zoning hurdles and keeping buy-online-pick-up-in-store services under one roof. However, throughput ceilings and parking constraints capped scalability. Dark stores, unconstrained by shopper traffic, registered a 29.55% CAGR and attracted grocery chains seeking 1-hour delivery within megacities. The micro-fulfillment centre market size for dark stores is expected to match integrated formats in major metros post-2030 as real-estate networks densify.
Operators increasingly adopted portfolio approaches. In suburban corridors where rent was lower and demand more diffuse, stand-alone MFCs served several towns within a 20-mile radius. In ultra-dense inner cities, retailers justified premium rents for basement-level micro sites because delivery savings outweighed occupancy costs. Facility mix decisions hinged on order volume profiles, vehicle restrictions, and marketing synergies with front-of-store formats.
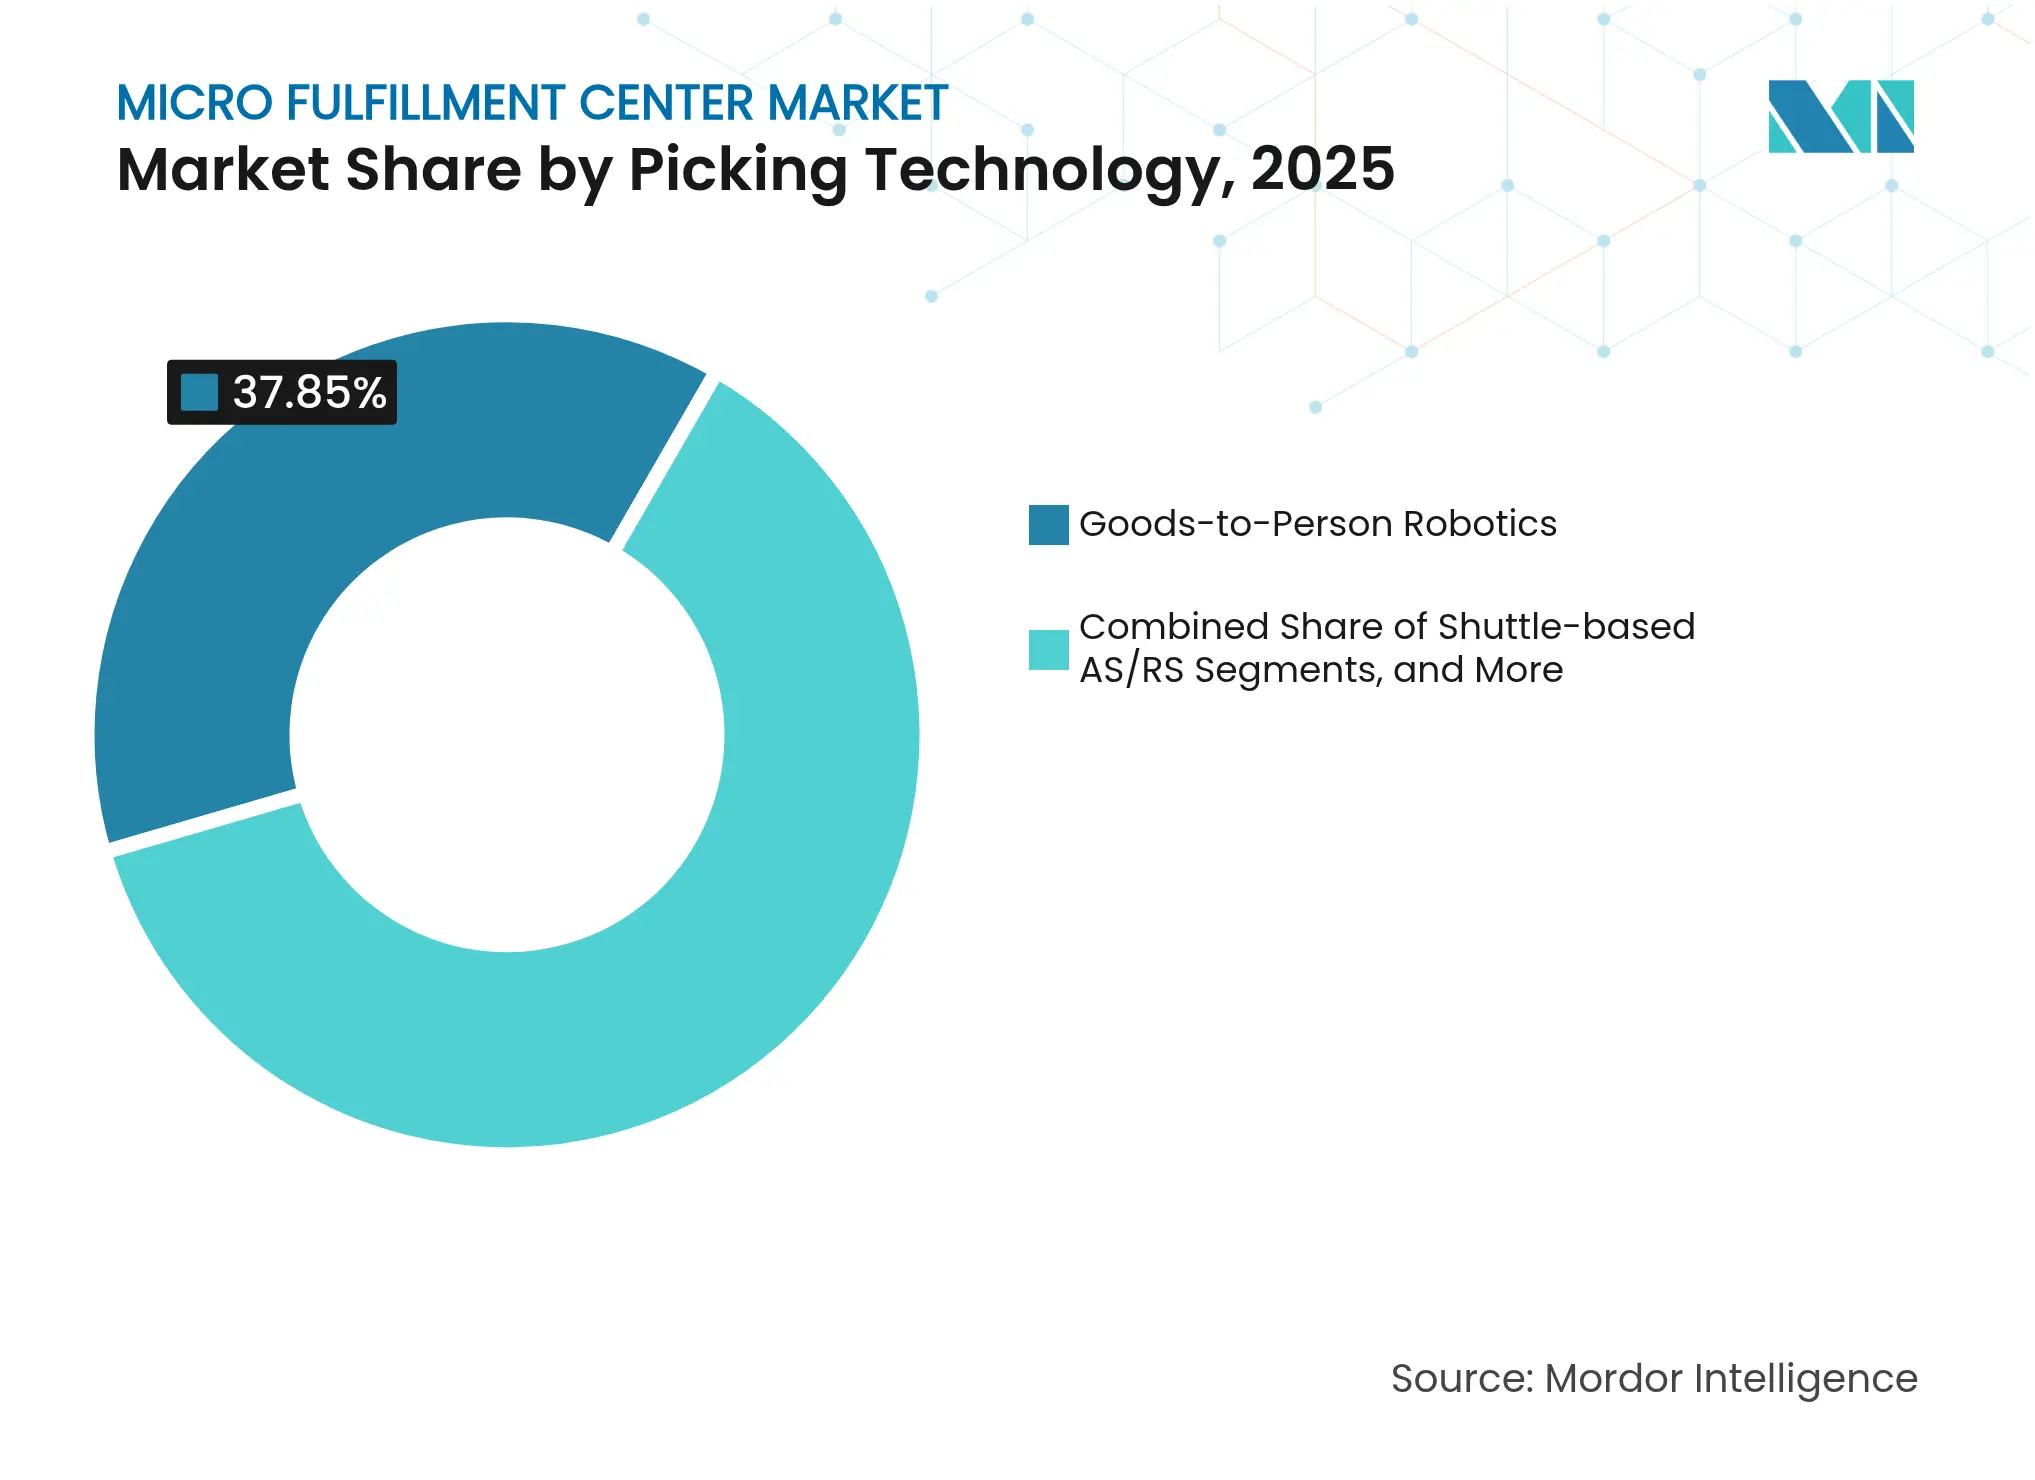
By Picking Technology: Robotics Revolution Accelerates
Goods-to-person robots owned a 37.85% revenue share in 2025 and are projected to compound at 33.9% annually through 2031 as falling sensor prices and better battery life enhance commercial viability. The micro-fulfillment centre market increasingly favoured flexible fleets that re-mapped pick paths overnight, adjusting to promos and seasonal SKU swings. Shuttle-based AS/RS systems retained strongholds in high-depth storage layouts where cubic efficiency trumped speed. Vertical lift modules addressed slower-moving or temperature-controlled items.
Hybrid deployments became mainstream. A single 15,000 ft² site might assign AMRs to fast movers, shuttles to bulky cases, and a mezzanine lift to premium SKUs requiring climate control. Mujin’s mixed-case palletizer illustrated convergence as advanced vision and path-planning software enabled robots to tackle previously manual tasks at competitive cost. The roadmap points to unified control suites that orchestrate multi-technology fleets under one optimization layer, reinforcing software’s rising influence on micro-fulfillment centre market outcomes.
Note: Segment shares of all individual segments available upon report purchase
By End-user: Traditional Retail Transformation
Traditional retailers and distributors held 45.70% revenue share in 2025 by embedding micro sites into omnichannel strategies that leveraged private-label margins and loyalty programs. Their existing procurement volumes secured favourable hardware pricing, while store footprints supplied real-estate optionality. E-commerce pure-players, growing at 30.2% CAGR, invested aggressively to protect customer-experience lead times as same-day delivery spread to second-tier cities. Some digital natives pivoted to small showroom spaces co-located with MFCs, blending experiential retail with last-mile control.
Consumer-goods manufacturers quietly expanded direct-to-consumer pilots using contract micro-fulfillment providers to capture data and diversify channels. Third-party logistics specialists formed multi-tenant hubs that pooled order volumes from regional grocers and specialty merchants, giving smaller brands gateway access to advanced automation without large balance-sheet commitments. Consolidation accelerated among 3PLs, evidenced by a 19% year-over-year rise in warehousing M&A during 2024 that concentrated expertise and bolstered negotiating leverage with robotics vendors.
North America secured 40.85% revenue in 2025, anchored by Walmart, Amazon, and regional grocers racing to tighten two-hour delivery promises in the top 50 MSAs. Brownfield tax incentives across Midwestern logistics corridors lowered conversion costs for vacant factories, accelerating deployments. Fire-code revisions for high-density automated storage prompted investment in water-fog and inert-gas suppression systems, adding 6–8% to project budgets but improving insurer confidence. Utilities collaborated on micro-grid pilots that paired rooftop solar with battery storage, reducing peak-demand charges for 24/7 robotic fleets.
Asia-Pacific recorded the fastest 27.05% CAGR forecast to 2031, propelled by China’s and India’s urban middle classes, who spent more on rapid grocery top-ups. Domestic automation firms such as Geek+ and HAI Robotics exported modular AMRs that cut acquisition costs up to 20%, making automation attainable for mid-tier retailers. Singapore and Seoul municipal planners embedded micro hubs into smart-city blueprints, allocating subterranean or podium-level space in mixed-use towers. Local zoning flexibility contrasted with stricter European regulations and hastened rollouts, boosting regional share gains.
Europe presented a patchwork of opportunities shaped by dense legacy city centres and sustainability mandates. Operators leveraged underused parking garages for last-mile nodes, reducing delivery van mileage but facing noise and traffic scrutiny from residents. Carbon-pricing mechanisms nudged retailers toward electric fleets and energy-positive buildings that captured heat from robot motors for HVAC reuse. Meanwhile, South America, the Middle East, and Africa saw targeted pilots in capital cities where congestion surcharges justified premium unit economics. Currency volatility and political risk delayed wider adoption, steering the micro-fulfillment centre market in those geographies toward asset-light 3PL partnerships.
Market Concentration
The micro-fulfillment centre market remained fragmented in 2025. AutoStore retained leadership in cube-based AS/RS with USD 645.7 million 2023 revenue and a refreshed R5 Pro robot optimized for e-commerce throughput. Symbotic carried a USD 22.4 billion backlog dominated by Walmart conversions, showcasing how large enterprise contracts shaped capacity planning. SoftBank’s acquisition of Berkshire Grey signaled investor appetite for AI-native robotics that could cross-sell into portfolio companies’ logistics networks.
Strategic moves revealed a pivot toward full-stack offerings. Comau’s purchase of Automha extended its reach from industrial robotics into warehouse software and shuttle systems, reinforcing trends toward vertical capability bundling. SSI SCHAEFER’s omnichannel site for Carhartt illustrated differentiation through turnkey integration that blended shuttles, WCS software, and retrofit services under one SLA.[4]SSI SCHAEFER, “Carhartt WIP Logistics Facility,” ssi-schaefer.com Vendors offered robotics-as-a-service contracts with uptime guarantees that shifted margin pools from upfront hardware to lifecycle support, aligning incentives with throughput outcomes.
White-space opportunities still attracted venture funding. Start-ups targeted temperature-controlled micro nodes for pharma and fresh meal kits, where current systems struggled with cold-chain compliance. Others experimented with ceiling-mounted shuttle rails that preserved floor area for packing cells. Competitive intensity is forecast to rise as general-purpose mobile manipulator platforms mature, lowering entry barriers and pressuring legacy suppliers to accelerate product roadmaps within the micro-fulfillment centre market.

*Disclaimer: Major Players sorted in no particular order
1. INTRODUCTION
2. RESEARCH METHODOLOGY
3. EXECUTIVE SUMMARY
4. MARKET LANDSCAPE
5. MARKET SIZE AND GROWTH FORECASTS (VALUE)
6. COMPETITIVE LANDSCAPE
7. MARKET OPPORTUNITIES AND FUTURE OUTLOOK
Market Definitions and Key Coverage
Segmentation Overview
Detailed Research Methodology and Data Validation
Primary Research
Desk Research
Market-Sizing & Forecasting
Data Validation & Update Cycle
Why Our Micro Fulfillment Center Baseline Earns Retail Planners' Trust
Benchmark comparison
| Market Size | Anonymized source | Primary gap driver | ||
|---|---|---|---|---|
USD 6.84 B (2025) | Mordor Intelligence | - | Anonymized source:Mordor Intelligence | Primary gap driver:- |
USD 6.2 B (2024) | Global Consultancy A | Software revenue excluded; single global CAGR | ||
USD 6.34 B (2024) | Industry Journal B | Counts nano pods, omits dark store retrofits |
Pricing Strategy for Semiconductor Components
3 Min Read
Accelerating Additive Manufacturing Adoption in India
3 Min Read
When decisions matter, industry leaders turn to our analysts. Let’s talk.