
Market Overview
| Study Period | 2020 - 2031 |
|---|---|
| Forecast Data Period | 2026 - 2031 |
| Base Year Market Size (2025) | USD 3.69 Billion |
| Market Size (2026) | USD 3.78 Billion |
| Market Size (2031) | USD 4.26 Billion |
| Growth Rate (2026 - 2031) | 2.41 % |
| Market Concentration | Medium |
Major Players *Disclaimer: Major Players sorted in no particular order Image © Mordor Intelligence. Reuse requires attribution under CC BY 4.0. | |
Singapore Facility Management Market Analysis by Mordor Intelligence
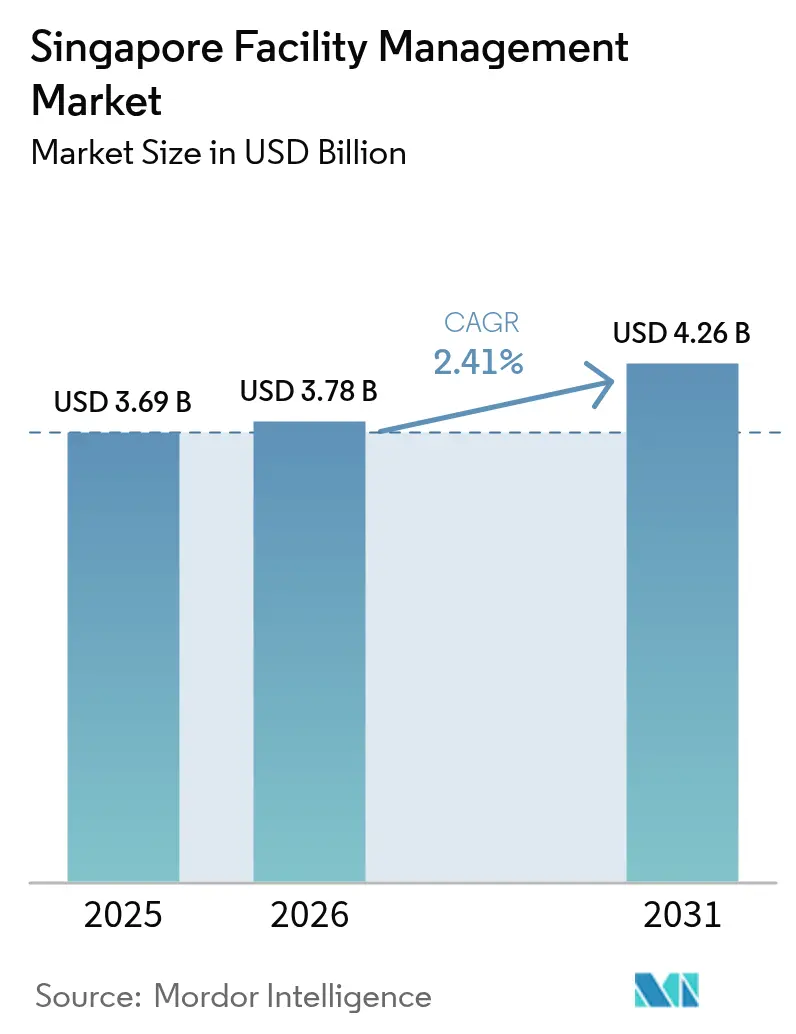
The Singapore facility management market size was valued at USD 3.69 billion in 2025 and estimated to grow from USD 3.78 billion in 2026 to reach USD 4.26 billion by 2031, at a CAGR of 2.41% during the forecast period (2026-2031). Growth is steady rather than explosive because Singapore’s built environment is already well-developed, so demand pivots toward smarter service delivery instead of new square footage. Widespread deployment of IoT sensors, cloud dashboards, and data-driven workflows under the Smart Nation program is reshaping service contracts, nudging customers toward longer-tenure, outcome-based agreements. Tighter foreign-worker quotas and escalating wages continue to push automation, while mandatory BCA Green Mark Plus rules accelerate investment in energy-efficient retrofits. Competition is shifting from price-led bidding to technology-rich value propositions as clients expect seamless hard and soft service integration with guaranteed key-performance outcomes.
Key Report Takeaways
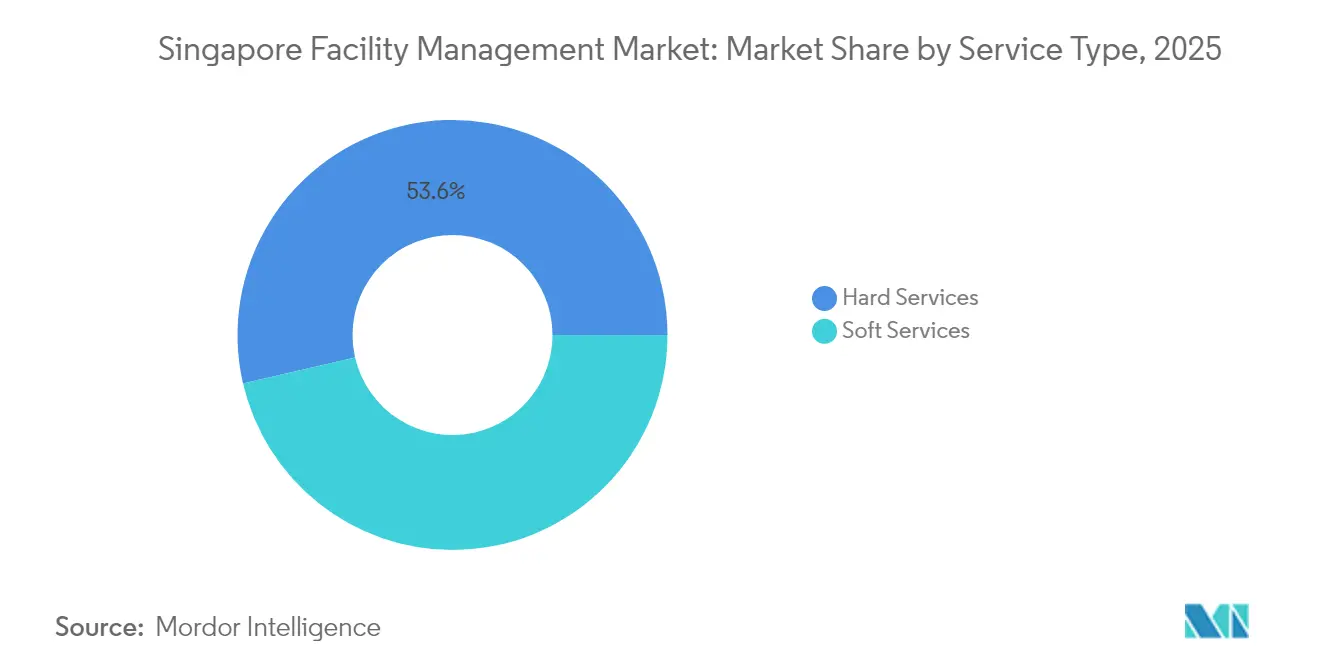
- By service type, hard services held 53.62% of the Singapore facility management market share in 2025; soft services are expanding at a 2.99% CAGR through 2031.
- By offering type, outsourced models commanded 62.98% of the Singapore facility management market size in 2025, while in-house delivery is projected to advance at a 3.88% CAGR to 2031.
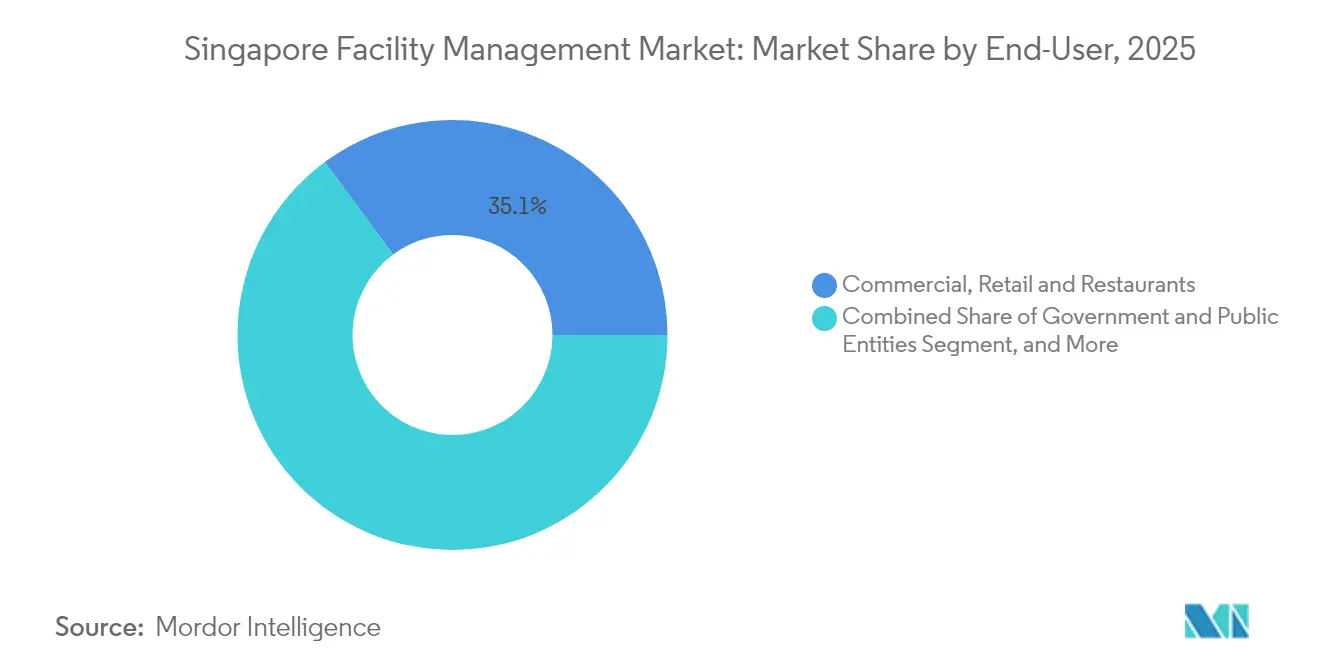
- By end-user, commercial, retail, and restaurants contributed 35.12% revenue in 2025; government, infrastructure, and public entities represent the fastest trajectory at 3.31% CAGR.
- By facility type, commercial buildings generated 37.55% of the 2025 value, yet public infrastructure is poised for a 5.05% CAGR through 2031.
Note: Market size and forecast figures in this report are generated using Mordor Intelligence’s proprietary estimation framework, updated with the latest available data and insights as of 2026.
Singapore Facility Management Market Trends and Insights
Drivers Impact Analysis*
| Driver | (~) % Impact on CAGR Forecast | Geographic Relevance | Impact Timeline |
|---|---|---|---|
| Outsourcing of Non-core Operations Accelerating | +0.60% | Singapore-wide, with spillover to regional operations | Medium term (2-4 years) |
| Infrastructure Boom in MRT-Linked Districts | +0.80% | Singapore, concentrated in western and central regions | Long term (≥ 4 years) |
| Mandatory BCA Green Mark Plus Compliance | +0.50% | Singapore commercial and institutional buildings | Short term (≤ 2 years) |
| Ageing Commercial Stock Requiring Lifecycle Upgrades | +0.30% | Singapore CBD and mature commercial districts | Medium term (2-4 years) |
| Smart Estates under Singapore Smart Nation Drive | +0.20% | Singapore-wide with pilot implementations | Long term (≥ 4 years) |
| Integrated Facilities Contracts in Public Healthcare | +0.10% | Singapore healthcare facilities and polyclinics | Medium term (2-4 years) |
| Source: Mordor Intelligence | |||


Outsourcing of Non-core Operations Accelerating
Organizations are handing off building operations so they can focus on core revenue drivers. Since May 2020, every public-sector contract for security has had to comply with Security Outcome-Based Contracting, forcing bidders to prove technology capabilities rather than supply headcount.[1]Singapore Police Force, “Security Outcome-Based Contracting,” police.gov.sg CapitaLand Integrated Commercial Trust illustrates how extensive outsourcing can become: property management for its USD 17.9 billion portfolio is handled by specialist subsidiaries that run leasing, engineering, and sustainability programs end-to-end.[2]CapitaLand Integrated Commercial Trust Management Limited, “Annual Report 2022,” investor.cict.com.sg Access to advanced analytics, computer-vision patrols, and predictive maintenance tools that would be cost-prohibitive to build in-house further strengthens the outsourcing rationale. As environmental disclosure rules tighten, clients also rely on external FM partners for carbon-reporting expertise. Collectively, these dynamics raise the bar for service providers while expanding contract scope and duration within the Singapore facility management market.
Infrastructure Boom in MRT-Linked Districts
Singapore is adding entire rail corridors, each embedding long-term O&M obligations. The Land Transport Authority’s USD 355.2 million Maju station civil package for Cross Island Line Phase 2 and the nine-year Jurong Region Line operating license awarded to the SBS Transit and RATP Dev consortium require AI-driven condition monitoring from day one.[3]Land Transport Authority, “Maju Station Civil Contract Award,” lta.gov.sg Asset owners, therefore, lock in integrated FM partners early, guaranteeing multi-decade revenue streams for vendors proficient in track-side facilities, station utilities, and crowd-flow analytics. Knock-on effects spread to retail podiums, office towers, and residential projects clustered around new stations, all of which demand unified building systems to ensure a frictionless commuter experience. This rail-centric development model underpins service line diversification and regional spillover growth for the Singapore facility management market.
Mandatory BCA Green Mark Plus Compliance
Since 2024, the updated Green Mark Plus framework mandates measurable year-on-year energy performance gains. The BCA–Microsoft pilot retrofitted 30 buildings with sensor-enabled chiller analytics that cut annual electricity consumption by up to 30%.[4]Attune, “Microsoft and BCA’s Chiller Efficiency Portal,” attuneiot.com Owners now require FM bidders to demonstrate live dashboards, anomaly detection, and guaranteed savings contracts. Financing tools such as BREEF allow providers to front capital expenditure and recoup it through verified utility savings, shifting FM from a cost center to an investment partner. Compliance deadlines over the next two years accelerate spend on smart meters, fault detection systems, and engineer upskilling programs. Vendors that can bundle energy audits with project management secure a competitive edge in the Singapore facility management market.
Ageing Commercial Stock Requiring Lifecycle Upgrades
Roughly 40% of CBD floor area predates current efficiency codes, driving retrofit demand. CapitaLand’s SGD 62 million (USD 45.9 million) overhaul of CQ @ Clarke Quay allocated 34% of capex solely to green features such as façade shading and high-efficiency chillers. These multiphase projects create complexity that favours FM firms proficient in coordinating contractors, reallocating tenants, and maintaining safety compliance during works. Predictive asset-condition assessments further extend building lifespan, aligning with owners’ ESG disclosure commitments. As more Grade A stock approaches renewal cycles, lifecycle-upgrade contracts will reinforce revenue stability for the Singapore facility management market.
Restraints Impact Analysis*
| Restraint | (~) % Impact on CAGR Forecast | Geographic Relevance | Impact Timeline |
|---|---|---|---|
| Highly Fragmented Local Vendor Base | -0.40% | Singapore-wide, affecting service standardization | Short term (≤ 2 years) |
| Tight Foreign-Worker Quotas and Rising Labour Costs | -0.30% | Singapore-wide, concentrated in labor-intensive services | Medium term (2-4 years) |
| Complex Tender Regulations for Government Sites | -0.20% | Singapore government and statutory board facilities | Medium term (2-4 years) |
| Limited Scalability in Island-State Geography | -0.10% | Singapore-wide, affecting growth strategies | Long term (≥ 4 years) |
| Source: Mordor Intelligence | |||
Highly Fragmented Local Vendor Base
Hundreds of micro-scale cleaning and security firms make contract administration cumbersome. Each additional subcontractor adds onboarding time, cybersecurity exposure, and interface risk, prompting large owners to consolidate suppliers. BCA now offers competency-based accreditations, but public-agency acceptance remains partial. Until aggregation or certification gains speed, disparate standards will temper efficiency gains in the Singapore facility management market.
Tight Foreign-Worker Quotas and Rising Labour Costs
In 2025, levies for S-Pass holders rose again, and dependency-ratio ceilings tightened. While Approved Training and Testing Centers subsidize upskilling, capacity falls short of market demand. Providers respond with robotics, for instance, autonomous floor-scrubbers and AI-driven HVAC optimization that cut manual interventions by 30% at CEVA Logistics’ warehouses. Still, wage inflation outpaces cost recovery in cleaning and security, squeezing margins across the Singapore facility management market.
*Our forecasts treat driver/restraint impacts as directional, not additive. The impact forecasts reflect baseline growth, mix effects, and variable interactions.
Segment Analysis
By Service Type: Hard Dominance with Soft Catch-Up
Hard services represented 53.62% of 2025 revenue within the Singapore facility management market share because mechanical, electrical, and plumbing systems must operate flawlessly in a humid tropical climate. Regulatory obligations for fire-safety certifications and lift-maintenance logs sustain baseline demand. Momentum toward predictive analytics is palpable, exemplified by the Green Mark chiller portal that digests vibration and temperature data to prevent downtime. Clients increasingly value lifecycle-cost optimization over reactive fixes, prompting bundled hard-FM contracts with outcome guarantees.
Soft services are expanding at 2.99% CAGR as outcome-based contracting decouples pricing from headcount. Security Outcome-Based Contracting compels guards to use drones, video analytics, and incident-reporting apps, redefining manpower deployment. Cleaning vendors adopt real-time quality sensors, while tenant-engagement apps coordinate catering and concierge tasks. Although soft services still trail hard services in absolute value, their technology-enabled rebound illustrates how the Singapore facility management market evolves from labour-intensive routines to data-validated experiences.


By Offering Type: Outsourced Strength and In-house Resurgence
Outsourcing held 62.98% of the Singapore facility management market size in 2025 because clients prefer one-stop specialists for compliance, warranty management, and sustainability reporting. Integrated FM contracts that fuse engineering, environmental, and hospitality tasks gain traction, with CapitaLand bundling leasing, technical, and ESG services under single-vendor accountability. Automated ticketing platforms and SLA dashboards lock in performance transparency, which owners increasingly treat as a risk-transfer mechanism.
In-house delivery, though just 37.02% in 2025, is forecast to grow 3.88% CAGR as data-center operators and government agencies seek tighter control over cybersecurity and critical systems. BCA Academy’s new smart-building curricula underpin this shift by supplying certified engineers versed in digital twins, IoT cybersecurity, and fault diagnostics. Hybrid models are also emerging where owners retain analytics and strategy while outsourcing boots-on-ground execution, reflecting nuanced demand patterns in the Singapore facility management market.
By End-User Industry: Commercial Leadership and Public-Sector Upswing
Commercial, retail, and restaurant sectors accounted for 35.12% of the 2025 value, thanks to Singapore’s role as an Asia-Pacific headquarters hub. High-rise office towers along Marina Bay rely on sophisticated energy dashboards to satisfy tenant sustainability pledges. Retail landlords integrate footfall analytics, predictive cooling, and tenant-service kiosks to enhance dwell time. Restaurants emphasize food-safety automation and smart waste tracking to comply with National Environment Agency guidelines, underscoring the segment’s digital maturity.
Government, infrastructure, and public entities are accelerating at a 3.31% CAGR. Multi-line contracts tied to MRT extensions, polyclinic expansions, and public-housing precinct upgrades embed 20-year maintenance scopes from inception. Outcome-based KPIs such as platform-temperature regulation and commuter-safety scores replace traditional unit-rate schedules, upgrading contract complexity. These long-horizon engagements, coupled with strict data-sovereignty clauses, elevate barriers to entry and expand opportunity within the Singapore facility management market.
By Facility Type: Commercial Building Scale and Infrastructure Velocity
Commercial buildings delivered 37.55% of 2025 revenue, anchoring the Singapore facility management market size through Grade A towers, malls, and mixed-use hubs. Vertical complexity demands advanced façade-cleaning robots, demand-responsive elevators, and AI-enabled air-distribution systems that cut cooling loads up to 15%. Property owners also deploy tenant-experience apps that amalgamate access control, e-payments, and community events, embedding FM providers deeper into the value chain.
Public infrastructure is expected to grow 5.05% CAGR, the fastest of any facility type, as MRT-linked megaprojects and fast-charging EV hubs proliferate. Volt, Keppel’s mobility unit, will run Southeast Asia’s largest public EV fast-charging hub, opening a new frontier for asset-intensive FM services in power management and uptime optimization. Stations, depots, and charging plazas require 24/7 monitoring, cybersecurity, and lifecycle asset-replacement programs, broadening service menus across the Singapore facility management market.
Geography Analysis
Singapore’s entire facility stock sits on just 720 square kilometres, enabling rapid response times and dense task clustering. That proximity supports multi-site patrol loops and centralized command centers, improving resource utilization. Yet the compact geography constrains capacity expansion, so providers pivot to cross-border growth by exporting best practices to Indonesia, Vietnam, and Malaysia after honing solutions locally. CapitaLand’s USD 74–111 million planned outlays for Vietnam industrial assets exemplify this outward push while maintaining a Singapore-based operational nerve center.
Smart Nation projects permeate every neighbourhood. IoT nodes monitor humidity and equipment vibration, while AI routines auto-dispatch technicians based on predictive alerts. The BCA–Microsoft initiative illustrates how real-time data becomes table stakes rather than a premium add-on. Tropical weather exacerbates Mold, corrosion, and equipment failures, necessitating constant dehumidification and proactive varnish inspections, especially in coastal districts.
Regulation is both a shield and a moat. Uniform codes streamline compliance across the island, but high standards covering energy intensity, fire safety, and accessibility favour incumbents familiar with local statutory nuances. Although the market’s physical reach is finite, the Singapore facility management market leverages its regulatory sophistication and tech adoption to influence regional benchmarks, positioning local vendors as preferred partners for emerging Southeast Asian smart-city ventures.
Regulatory Landscape
Singapore facility management (FM) regulation is anchored by the Building and Construction Authority (BCA). The BCA Facilities Management Registry, launched on 1 January 2024, requires firms providing FM services to the public sector to register under defined workheads, tying tender eligibility to government procurement. Updates to the Building Control Act also strengthen governance of maintenance and sustainability reporting, including the 2025 amendments to the Building Control (Reportable Matters) Regulations and the Building Control (Environmental Sustainability) (Amendment) Regulations 2025.
Competitive Landscape
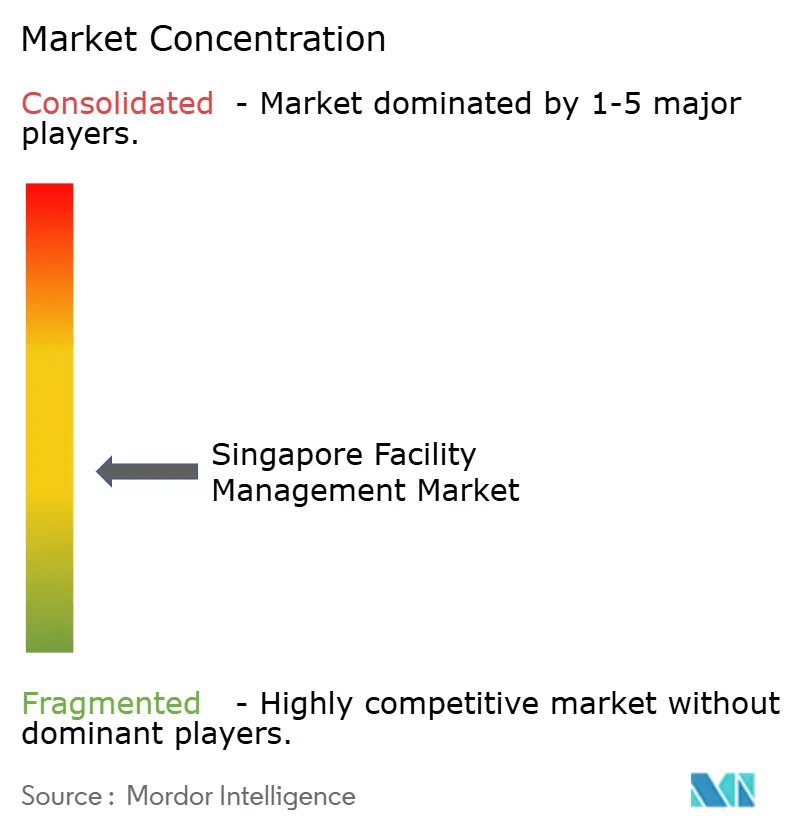
The market hosts global giants such as CBRE, ISS, and Cushman and Wakefield alongside local stalwarts like Certis CISCO and CBM. Global firms deploy enterprise-grade platforms and cross-border key-account programs, serving multinational tenants that mandate uniform SLA metrics across APAC. Local champions draw on intimate knowledge of Singapore’s legislative labyrinth and maintain strong ties with public agencies, winning sensitive contracts that require security clearances and social-enterprise labour schemes.
Outcome-based contracting and technology infusion act as catalysts for consolidation. Providers capable of integrating asset-performance analytics, energy-guarantee financing, and workforce-management robotics are snapping up niche specialists to fill capability gaps. The recent Security Outcome-Based Contracting framework favours capital-rich firms that can shoulder upfront investment in smart-patrol infrastructure. Meanwhile, tight labour quotas make scale matter: larger operators negotiate better robotics leasing terms and can absorb wage shocks, whereas smaller vendors risk margin compression.
White-space remains in high-growth verticals: data centers, healthcare facilities, and EV-charging networks. AWS’s USD 8.88 billion cloud-infrastructure expansion requires uptime tiers that few providers can meet, opening opportunities for mission-critical FM specialists. Hospitals and polyclinics shift to integrated contracts that bundle infection control, biomedical engineering, and facility security, further differentiating service propositions within the Singapore facility management market.
Singapore Facility Management Industry Leaders
ISS A/S
CBRE Group Inc.
CBM Pte Ltd
ENGIE Services Singapore (ENGIE SA)
Sodexo Singapore Pte. Ltd. (Sodexo Group)
- *Disclaimer: Major Players sorted in no particular order

Market Opportunities and Future Outlook
Government-led digitization and standardization are creating whitespace for providers that can implement Smart FM across portfolios. Punggol Digital District provides a reference architecture for data-driven FM at scale, using an Open Digital Platform (ODP) that aggregates data from more than 20,000 sensors for real-time visualization and predictive maintenance. Integrated and aggregated delivery models receive active funding rather than staying advisory.
BCA IFM/AFM Grant is sized at SGD 30 million, supports up to 50% of qualifying costs (capped at SGD 2.1 million per project), and requires at least a 20% productivity gain. That structure favors vendors that can consolidate hard and soft services into measurable, automation-led outcomes. On the governance side, SS ISO 41001:2024 provides a management-system benchmark that can be translated into auditable operating playbooks for multi-site customers, while interoperability enablers such as RoMi-H point to demand for integrating heterogeneous robot fleets, lifts, doors, and building management systems into unified service delivery, especially in labor-constrained cleaning, security, and healthcare environments.
Recent Industry Developments
- June 2026: Primech Holdings announced that its subsidiary Primech A & P Pte. Ltd. secured integrated facility services contracts for a public-sector education portfolio and a social service provider. The awards move multi-year, integrated delivery further into public facilities purchasing, supporting demand for workforce systems and productivity tools to sustain service levels.
- June 2025: ISS announced the renewal and expansion of a public healthcare contract in Southeast Asia. The expansion widens the scope to include broader support services and increases demand for quality documentation and uptime-oriented operating rigor in clinical-adjacent environments.
- September 2024: BCA implemented the Facilities Management (FM) Registry requirement for public-sector FM service providers, effective 1 January 2024. The rule tightens eligibility and standardizes workheads for tender participation, accelerating vendor consolidation and capability-building among firms pursuing repeat public-sector work.


Research Methodology Framework and Report Scope
Market Definition and Coverage
For this study, the Singapore facility management market is the spending tied to keeping buildings and public assets running day to day, covering hard and soft services delivered through in-house teams or outsourced providers.
Scope exclusions: We do not count one-off construction or renovation project costs that are not part of ongoing facility operations and service contracts.
Segmentation Overview
- By Service Type
- Hard Services
- Asset Management
- MEP and HVAC Services
- Fire Systems and Safety
- Other Hard FM Services
- Soft Services
- Office Support and Security
- Cleaning Services
- Catering Services
- Other Soft FM Services
- Hard Services
- By Offering Type
- In-house
- Outsourced
- Single FM
- Bundled FM
- Integrated FM
- By End-User Industry
- Commercial, Retail and Restaurants
- Manufacturing and Industrial
- Government, Infrastructure and Public Entities
- Institutional
- Other End-user Industries
- By Facility Type
- Commercial Buildings
- Industrial Facilities
- Public Infrastructure
- Institutional Buildings
- Other Facility Types
Data Sources, Market Sizing, and Validation
Desk Research
We start by collecting a steady set of Singapore building and operations signals so the model is anchored to real activity, not only to reported company narratives. Public sources such as BCA statistics and codes, URA market releases, Singapore Department of Statistics time series, and MOM labor indicators help us understand the addressable building stock, staffing intensity, and cost pressure.
To shape the service mix and demand drivers, we also review sources such as public procurement portals, major operator announcements, and annual reports of listed service providers with Singapore exposure, followed by reputable press and association updates. Paid subscriptions are used selectively for company financials and news screening, patent look-ups for maintenance technology themes, and import or export shipment views where equipment cycles affect hard-services demand. These sources mentioned are illustrative only, and many other public and paid references were used for data collection, validation, and clarification checks.
Primary Interviews and Surveys
We validate the desk inputs through interviews and structured surveys with facility managers, procurement and property operations leads, and service providers across hard and soft services, so gaps around contract scope and pricing are closed. The discussions also help us separate in-house delivery from outsourced contracts, and then confirm how single FM, bundled FM, and integrated FM are being packaged across different facility types in Singapore.
Distribution of primary research fieldwork respondents
| Company type | Respondent position |
|---|---|
| Top tier: 31% | CXOs: 13% |
| Mid tier: 54% | Functional/Unit leaders: 33% |
| Smaller Players: 15% | Managers: 54% |
Market-Sizing & Forecasting
The market is sized using a top-down build where Singapore demand is reconstructed from the operating base of facilities and the typical service intensity applied to them, and then checked with selective bottom-up roll ups. In practice, totals are tested using sampled contract values, provider revenue exposure to Singapore, and channel checks on service pricing, which are then used to adjust for over or under coverage.
Key inputs that keep the model grounded include the split between outsourced and in-house delivery, the service mix between hard services (such as MEP and HVAC upkeep, fire systems and safety, and asset management) and soft services (such as cleaning and security), staffing and wage trends, and the pace of new commercial and infrastructure activity that changes the serviced footprint. Where detailed values are missing for smaller providers, we fill the gap using calibrated ranges for contract size and frequency by facility type, and then re-check the implied spend per square foot with interview feedback.
For forecasting, we lean on scenario analysis because costs and outsourcing decisions can shift with labor availability, energy and compliance needs, and tenant expectations. Assumptions for outsourcing penetration, service bundling into integrated FM, and pricing movement are aligned to what practitioners expect over the next few budget cycles, and then stress-tested for conservative and faster adoption cases.
Data Validation & Update Cycle
Before sign-off, outputs are triangulated across multiple angles, including implied spend per facility, labor share logic, and consistency with known outsourcing penetration, which helps catch inflated totals early. Variance checks are run across service types and delivery models, and any outliers trigger a second analyst review and, when needed, a call-back to respondents to confirm whether a contract is recurring or project-led.
Reports are refreshed annually, and interim updates are made when material changes happen, such as regulation shifts, major public contract resets, or notable cost movements in labor and utilities. Right before delivery, we do a final data pass so clients receive an updated view that reflects the latest available signals.
Mordor Intelligence's Singapore Facility Management Market Size Compared With Other Published Estimates
Published market values for Singapore facility management often do not line up because firms set different rules for what counts as facility management spend, and they also do not always use the same base year or pricing basis. Differences also show up when one estimate leans more on outsourced contracts only, while another includes in-house operations and mixed delivery models.
In our checks, the biggest drivers behind the spread are whether integrated FM is treated as a separate market or counted within the full FM total, whether small local contract work is included, and how service pricing is updated for wage-led cost inflation. Base year choices also matter because a 2024 starting point will not match a 2025 starting point even if the scope is similar, and some publications apply faster or slower outsourcing penetration changes without re-validating with buyers and operators.
Benchmark comparison
| Source | Market Size | Gaps in Research Methodology |
|---|---|---|
| Mordor Intelligence | USD 3.69 B (2025) | |
| Industry Publisher A | USD 2.27 B (2024) | Uses a 2024 base and excludes small FM contracts handled by local providers, and the focus is weighted toward outsourced activity, which reduces the measured total versus a full delivery view. |
| Industry Blog B | USD 3.65 B (2025) | Shares a similar year but provides limited clarity on what is included across in-house delivery, bundled FM, and integrated FM, which can compress or expand the total depending on interpretation. |
The table shows that year selection and service inclusion rules can move the number by a meaningful margin. When in-house delivery and outsourced models are both counted and then validated using the outsourced share and service mix checks, the total stays tied to how facilities are actually operated in Singapore, which explains the higher 2025 figure used by Mordor Intelligence.


Key Questions Answered in the Report
What CAGR is forecast for the Singapore facility management market between 2026 and 2031?
The market is set to grow at 2.41% CAGR, moving from USD 3.78 billion in 2026 to USD 4.26 billion by 2031.
Which service category currently holds the largest share of facility spending in Singapore?
Hard services, covering mechanical, electrical and plumbing maintenance, account for 53.62% of 2025 spending.
Why are outsourced facility contracts so prevalent in Singapore?
Outsourcing dominates with 62.98% share because specialized vendors offer compliance expertise, technology investment and outcome-based guarantees that many owners prefer over in-house crews.
Which end-user vertical is expanding fastest through 2031?
Government, infrastructure and public entities are projected to rise at 3.31% CAGR, fueled by MRT expansions and smart-estate projects.
How does the Smart Nation program influence facility management?
The initiative embeds IoT sensors, predictive analytics and automated controls across buildings, making data-driven FM a baseline requirement for winning contracts.
What workforce challenges do Singapore FM companies face?
Tight foreign-worker quotas and rising wages spur automation investment while pressuring margins, especially in labor-intensive cleaning and security services.
Page last updated on:


 Your data is secure and never sold or shared.


