Managed Information Services Market Size and Share
Market Overview
| Study Period | 2020 - 2031 |
|---|---|
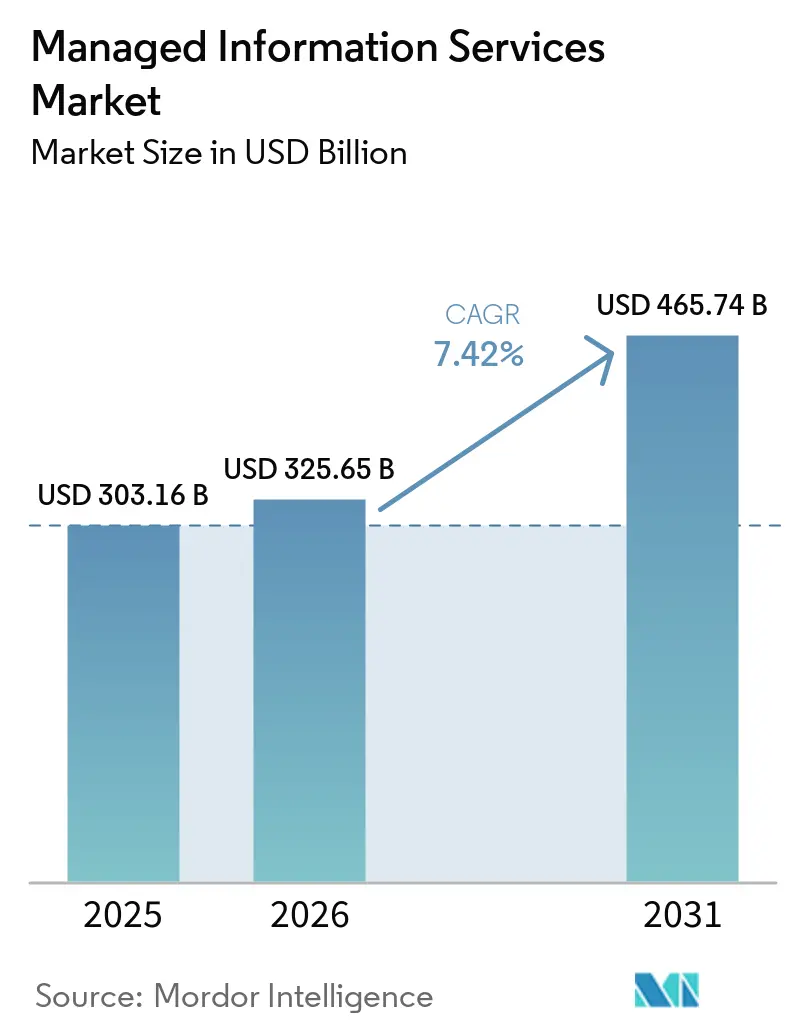
| Market Size (2026) | USD 325.65 Billion |
| Market Size (2031) | USD 465.74 Billion |
| Growth Rate (2026 - 2031) | 7.42% CAGR |
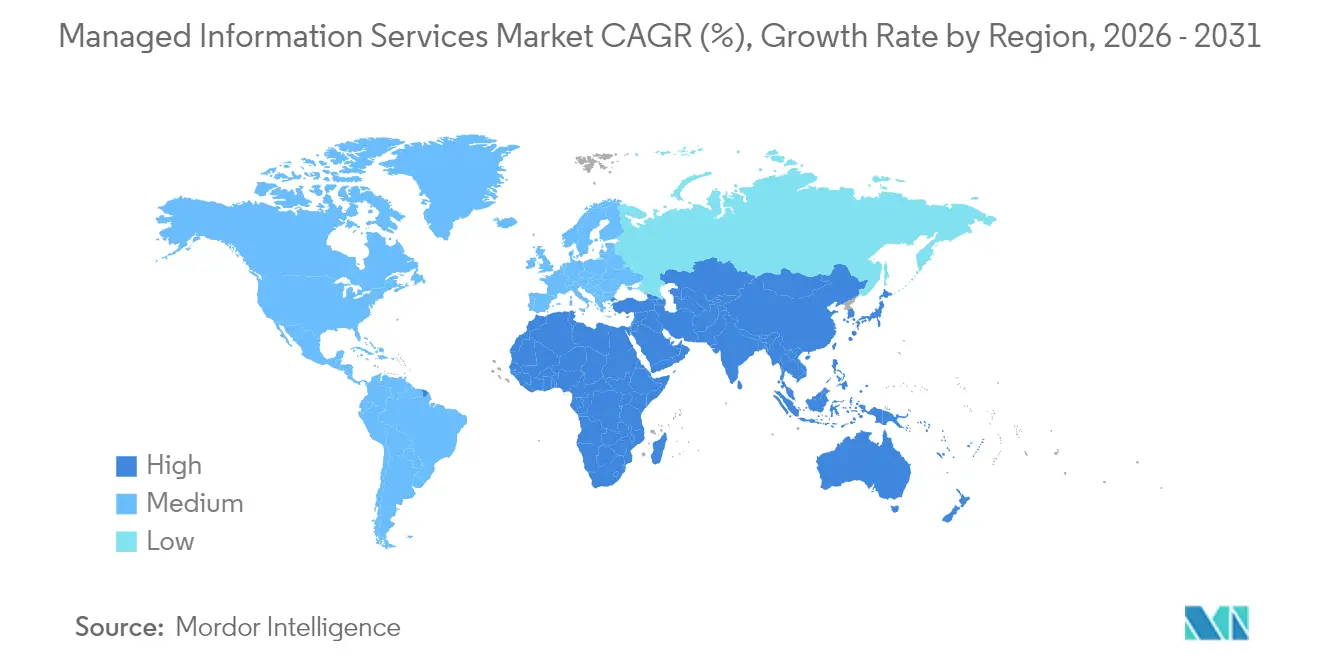
| Fastest Growing Market | Asia Pacific |
| Largest Market | North America |
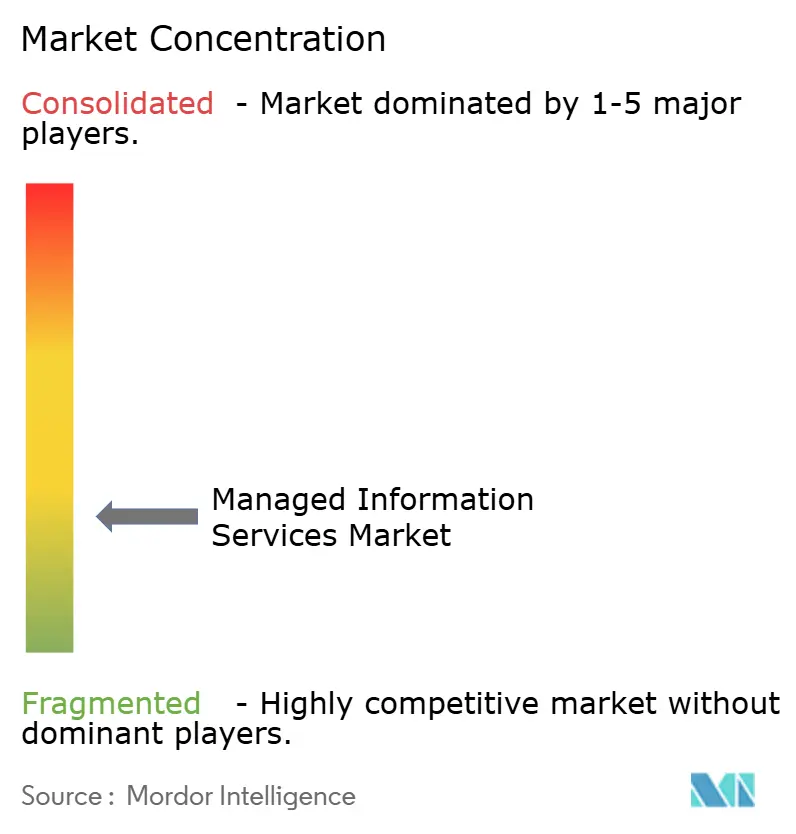
| Market Concentration | Low |
Major Players *Disclaimer: Major Players sorted in no particular order Image © Mordor Intelligence. Reuse requires attribution under CC BY 4.0. | |
Managed Information Services Market Analysis by Mordor Intelligence
Managed information services market size in 2026 is estimated at USD 325.65 billion, growing from 2025 value of USD 303.16 billion with 2031 projections showing USD 465.74 billion, growing at 7.42% CAGR over 2026-2031. Robust demand persists because enterprises are shifting from ownership to consumption models, accelerating cloud-first roadmaps, and closing critical talent gaps through specialist partners that embed automation and artificial intelligence into day-to-day operations. The managed information services market also benefits from cyber-risk escalation, mounting regulatory pressure, and the need for always-on resilience that most internal IT teams cannot fund or staff at scale. North America continues to anchor global spending, although rapid digitalization across Asia-Pacific is narrowing the gap. Competitive advantage now flows to providers capable of outcome-based contracts, unified management across hybrid architectures, and continuous security operations that align with evolving compliance mandates.
Key Report Takeaways
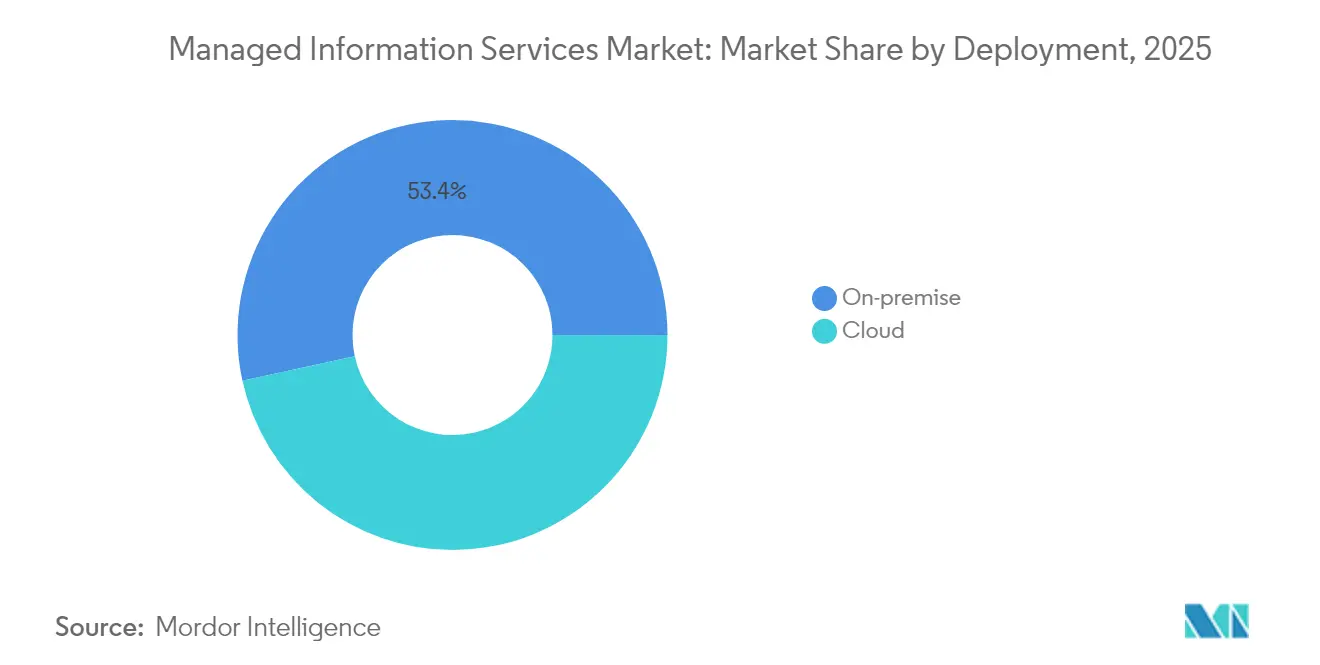
- By deployment, on-premise solutions held 53.42% of managed information services market share in 2025, while cloud-based delivery is advancing at a 13.25% CAGR through 2031.
- By service type, managed security services captured 28.92% of the managed information services market size in 2025 and lead growth at 14.18% CAGR to 2031.
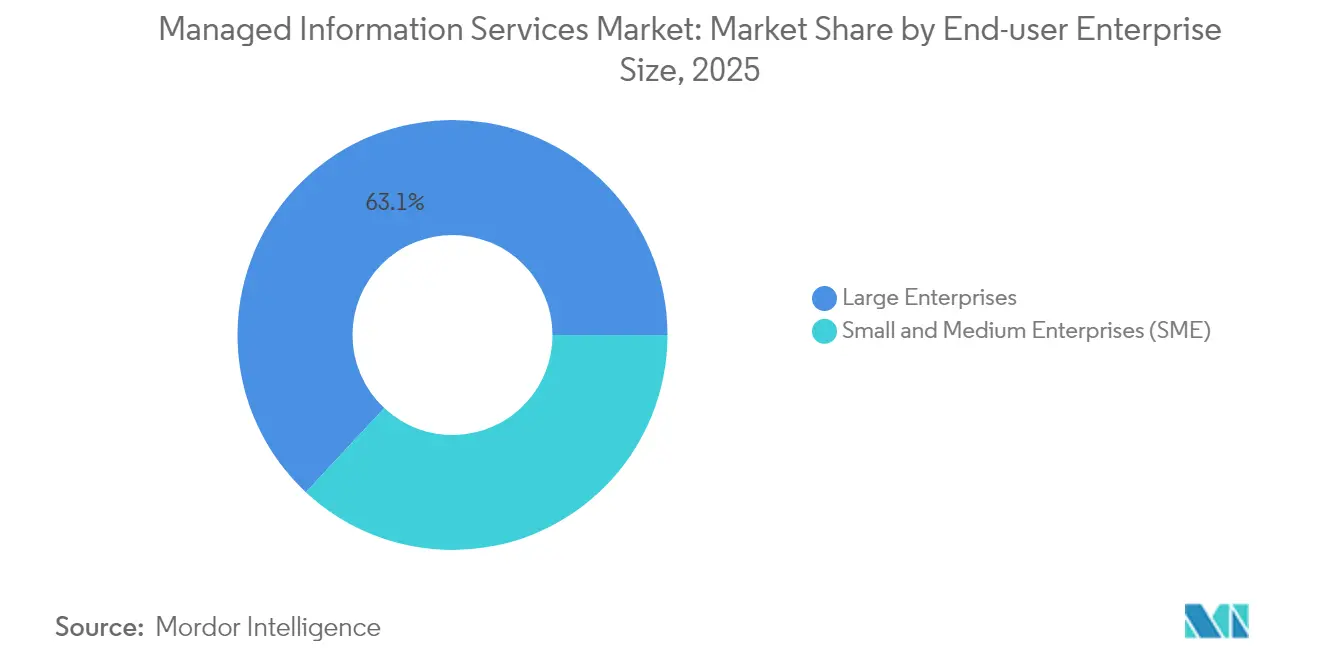
- By enterprise size, large enterprises accounted for 63.05% share of the managed information services market size in 2025; small and medium enterprises are expanding at 12.08% CAGR through 2031.
- By end-user vertical, banking, financial services, and insurance led with 20.78% revenue share in 2025, whereas healthcare is projected to grow at 12.84% CAGR to 2031.
- By geography, North America commanded 34.87% of managed information services market share in 2025, but Asia-Pacific is the fastest-growing region at 12.45% CAGR to 2031.
Note: Market size and forecast figures in this report are generated using Mordor Intelligence’s proprietary estimation framework, updated with the latest available data and insights as of 2026.
Global Managed Information Services Market Trends and Insights
Drivers Impact Analysis*
| Driver | (~) % Impact on CAGR Forecast | Geographic Relevance | Impact Timeline |
|---|---|---|---|
| Shift to hybrid / multi-cloud architectures | +1.8% | Global with early gains in North America and EU | Medium term (2-4 years) |
| Cost-optimization and OPEX preference | +1.5% | Global, strong in Asia-Pacific and emerging markets | Short term (≤2 years) |
| Escalating cyber-threat and compliance pressure | +2.1% | Global with regulatory intensity in EU and North America | Short term (≤2 years) |
| Edge-computing roll-outs requiring local MSP nodes | +1.2% | Asia-Pacific core, spill-over to MEA and Latin America | Medium term (2-4 years) |
| Sustainability mandates for green managed services | +0.9% | EU leadership, expanding to North America and Asia-Pacific | Long term (≥4 years) |
| AI-driven autonomous operations (AIOps) maturity | +1.4% | North America and EU early adoption, Asia-Pacific following | Medium term (2-4 years) |
| Source: Mordor Intelligence | |||
Shift to Hybrid / Multi-Cloud Architectures
Hybrid and multi-cloud have become a board-level imperative rather than a tooling preference, with 90% of enterprises projected to adopt the approach by 2027. Workload portability, data residency rules, and vendor diversification multiply operational complexity, prompting organisations to source unified management from third-party specialists. Cisco reports that 53% of firms move workloads between on-premise and cloud environments each week, creating sustained demand for orchestration platforms and cross-domain governance services.[1]Cisco Systems, “2025 Hybrid Cloud Survey,” Cisco, cisco.com Providers that supply consistent policy enforcement, integrated observability, and automated workload placement across dissimilar platforms currently command premium pricing. Adoption is most visible in highly regulated sectors that must simultaneously satisfy compliance and innovation goals, reinforcing the value proposition of managed services that can blend local control with cloud agility.
Cost-Optimization and OPEX Preference
Economic uncertainty and rapid technology churn are driving finance leaders toward predictable subscription spending. Managed services convert capital outlays into operating expenses while transferring hardware obsolescence, licence management, and talent retention risks to the vendor. Small and medium enterprises are embracing the model fastest because it unlocks enterprise-grade security and analytics without heavy up-front investment. Providers also assume compliance reporting and incident response responsibilities, allowing internal teams to redirect scarce skills toward customer-facing innovation. As a result, OPEX-driven contracts increasingly include outcome guarantees tied to service levels, user experience, and business metrics rather than infrastructure availability alone.
Escalating Cyber-Threat and Compliance Pressure
Cyber-attacks have grown both in frequency and sophistication, with predictions that 17% of incidents will leverage generative AI by 2027. Organisations therefore require around-the-clock monitoring, threat intelligence, and incident response that few can sustain internally. Managed security services revenue per client now averages USD 8,900 per month among hybrid MSP / MSSP firms.[2]IBM Corporation, “2025 X-Force Threat Intelligence Index,” IBM, ibm.com Regulations such as the EU Digital Operational Resilience Act impose continuous control testing and reporting, further boosting demand for managed detection and response, compliance automation, and zero-trust frameworks delivered as a fully managed package. Providers integrating security orchestration and automated response workflows differentiate by shrinking dwell time and demonstrating clear risk-reduction metrics.
Edge-Computing Roll-Outs Requiring Local MSP Nodes
Smart city projects, industrial IoT programs, and 5G deployments are pushing compute resources closer to data sources. Each edge site introduces new device, network, and security considerations that often exceed the scope of central IT teams. Expereo notes that distributed sites in Asia-Pacific are scaling fastest as governments fund manufacturing modernisation and digital public services.[3]Expereo, “Edge Computing Connectivity Trends 2025,” Expereo, expereo.com Managed service providers with global footprints and local field engineering capacity are therefore preferred partners because they can operate “lights-out” infrastructure with minimal on-site staff. Service bundles increasingly include edge orchestration, remote remediation, and secure connectivity that align with industry-specific latency and compliance targets.
Restraints Impact Analysis*
| Restraint | (~) % Impact on CAGR Forecast | Geographic Relevance | Impact Timeline |
|---|---|---|---|
| Legacy integration and regulatory complexity | -1.3% | Global, with particular intensity in regulated industries | Medium term (2-4 years) |
| Data-sovereignty / privacy concerns | -0.8% | EU and China leadership, expanding globally | Long term (≥ 4 years) |
| Skilled-talent crunch inflating MSP costs | -1.1% | Global, acute in North America and EU | Short term (≤ 2 years) |
| Serverless / No-Ops architectures reducing MSP scope | -0.7% | North America and EU early adoption | Long term (≥ 4 years) |
| Source: Mordor Intelligence | |||
Legacy Integration and Regulatory Complexity
Many enterprises run core applications on decades-old systems that cannot easily interface with modern managed platforms. Banking, utilities, and public-sector agencies face stringent audit requirements that demand bespoke controls, specialised adapters, and extended validation cycles. Custom integration inflates project costs and erodes the economies of scale that make managed services attractive. Compliance frameworks such as SOX and GDPR often mandate on-premise audit logging and data segregation, forcing providers to deploy dedicated environments that increase delivery effort. These factors lengthen sales cycles and delay time-to-value, especially for global organisations with diverse regulatory obligations.
Serverless / No-Ops Architectures Reducing MSP Scope
Public-cloud vendors now offer serverless computing that abstracts infrastructure provisioning, patching, and scaling. As adoption rises, portions of traditional managed infrastructure services risk disintermediation. Cloud Foundry reports that 19% of enterprises already use serverless functions in production, and another 42% intend to evaluate within two years.[4]Cloud Foundry Foundation, “Global Serverless Adoption Study 2025,” Cloud Foundry, cloudfoundry.org Providers must therefore pivot toward higher-value activities such as event-driven application management, policy governance, and runtime security. Failure to evolve beyond basic monitoring and maintenance could lead to revenue compression, especially in mature markets where automation levels are well advanced.
*Our forecasts treat driver/restraint impacts as directional, not additive. The impact forecasts reflect baseline growth, mix effects, and variable interactions.
Segment Analysis
By Deployment: Cloud Acceleration Amid On-Premise Dominance
On-premise environments retained 53.42% of managed information services market share in 2025 because many highly regulated firms continue to demand direct infrastructure custody. Heavy investments in private data centres and latency-sensitive workloads further anchor this preference. Yet cloud-based managed services are on track for a 13.25% CAGR through 2031, underscoring that workload migration is gathering pace across industries that prize agility and elastic consumption. Hybrid estates now prevail, compelling service providers to offer single-pane visibility, automated configuration drift remediation, and uniform security controls across both venues.
Cloud acceleration also reflects growing trust in hyperscale platforms that now provide sector-specific compliance blueprints, sovereign cloud zones, and granular encryption options. Enterprises moreover recognise that cloud modernisation is inseparable from application transformation, driving demand for refactoring, DevSecOps pipelines, and continuous compliance monitoring. Managed services partners that demonstrate certified cloud expertise, proprietary migration accelerators, and robust financial optimisation tooling are winning larger contract scopes. Conversely, providers limited to data-centre outsourcing risk contract attrition as clients adopt cloud-native design patterns and expect proactive guidance on workload placement economics.


By Service Type: Security Services Lead Growth Acceleration
Managed security services controlled 28.92% of the total revenue pool in 2025 and are expanding at 14.18% CAGR, reflecting cyber risk’s elevation to an enterprise-wide priority. Advanced services now blend threat intelligence, behaviour analytics, and automated response executed through unified platforms, reducing manual triage workloads.
Demand also rises for zero-trust network access, cloud workload protection, and supply-chain risk assessments. In parallel, managed data-centre and network services continue to deliver predictable annuity streams, but their growth trails security because infrastructure automation compresses traditional ticket volumes. Service portfolios are therefore converging around secure multi-cloud enablement, with providers integrating identity governance, data loss prevention, and compliance dashboards. Canalys highlights that combined security and cloud optimisation offerings generate 1.6 times higher cross-sell revenue relative to siloed propositions. Vendors investing in MDR platforms, security analytics, and specialist incident-response teams consequently command differentiated margins.
By Enterprise Size: SME Segment Drives Market Democratization
Large enterprises represented 63.05% of revenue in 2025 owing to complex application estates, multi-region governance, and continuous compliance needs that mandate advanced managed services. These organisations typically sign multi-year global agreements that bundle infrastructure, cloud, workplace, and security operations under unified service-level frameworks. Notably, average deal size exceeds USD 65 million and often encompasses transformative commitments such as application modernisation and AI-assisted operations.
Small and medium enterprises, however, register the fastest trajectory at 12.08% CAGR. Adoption is propelled by persistent cyber threats, hybrid workplace models, and acute talent shortages that raise the cost of standing up in-house teams. Providers are addressing affordability concerns through modular service catalogues, fixed-fee bundles, and marketplace distribution channels. The managed information services market size for the SME segment is expected to double by 2030 as consumption-based billing and remote delivery models further reduce entry barriers. Successful vendors couple automated onboarding, prescriptive best-practice blueprints, and vertical templates that accelerate time-to-value for resource-constrained clients.
By End-User Vertical: Healthcare Accelerates Digital Transformation
Banking, financial services, and insurance led in 2025 with 20.78% share, driven by stringent data-protection statutes, real-time fraud monitoring, and high-frequency transaction systems that demand five-nines uptime. Managed providers in this domain are expanding capabilities around regulatory reporting automation, open-banking API security, and AI-enabled credit-risk analytics. Despite BFSI dominance, healthcare is pacing the managed information services market at 12.84% CAGR to 2031. Growth is tied to electronic health record interoperability, telemedicine expansion, and the imperative to secure sensitive patient data without impeding clinical workflows.
Hospital groups also seek managed services partners to implement medical-device segmentation, imaging-data archiving, and HIPAA audit readiness. Interoperability mandates compel integration of legacy systems, cloud-based analytics, and edge devices within secure frameworks. Manufacturing, retail, and public-sector entities register steady uptake as they digitise supply chains, modernise citizen platforms, and embed IoT sensors on production lines. In each case, providers that combine domain expertise, regulatory fluency, and automation-driven efficiency gain competitive traction.
Geography Analysis
North America retained 34.87% of 2025 revenue due to early cloud adoption, sophisticated cybersecurity regulations, and a deep ecosystem of tier-one providers. Enterprises in the United States routinely demand predictive analytics, AI-assisted operations, and outcome-based contracts that tie fees to business KPIs. Canada adds momentum through federal digital-government programmes and modern banking initiatives that depend on secure multi-cloud elasticity. Many providers deploy regional delivery hubs and sovereign cloud zones to comply with evolving state-level privacy laws while sustaining low-latency service levels.
Asia-Pacific is the fastest-growing theatre at 12.45% CAGR and is closing the gap on incumbent regions. China scales managed information services through smart-city investments and manufacturing upgrade policies that require edge orchestration and secure connectivity. Southeast Asian nations are leapfrogging legacy infrastructure by adopting cloud-hosted applications and mobile-first commerce, necessitating partner support for network optimisation and regulatory compliance. Providers that establish joint ventures, multilingual service desks, and region-specific vertical solutions are well positioned to capture wallet share.
Europe shows mature yet resilient demand anchored in GDPR, the Digital Operational Resilience Act, and sustainability reporting obligations. Germany and the United Kingdom remain top spenders, but southern Europe is accelerating as EU recovery funds support digitisation projects. Providers differentiate by offering measurable carbon-reduction initiatives, EU-only data residency, and audit-ready compliance artefacts. Over time, tighter environmental rules will shift procurement criteria toward partners that demonstrate verifiable progress on renewable energy sourcing and circular-economy hardware practices

Competitive Landscape
The managed information services market is moderately fragmented yet consolidating as private-equity firms aggregate regional MSPs into scale platforms. IBM, Accenture, and Tata Consultancy Services collectively held roughly 18% of global revenue in 2024, leveraging broad portfolios, proprietary automation frameworks, and deep industry credentials. Cloud hyperscalers such as Microsoft and Amazon Web Services continue to push up the stack with managed databases, security, and observability services that encroach on traditional outsourcing. Telecommunications operators including Orange Business and Deutsche Telekom monetise network reach by bundling connectivity with edge orchestration, SD-WAN, and zero-trust access.
Strategic differentiation increasingly focuses on artificial intelligence and vertical specialisation. IBM’s USD 6.4 billion agreement to purchase HashiCorp expands multi-cloud automation assets and secures enterprise pipeline across hybrid estates. Accenture has completed more than 30 cloud and sustainability acquisitions since 2024 to bolster capabilities in green IT, data-platform engineering, and industry consulting. Private-equity backed “mega-MSPs” now exceed 100 in the United States, combining centralised back-office functions with local customer intimacy to drive operating leverage. Emerging disruptors emphasise fully automated, per-user pricing that compresses margins for labour-intensive incumbents.
Price competition coexists with service-level escalation, prompting providers to embed predictive incident avoidance, self-healing scripts, and consumption-based billing aligned to business outcomes. Successful vendors pair deep partner ecosystems with proprietary IP such as AIOps platforms, cyber-digital twins, and low-code integration accelerators that lock in stickiness. The convergence of cloud, security, connectivity, and sustainability mandates sustains high switching costs and favours vendors able to orchestrate complex multi-domain engagements under unified governance frameworks.
Managed Information Services Industry Leaders
IBM Corporation
Accenture plc
Cisco Systems Inc.
Microsoft Corporation
AT&T Inc.
- *Disclaimer: Major Players sorted in no particular order

Recent Industry Developments
- June 2025: Shield Technology Partners launched with over USD 100 million in initial funding from Thrive Holdings and ZBS Partners, establishing an AI-enabled managed service provider platform aimed at expanding the US network and enhancing IT services for local businesses.
- June 2025: NWN Corporation acquired InterVision Systems, a managed services provider, to enhance its AI-powered technology solutions and expand capabilities in customer experience, cybersecurity, and intelligent infrastructure for mid-to-enterprise and public-sector organizations.
- April 2025: IBM announced its acquisition of Hakkoda Inc., a global data and AI consultancy, to enhance IBM Consulting's data transformation services and provide specialized data platform expertise for AI-driven business operations.
- April 2025: Kyndryl and Microsoft launched enhanced data security and risk management services through Kyndryl Consult Data Security Posture Management, focusing on AI-ready data security across hybrid environments.


Research Methodology Framework and Report Scope
Market Definitions and Key Coverage
Our study counts revenue generated when enterprises hand over the steady-state monitoring, maintenance, security, and optimization of data-center, network, application, and endpoint estates to third-party managed service providers that commit to multi-year service-level agreements.
Scope exclusion: One-time consulting, staff-augmentation contracts, and stand-alone SaaS subscriptions are outside the market.
Segmentation Overview
- By Deployment
- On-premise
- Cloud
- By Service Type
- Managed Data Centre
- Managed Security
- Managed Communications (UC and VoIP)
- Managed Network (LAN/WAN/SASE)
- Managed Infrastructure (Server / Storage)
- Managed Mobility and Device
- Managed Application and DevOps
- By End-user Enterprise Size
- Small and Medium Enterprises (SME)
- Large Enterprises
- By End-user Vertical
- BFSI
- IT and Telecom
- Healthcare
- Media and Entertainment
- Retail and E-commerce
- Manufacturing
- Government and Public Sector
- Other Verticals
- By Geography
- North America
- United States
- Canada
- Mexico
- South America
- Brazil
- Argentina
- Rest of South America
- Europe
- Germany
- United Kingdom
- France
- Italy
- Russia
- Spain
- Switzerland
- Rest of Europe
- Asia-Pacific
- China
- India
- Japan
- South Korea
- Malaysia
- Singapore
- Vietnam
- Indonesia
- Rest of Asia-Pacific
- Middle East and Africa
- Middle East
- Saudi Arabia
- United Arab Emirates
- Turkey
- Rest of Middle East
- Africa
- Nigeria
- South Africa
- Rest of Africa
- Middle East
- North America
Detailed Research Methodology and Data Validation
Primary Research
Phone interviews with MSP sales heads, procurement managers in BFSI and healthcare, and cloud-channel distributors across North America, Europe, Asia-Pacific, and the Gulf helped us pin down average deal sizes, contract terms, and price floors. A short online survey of SMEs added clarity on adoption thresholds and payback expectations.
Desk Research
We began by pairing public MSP revenue statements and investor decks with macro ICT-spend series from the International Telecommunication Union, Eurostat, OECD, and the U.S. Bureau of Economic Analysis. Our team also scanned CompTIA contract notices, news archives in Dow Jones Factiva, company snapshots on D&B Hoovers, and Questel patent clusters to flag automation pushes shaping service mix. These sources are illustrative; many other trusted documents informed data checks.
Market-Sizing & Forecasting
Mordor analysts built a top-down frame by linking regional corporate IT outlay to the observed penetration of managed engagement models, then apportioning value by service line using primary insights. Bottom-up checks, vendor-revenue roll-ups and sampled ASP-times-endpoint calculations, tempered totals. Key variables include managed security spend per employee, share of workloads on outsourced clouds, device fleet under management, regulatory-audit frequency, and regional IT-wage inflation. A multivariate regression extends trends through 2030, while scenario analysis around recession and cyber-risk bounds the range.
Data Validation & Update Cycle
We run automated variance scans, peer reviews, and senior sign-offs, comparing outputs with invoice datasets, staffing counts, and contract databases. Models refresh every year, with interim updates when major breaches, M&A, or landmark wins shift fundamentals, and a final analyst sweep just before release ensures clients receive the freshest view.
Why Mordor Intelligence's Managed Information Services Baseline Stands Firm
Published estimates often differ because providers choose varied revenue buckets, price-uplift paths, and revision timetables. By applying disciplined scope filters and a dual-lens model, we keep figures reproducible and free from hidden inclusions. Key gap drivers are whether BPO income is bundled, if cloud IaaS spend is double-counted, the aggressiveness of price inflation, and how quickly models reopen after cyber events.
Benchmark comparison
| Market Size | Anonymized source | Primary gap driver |
|---|---|---|
| USD 303.16 B (2025) | Mordor Intelligence | |
| USD 330.37 B (2025) | Global Consultancy A | Bundles telecom outsourcing, lacks field validation |
| USD 377.49 B (2025) | Industry Publisher B | Adds broad BPO revenue and uniform 8 % price lift |
| USD 304.45 B (2025) | Research Group C | Excludes mobility and DevOps, one-step forecast |
These contrasts show that Mordor's balanced mix of verified revenue pools, realistic price curves, and scheduled refreshes yields a dependable baseline that decision-makers can trace to transparent variables.


Key Questions Answered in the Report
What is the current size of the managed information services market?
The market reached USD 325.65 billion in 2026 and is forecast to hit USD 465.74 billion by 2031.
Which deployment model is growing fastest?
Cloud-based managed services are rising at 13.25% CAGR, outpacing on-premise solutions.
Why are managed security services in high demand?
Escalating AI-enabled cyber threats and stringent regulations are driving 14.18% CAGR for managed security services.
Which region shows the highest growth momentum?
Asia-Pacific leads with a 12.45% CAGR due to rapid digitisation, government programs, and rising cloud adoption.
How are small and medium enterprises benefiting from managed services?
SMEs gain enterprise-grade capabilities and predictable OPEX models, fuelling a 12.08% CAGR for their segment.
Page last updated on:


