
Security And Vulnerability Management Market Size and Share
Market Overview
| Study Period | 2020 - 2031 |
|---|---|
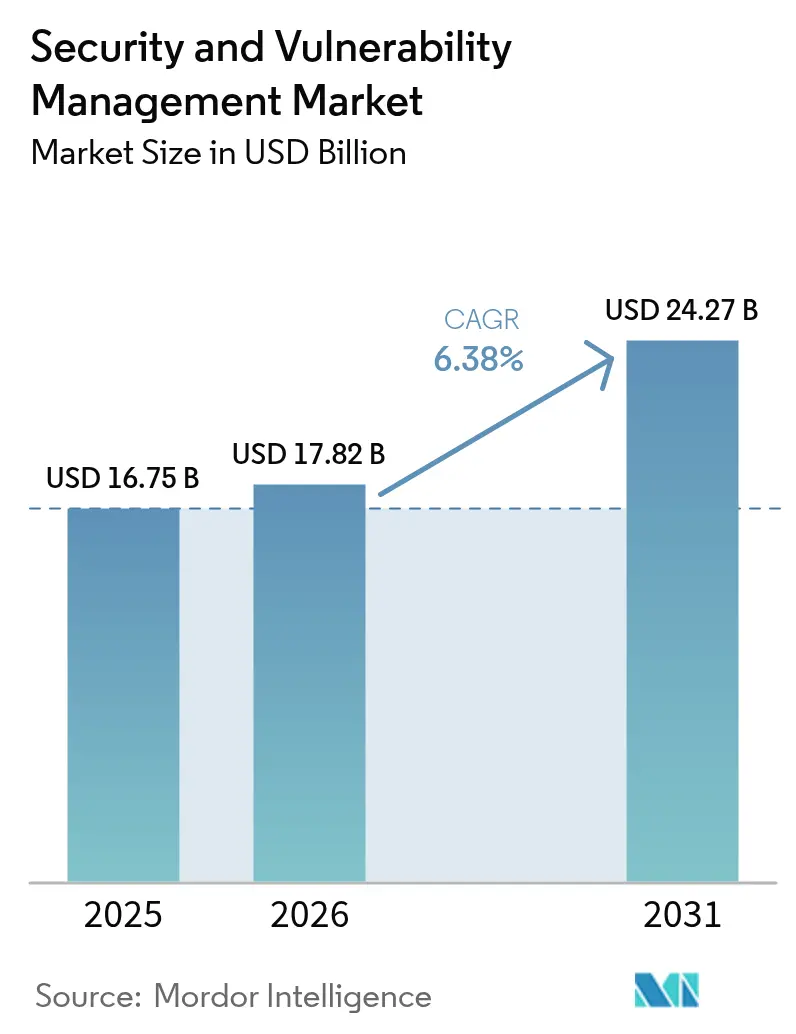
| Market Size (2026) | USD 17.82 Billion |
| Market Size (2031) | USD 24.27 Billion |
| Growth Rate (2026 - 2031) | 6.38 % |
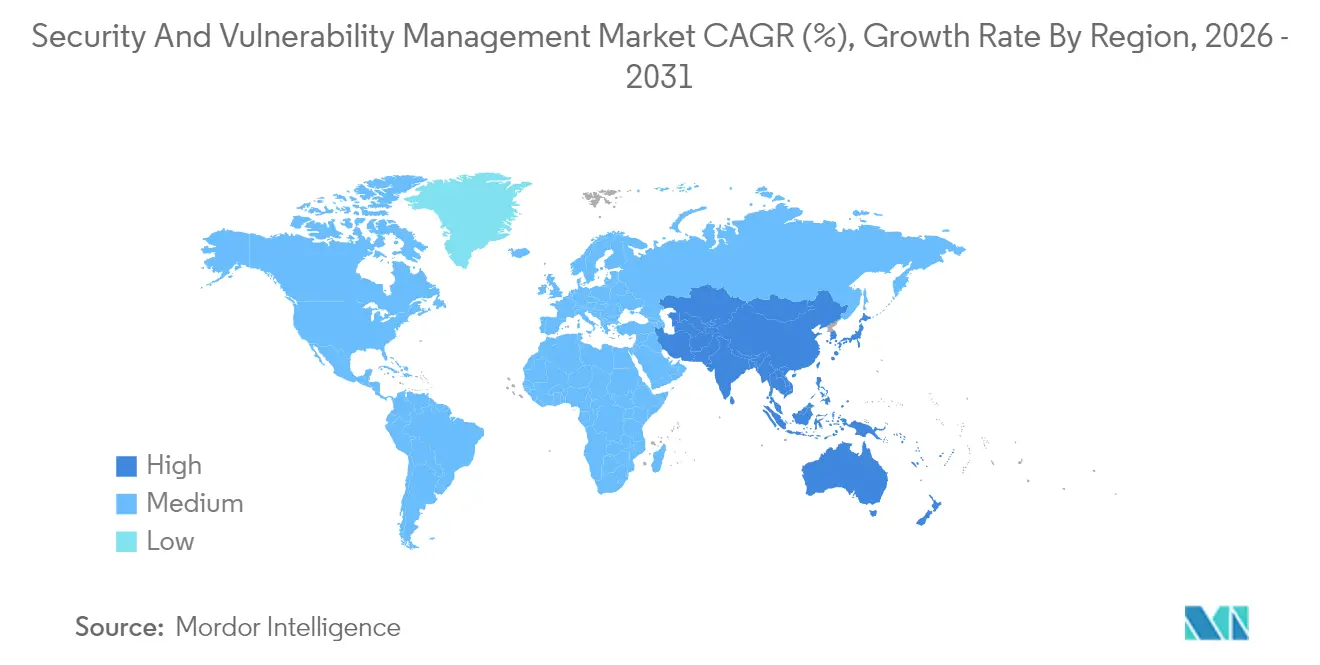
| Fastest Growing Market | Asia Pacific |
| Largest Market | North America |
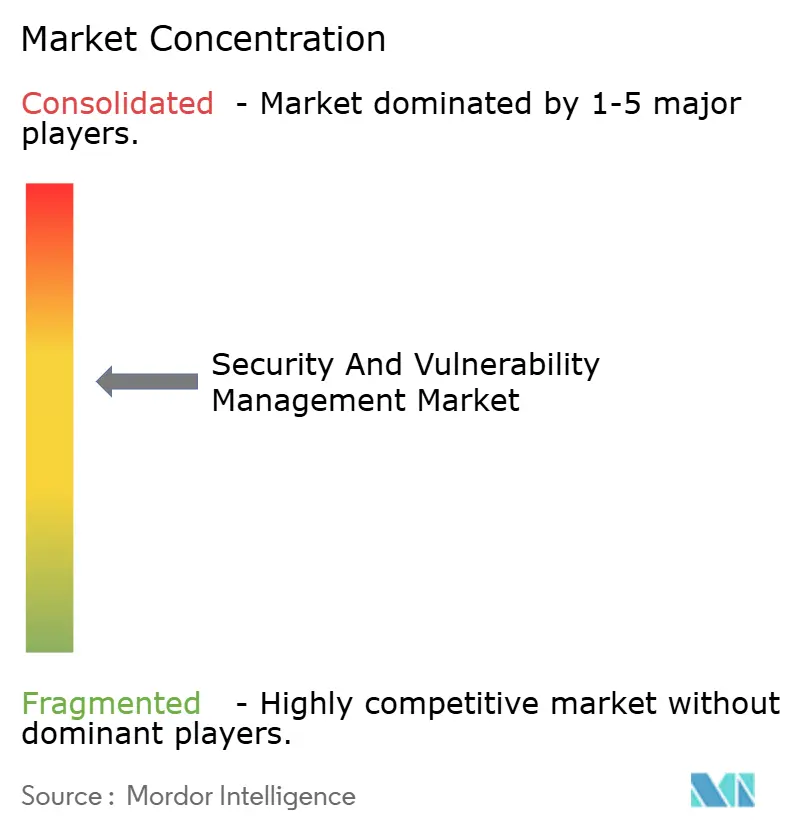
| Market Concentration | Medium |
Major Players *Disclaimer: Major Players sorted in no particular order Image © Mordor Intelligence. Reuse requires attribution under CC BY 4.0. | |
Security And Vulnerability Management Market Analysis by Mordor Intelligence
Security and Vulnerability Management market size in 2026 is estimated at USD 17.82 billion, growing from 2025 value of USD 16.75 billion with 2031 projections showing USD 24.27 billion, growing at 6.4% CAGR over 2026-2031. The Security and Vulnerability Management market continues to benefit from mandatory cyber-risk regulations, heightened board awareness, and a strategic shift toward unified exposure-management platforms that limit tool sprawl. Rapid digitization, AI-enabled attacks, and zero-trust adoption sustain budget growth despite macroeconomic pressure, showing the Security and Vulnerability Management market as a core pillar of enterprise resilience. Vendor consolidation remains a defining force because three-quarters of organizations want fewer suppliers, urging platform players to stretch from scanning to automated remediation. Risk-based analytics now outrank raw severity counts, reflecting how the Security and Vulnerability Management market aligns with insurers that demand continuous visibility for underwriting decisions[1]IBM Security, “2025 Threat Intelligence Index,” ibm.com.
Key Report Takeaways
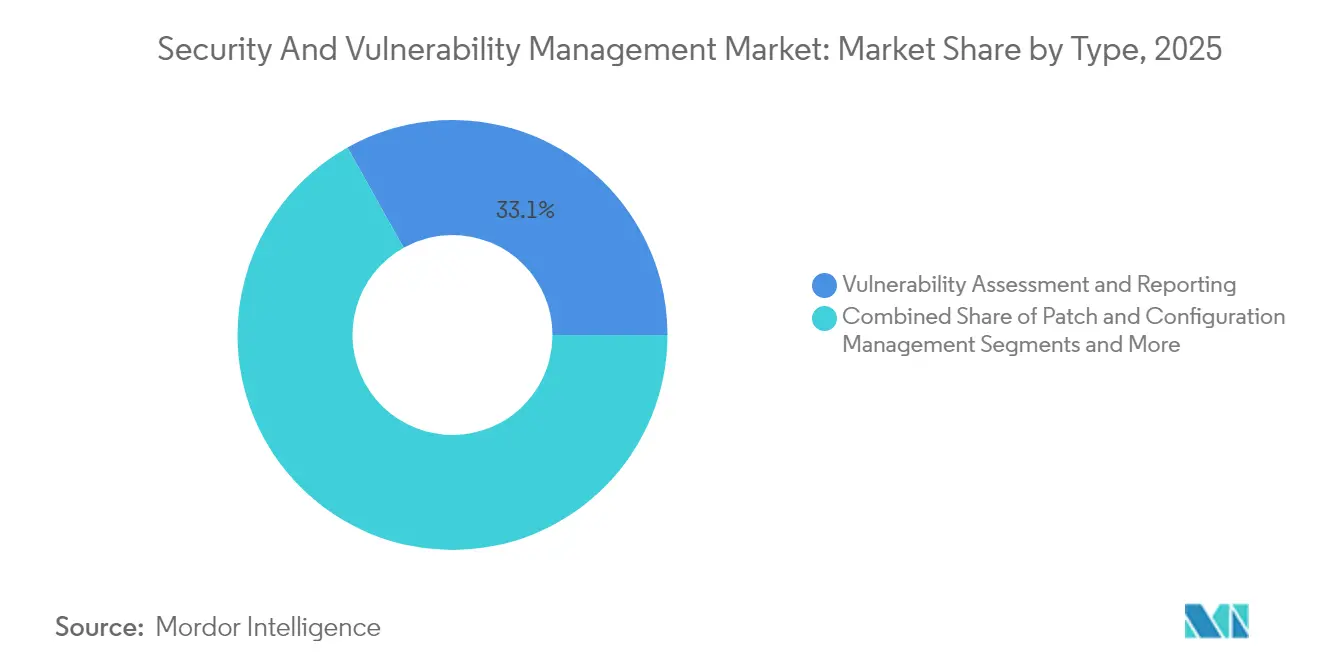
- By type, Vulnerability Assessment and Reporting accounted for 33.12% of the Security and Vulnerability Management market size in 2025, whereas Risk-Based Vulnerability Management (RBVM) is growing at a 6.85% CAGR.
- By deployment mode, on-premise solutions captured 68.25% of the Security and Vulnerability Management market in 2025, yet cloud deployment is rising at an 7.78% CAGR to 2031.
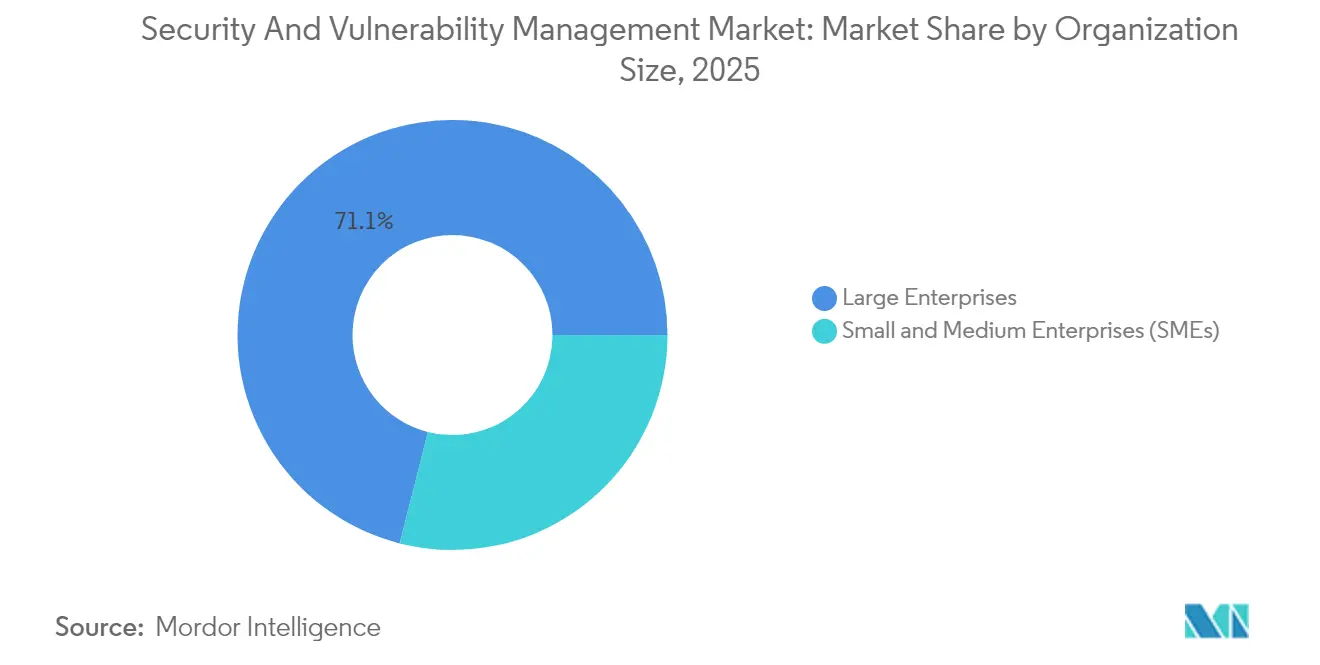
- By organization size, large enterprises generated 71.05% of 2025 revenues, but SMEs are expanding at an 7.55% CAGR.
- By end-user vertical, BFSI led with 22.32% revenue in 2025, and Healthcare and Life Sciences is forecast to grow at a 6.55% CAGR.
- By geography, North America held 37.12% of Security and Vulnerability Management market share in 2025, while Asia-Pacific is advancing at a 7.21% CAGR through 2031.
Note: Market size and forecast figures in this report are generated using Mordor Intelligence’s proprietary estimation framework, updated with the latest available data and insights as of 2026.
Market Trends and Insights
Drivers Impact Analysis of Security And Vulnerability Management Market*
| Driver | (~) % Impact on CAGR Forecast | Geographic Relevance | Impact Timeline |
|---|---|---|---|
| Rising volume and sophistication of cyber-attacks | +1.8% | Global, peak effect in APAC and North America | Short term (≤ 2 years) |
| Rapid cloud and DevOps adoption enlarging attack surface | +1.2% | Global, most visible in North America and Europe | Medium term (2-4 years) |
| Regulatory compliance and data sovereignty mandates | +1.5% | Europe (NIS2), North America (CMMC) | Medium term (2-4 years) |
| Proliferation of IoT/OT assets in critical infrastructure | +0.9% | Global, emphasised in manufacturing corridors | Long term (≥ 4 years) |
| Cyber-insurance underwriting needs continuous visibility | +0.7% | North America and Europe | Short term (≤ 2 years) |
| Software Bill of Materials mandates across supply chains | +0.4% | North America leading, spreading to EU and APAC | Medium term (2-4 years) |
| Source: Mordor Intelligence | |||
Rising Volume and Sophistication of Cyber-Attacks
IBM recorded an 84% year-on-year rise in infostealers delivered through phishing, while ChatGPT-4 exploited 87% of one-day CVEs when presented with identifiers, signalling a critical shift in adversarial capabilities. Manufacturing remains the most targeted industry as operational-technology gaps tempt extortionists. The Asia-Pacific region saw a 13% incident increase in 2024, reinforcing its priority within the Security and Vulnerability Management market. Identity-centric intrusions now make up 30% of breaches, turning credential theft into the main access vector. The Security and Vulnerability Management market therefore pivots toward exploitability-led prioritisation rather than blanket patching.
Rapid Cloud and DevOps Adoption Enlarging Attack Surface
Microsoft’s multicloud risk study found that 38% of organisations run publicly exposed, highly privileged workloads with critical vulnerabilities. Palo Alto Networks discovered that 80% of exposures sit in containerised environments, underscoring the complexity DevOps introduces. Although 68% of small firms claim DevSecOps practices, only 12% scan at each commit, creating opportunity for the Security and Vulnerability Management market to deliver embedded scanning. Agentless coverage, exemplified by Google Cloud’s Security Command Center, removes deployment friction and accelerates adoption across the Security and Vulnerability Management market.
Regulatory Compliance and Data Sovereignty Mandates
The EU NIS2 directive applies to roughly 350,000 entities and threatens fines up to EUR 10 million for non-compliance. In the United States, CMMC 2.0 defines cybersecurity maturity for every defence supplier handling controlled data. New York DFS Part 500 amendments add privileged-access duties and 24-hour incident thresholds for banks and insurers[2]New York State Department of Financial Services, “Cybersecurity Regulation Part 500 Amendments,” dfs.ny.gov. Mandatory SBOM filing now covers all new U.S. Army software contracts, increasing transparency across supply chains. These rules elevate spending, proving that the Security and Vulnerability Management market is no longer discretionary.
Proliferation of IoT/OT Assets in Critical Infrastructure
Armis reported a 200% jump in cyber events striking utilities and other operational-technology environments in 2024. NERC flagged latent OT vulnerabilities as a systemic reliability threat, urging around-the-clock monitoring across energy sites. Manufacturers plan to lift cybersecurity budgets to 7% of total IT outlay, directing up to 40% toward network security. The Security and Vulnerability Management market responds with specialised scanners that parse industrial protocols and identify unsupported firmware, guiding patch orchestration while minimising downtime.
Restraints Impact Analysis of Security And Vulnerability Management Market*
| Restraint | (~) % Impact on CAGR Forecast | Geographic Relevance | Impact Timeline |
|---|---|---|---|
| High total cost of ownership for SMEs | -0.8% | Global, most acute in emerging markets | Short term (≤ 2 years) |
| Shortage of skilled cybersecurity talent | -1.2% | Global, severe in APAC and North America | Long term (≥ 4 years) |
| Alert fatigue from vulnerability data overload | -0.6% | Global, concentrated among large enterprises | Medium term (2-4 years) |
| Vendor lock-in and consolidation concerns | -0.4% | North America and Europe | Medium term (2-4 years) |
| Source: Mordor Intelligence | |||
High Total Cost of Ownership for SMEs
Ninety-three percent of SME executives recognise cyber risk, yet only 36% invest in new tools because two-thirds cite cost hurdles. European studies reveal that 60% of breached SMEs shut within six months, illustrating budget tension. Hospitals in New York estimate yearly compliance bills that range from USD 50,000 for small facilities to USD 2 million for large networks. The Security and Vulnerability Management market answers with subscription models that bundle scanning, risk scoring, and dashboard analytics into a single cloud licence.
Shortage of Skilled Cybersecurity Talent
NERC reports that staffing gaps threaten compliance with critical-infrastructure standards and slow remediation. Only 41% of SMEs possess the technical depth to embed security checks into DevOps pipelines. IBM’s AI SOC co-pilots now triage alerts and recommend fixes, reflecting how automation mitigates skill scarcity. The Security and Vulnerability Management market therefore promotes AI-driven and managed-service offerings to close the human-capital gap.
*Our forecasts treat driver/restraint impacts as directional, not additive. The impact forecasts reflect baseline growth, mix effects, and variable interactions.
Security And Vulnerability Management Market Segment Analysis
By Type:
RBVM Gains Momentum within a Diversifying PortfolioThe Security and Vulnerability Management market size attributed to Vulnerability Assessment and Reporting stood at USD 5.55 billion in 2025, equivalent to 33.12% of total revenue. RBVM is expanding at 6.85% CAGR because buyers target the 3% of flaws that raise real risk, a strategy validated by Tenable’s Vulcan Cyber acquisition. Container and cloud workload scanning rise in tandem with Kubernetes adoption, while Application Security Testing integrates into posture-management platforms that cover code, pipeline, and runtime artefacts.
RBVM products now ingest threat-intelligence feeds, asset criticality scores, and exploit availability, generating ranked backlogs rather than static lists. The Security and Vulnerability Management market therefore migrates from detection to decision support. Patch-and-configuration modules remain crucial for regulated verticals, and IoT/OT scanners parse proprietary protocols to uncover firmware weaknesses. This diversity of modules foreshadows a single-pane-of-glass vision that anchors enterprise renewal cycles.



By Deployment Mode:
Cloud Uptake Challenges On-Premise SupremacyOn-premise deployments controlled 68.25% of the Security and Vulnerability Management market in 2025 as banks, defence primes, and utilities protect sensitive data inside physical boundaries. Nonetheless, cloud deployment is surging at an 7.78% CAGR through 2031. Google Cloud’s agentless vulnerability scanning eliminates software rollouts and speeds proof-of-concept efforts, raising the attractiveness of SaaS delivery.
Hybrid models dominate large-enterprise roadmaps because they combine low-latency scanning of internal networks with elastic cloud analytics. The Security and Vulnerability Management market thus evolves into a mesh of on-premise collectors, private-cloud nodes, and hyperscale analytics. Policy federations allow customers to meet NIS2 or CMMC obligations while capitalising on cloud benefits, ensuring that no deployment model alone will satisfy every control framework.
By Organization Size:
SME Upswing Complements Enterprise DominanceEnterprises generated 71.05% of 2025 revenue due to stringent certification requirements and mature SOC investments. They purchase platforms that integrate vulnerability intelligence, asset inventories, and automation with SIEM workflows. The Security and Vulnerability Management market supports these needs through APIs that sync ticketing, CMDB, and DevOps pipelines.
SMEs contribute smaller absolute volumes but grow faster at 7.55% CAGR. They gravitate toward turnkey SaaS packages that wrap scanning, prioritisation, and managed remediation into a single service. Critical Start, for example, pairs Qualys sensors with 24×7 analyst guidance to deliver enterprise-grade protection without complex staffing. The Security and Vulnerability Management market therefore balances deep-feature enterprise suites with simplified SME bundles, widening its total accessible pool.
By End-User Vertical:
Healthcare Accelerates While BFSI Steadies GrowthThe BFSI sector led with 22.32% Security and Vulnerability Management market share in 2025, driven by systemic-risk oversight and high breach penalties. Basel III updates and NY DFS Part 500 revisions require continuous control testing, pushing banks to maintain large-scale scanning grids.
Healthcare and Life Sciences is the fastest climber at a 6.55% CAGR because digitisation exposes patient data and connected devices. New York mandates that every hospital appoint a CISO and report incidents within 72 hours, providing a blueprint other states can replicate. OT-heavy manufacturing also invests heavily to prevent shutdown-level ransomware, making the Security and Vulnerability Management market integral to Industry 4.0 resilience.
Geography Analysis
North America Security And Vulnerability Management Market
North America dominated the Security and Vulnerability Management market with a 37.12% share in 2025. Federal mandates such as CMMC 2.0 and Executive Order 14144 embed continuous vulnerability governance into procurement rules. Canada and Mexico adopt similar baselines for cross-border critical-infrastructure projects, ensuring spending continuity. High breach costs, a large technology vendor base, and active cyber-insurance markets sustain leadership.
APAC Security And Vulnerability Management Market
Asia-Pacific registers the highest future CAGR at 7.21%. PwC projects regional cybersecurity outlays of USD 52 billion in 2027 as boards react to a 31% slice of global cyber incidents. Australia’s Cyber Security Act 2024 enforces baselines for smart devices and requires ransomware payment disclosure, while New Zealand’s NCSC implements public-sector controls. China, Japan, India, and South Korea drive manufacturing-led demand, pushing the Security and Vulnerability Management market into factory floors and cloud stacks alike.
EMEA and South America Security And Vulnerability Management Market
Europe follows a firm path as NIS2 takes effect across 27 member states, subjecting energy, transport, finance, and healthcare operators to penalty levels that reach EUR 10 million (USD 11.60 million). Germany, France, Italy, Spain, and the United Kingdom have adapted domestic legislation to align with the directive, creating steady project pipelines. South America and the Middle East and Africa record emerging momentum because digital services growth exposes fresh attack surfaces, prompting nations to draft strategies that reference EU and U.S. frameworks.

Regulatory Landscape
Regulation is tightening around continuous, risk-based vulnerability remediation across government, critical infrastructure, and regulated verticals. In the United States, CISA issued Binding Operational Directive (BOD) 26-04 on June 10, 2026, directing Federal Civilian Executive Branch agencies to prioritize security updates based on risk signals such as public exposure and Known Exploited Vulnerabilities (KEV), reinforcing a shift from CVSS-only programs to exploitability-led prioritization and measurable remediation outcomes. U.S. federal compliance guidance also continues to elevate software assurance and patch governance (for example, OMB M-25-04 for FY2025 federal information security and privacy management requirements).
In Europe, NIS2 (Directive (EU) 2022/2555) is being operationalized through technical rules that explicitly require vulnerability handling, disclosure, and mitigation processes. The European Commission published Implementing Regulation (EU) 2024/2690 on October 17, 2024, setting technical and methodological requirements for cybersecurity risk-management measures under NIS2, while ENISA published technical implementation guidance (version 1.0) in June 2025 to help entities translate obligations into controls. These frameworks push buyers toward documented remediation plans, audit-ready reporting, and toolchains that support vulnerability governance across IT, cloud, and supply chains.
Value Chain Analysis
The value chain begins with vulnerability intelligence and discovery inputs (CVE/NVD-style disclosures, threat intelligence, and exploited-vulnerability signals such as CISA KEV), alongside asset inventories and telemetry from endpoints, networks, cloud workloads, and OT. Core solution providers (platform vendors for vulnerability assessment, patch/configuration management, and risk-based vulnerability management) build analytics and orchestration layers that prioritize remediation and integrate with ITSM and DevOps tooling, CMDBs, and security operations workflows. Hyperscalers and cloud marketplaces increasingly act as distribution and adoption accelerators for cloud-delivered scanning and posture management, while managed security service providers bundle tooling with 24x7 operations for SME and mid-market buyers.
Downstream, delivery and remediation rely on patch publishers, configuration standards, and the enterprise change-management pipeline, where bottlenecks often stem from tool sprawl, alert fatigue, and skills gaps. Supply-chain assurance has also become a formal input to the chain: NIST SP 800-161 Rev. 1 (November 2024) elevates Cybersecurity Supply Chain Risk Management (C-SCRM) expectations across ICT procurement, including provenance and supplier resilience, which increases demand for SBOM-aware vulnerability workflows and third-party risk integration. As IT-OT convergence expands asset diversity, specialized OT discovery and protocol-aware scanning vendors feed data into unified exposure-management platforms to maintain end-to-end visibility.
Competitive Landscape
The Security and Vulnerability Management market exhibits moderate consolidation. Tenable, Qualys, Rapid7, IBM, and Palo Alto Networks rank as primary platform vendors. Tenable’s USD 147 million Vulcan Cyber buyout strengthens its exposure-management suite, illustrating a shift toward full-stack visibility. IBM offloaded QRadar SaaS to Palo Alto Networks to focus on AI-powered SOC workflows, demonstrating portfolio realignment.
Disruptors such as Wiz clinch high valuations for cloud-native risk models. CrowdStrike integrates endpoint telemetry with network vulnerability insights and partners with Fortinet to align firewall posture. Ecosystem alliances signal a move away from point solution battles toward shared-data fabrics. Start-ups concentrating on OT, SBOM analytics, and AI model scanning address gaps incumbents cannot yet cover at scale, proving that the Security and Vulnerability Management market supports both consolidation and specialised innovation.
Price competition intensifies in the SME segment, where subscription bundles win over capital-expense-heavy licences. In enterprises, differentiation hinges on risk-prioritisation accuracy, breadth of asset coverage, and workflow integration. The Security and Vulnerability Management market, therefore, balances value and feature depth across tiers.
Security And Vulnerability Management Industry Leaders
IBM Corporation
Qualys Inc.
Hewlett Packard Enterprise Company
Dell EMC
Broadcom Inc. (Symantec Corporation)
- *Disclaimer: Major Players sorted in no particular order
Security And Vulnerability Management Market Companies Covered in this Report
- Tenable Holdings Inc.
- Qualys Inc.
- Rapid7 Inc.
- IBM Corporation
- Cisco Systems Inc.
- Microsoft Corporation
- Broadcom Inc. (Symantec)
- Hewlett Packard Enterprise Company
- Dell Technologies Inc.
- Trend Micro Inc.
- Palo Alto Networks Inc.
- Check Point Software Technologies Ltd.
- CrowdStrike Holdings Inc.
- Fortinet Inc.
- McAfee Corp.
- Tripwire Inc. (Belden)
- Ivanti
- ServiceNow Inc.
- ATandT Cybersecurity (AlienVault)
- Skybox Security Inc.
- F-Secure Corporation
- Flexera Software LLC (Secunia Research)
- Netskope Inc.
Read Analysis of Security And Vulnerability Management Companies

Market Opportunities and Future Outlook
Regulatory-driven modernization is creating near-term whitespace for automated, risk-based remediation and audit-ready reporting that maps to government playbooks. CISA BOD 26-04 (June 2026) institutionalizes prioritization based on risk signals such as exposure and KEV status, raising the bar for vulnerability programs that can demonstrate triage logic and remediation progress, not just static severity lists. FedRAMP Public Notice 0014 also requires cloud service offerings to adopt new Vulnerability Detection and Response (VDR) and Vulnerability Evaluation and Reporting (VER) requirements by December 7, 2026, which supports demand for continuous scanning, normalized evidence collection, and machine-readable reporting that can be embedded into SaaS operations.
Platformization and supply-chain security are also shaping where vendors can expand. Accenture announced in June 2026 that it entered agreements to acquire a majority stake in Dragos and 100% of runZero and NetRise (combined enterprise value of about USD 4.175 billion) to build end-to-end capabilities spanning OT, asset discovery, and firmware and SBOM-oriented risk, reinforcing buyer preference for integrated exposure management across critical infrastructure and software supply chains. Investment and product development into cyber risk posture management and third-party risk visibility further supports this direction, including UpGuard raising USD 75 million in February 2026 to scale AI-powered capabilities and global go-to-market efforts. Taken together, these moves point to demand for unified exposure management that connects discovery, prioritization, and remediation across cloud, OT, and supplier ecosystems.
Recent Industry Developments in Security And Vulnerability Management Market
- July 2026: IBM and Red Hat expanded Project Lightwell with new commercial offerings focused on building automated software supply-chain trust infrastructure. The initiative centers on identifying, prioritizing, and remediating software vulnerabilities across open-source components, reinforcing a shift toward operationalized remediation rather than scan-only programs.
- March 2026: Qualys launched Agent Val, an AI agent for safe exploit validation and autonomous risk remediation within its Enterprise TruRisk Management offering. The release strengthens agentic workflows that validate exploitability and trigger remediation actions, helping organizations reduce alert fatigue and accelerate patch decisions.
- February 2025: Qualys introduced the Managed Risk Operations Center (mROC) Partner Alliance to help managed service providers scale cyber risk services. By formalizing a partner-led operations model around vulnerability and risk management, the program supports broader adoption among organizations that lack in-house security talent.


Security And Vulnerability Management Market Report Scope and Research Methodology
Market Definition and Coverage
This market covers software and related services used to find, assess, prioritize, and fix security vulnerabilities across IT assets, applications, and networks. Revenue is counted where tools or managed programs are directly used for vulnerability assessment, patching, configuration hardening, and remediation tracking.
Scope exclusions: Standalone incident response retainers and general IT outsourcing are excluded when they are not tied to vulnerability discovery and remediation workflows.
Segments Covered in This Report
- By Type
- Vulnerability Assessment and Reporting
- Patch and Configuration Management
- Risk-Based Vulnerability Management (RBVM)
- Container and Cloud Workload Scanning
- Application Security Testing
- IoT / OT Vulnerability Management
- By Deployment Mode
- On-premise
- Cloud
- By Organization Size
- Large Enterprises
- Small and Medium Enterprises (SMEs)
- By End-User Vertical
- BFSI
- Healthcare and Life Sciences
- Government and Defense
- IT and Telecom
- Manufacturing and Industrial
- Retail and E-Commerce
- Energy and Utilities
- Others
- By Geography
- North America
- United States
- Canada
- Mexico
- Europe
- Germany
- United Kingdom
- France
- Italy
- Spain
- Rest of Europe
- Asia-Pacific
- China
- Japan
- India
- South Korea
- Australia
- Rest of Asia-Pacific
- South America
- Brazil
- Argentina
- Rest of South America
- Middle East and Africa
- Middle East
- Saudi Arabia
- United Arab Emirates
- Turkey
- Rest of Middle East
- Africa
- South Africa
- Egypt
- Nigeria
- Rest of Africa
- Middle East
- North America
Data Sources, Market Sizing, and Validation
Desk Research
Desk research was used to build the first structure of the demand pool and to set reasonable bounds for adoption by region and industry. We relied on public and official source types such as the National Vulnerability Database (NVD), CISA advisories, NIST guidance, ENISA reports, and ITU security publications. These references helped track vulnerability volumes, severity patterns, and policy direction.
To keep the revenue model grounded, we also used supporting signals from public company filings, investor presentations, procurement announcements, association websites, and reputable technology press. Where needed, paid subscriptions that aggregate company financials, news, and patent activity were used to reduce manual gaps, especially for fast-changing product roadmaps and M&A context. These sources are illustrative only, and additional public references were used for data collection, validation, and clarification.
Primary Interviews and Surveys
Primary interviews focused on confirming what is actually bought and deployed, and how spending shifts between vulnerability assessment, patch and configuration management, and newer exposure management workflows. We spoke with a mix of security leaders, IT operations owners, and service delivery managers across major regions, so assumptions like pricing direction, renewal behavior, and the cloud versus on-premise mix could be checked and adjusted.
Distribution of primary research fieldwork respondents
| Company type | Respondent position | Region |
|---|---|---|
| Top tier: 30% | CXOs: 14% | APAC: 41% |
| Mid tier: 56% | Functional/Unit leaders: 39% | EMEA: 37% |
| Smaller Players: 14% | Managers: 47% | Americas: 22% |
Market-Sizing & Forecasting
Sizing started from a top-down build where security spending pools were reconstructed by region and then filtered through vulnerability management use cases using adoption and penetration indicators. After setting the demand pool, we used selective bottom-up approximations to sanity-check totals, including sampled price bands by deployment type, typical seat or asset coverage ranges, and channel feedback on mid-market deal sizes.
Inputs were chosen because they connect to observable buying behavior and can be updated each year. For this market, we relied on indicators such as reported vulnerability volumes and severity distributions, enterprise cloud migration intensity, regulatory pressure and audit activity, patch cadence expectations, and managed security service uptake by industry. Where data was uneven, for example smaller provider revenue disclosure, gaps were handled with conservative ranges, then narrowed using interview feedback on customer mix and average contract profiles.
For forecasting, we used scenario analysis so growth could be explained through a small set of drivers that primary respondents agreed on, including breach and exposure concerns, automation needs in remediation, and the shift toward continuous visibility. The final time series was reviewed against the modeled drivers year by year so the curve remained realistic rather than overly smooth.
Data Validation & Update Cycle
Outputs are checked using triangulation across multiple independent signals, and then variance is reviewed at the region and segment level before sign-off. When a value looks out of line, we re-open assumptions that commonly drive the gap, such as adoption rate, price progression, or cloud mix, and we trigger a quick re-contact with relevant respondents.
A multi-step analyst review is used so calculation logic, unit consistency, and currency handling are verified. Reports are refreshed annually, and interim updates are made when major events materially change spending, such as large regulatory shifts or step-changes in exploit activity. Before delivery, a final pass is completed to ensure the latest public releases are reflected in the model.
Mordor Intelligence's Security and Vulnerability Management Market Size Versus Other Published Estimates
Published market sizes for security and vulnerability management can look different even when they sound like they cover the same topic, since firms may count different tool categories, use different base years, or assume different price expansion paths. Differences also show up when services are counted broadly, for example bundling unrelated security operations work into the same spending bucket.
By tracking vulnerability workflow revenues by type and deployment and then refreshing currency timing and segment mix checks, Mordor Intelligence keeps the 2026 size aligned to what is directly purchased for assessment, patching, and remediation, instead of loosely grouping adjacent cybersecurity spend. The remaining gaps usually come from how exposure management platforms are treated, whether managed services are limited to vulnerability work only, and how aggressively cloud migration is assumed to lift per-customer pricing.
Benchmark comparison
| Source | Market Size | Gaps in Research Methodology |
|---|---|---|
| Mordor Intelligence | USD 17.82 B (2026) | |
| Global Consultancy A | USD 17.90 B (2025) | Uses a 2025 base year and may treat platform spend across broader security programs as part of vulnerability management, which can lift the starting value versus a workflow-only boundary. |
| Industry Research Group B | USD 17.63 B (2025) | Anchors on a 2024 baseline with 2025 projections and may apply a different price progression for cloud deployments, which shifts the curve even when segment labels look similar. |
The spread in the table is mostly explained by year alignment and what gets counted inside the spending bucket, especially for bundled platforms and service programs. With clear inclusions, repeatable filters, and checks tied to adoption and pricing signals, the estimate stays practical to update and easier to trace back to observable drivers.


Key Questions Answered in the Report
How large is the Security and Vulnerability Management market today, and where will it be in 2031?
The Security and Vulnerability Management market is valued at USD 17.82 billion in 2026 and is projected to reach USD 24.27 billion by 2031.
Which product segment is expanding fastest?
Risk-Based Vulnerability Management is growing at a 6.85% CAGR because organisations prioritise vulnerabilities by real-world exploitability rather than volume.
Why does Asia-Pacific present the highest growth opportunity?
Rapid digital transformation and new rules like Australia’s Cyber Security Act 2024 lift cybersecurity budgets 12.8% each year, producing a 7.21% CAGR.
What factors are driving cloud deployment of vulnerability tools?
Agentless scanning, elastic scaling, and reduced maintenance costs make SaaS models attractive even to regulated sectors that still keep critical data on-premise.
How do regulations influence buying decisions?
Frameworks such as NIS2 in Europe and CMMC 2.0 in the United States impose substantial fines, compelling firms to adopt continuous vulnerability-management platforms.
Is vendor consolidation evident in the market?
Yes. Three-quarters of enterprises aim to reduce tool counts, and acquisitions like Tenable-Vulcan Cyber and Wiz-Dazz confirm ongoing consolidation.
Page last updated on:





